. 2016 Jul 28:17:291.
doi: 10.1186/s12859-016-1083-9.

flowVS: channel-specific variance stabilization in flow cytometry

Affiliations

flowVS: channel-specific variance stabilization in flow cytometry

Ariful Azad et al. BMC Bioinformatics. .

Abstract

Background: Comparing phenotypes of heterogeneous cell populations from multiple biological conditions is at the heart of scientific discovery based on flow cytometry (FC). When the biological signal is measured by the average expression of a biomarker, standard statistical methods require that variance be approximately stabilized in populations to be compared. Since the mean and variance of a cell population are often correlated in fluorescence-based FC measurements, a preprocessing step is needed to stabilize the within-population variances.

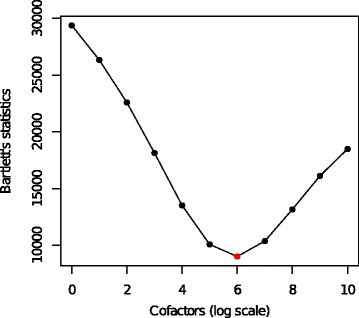
Results: We present a variance-stabilization algorithm, called flowVS, that removes the mean-variance correlations from cell populations identified in each fluorescence channel. flowVS transforms each channel from all samples of a data set by the inverse hyperbolic sine (asinh) transformation. For each channel, the parameters of the transformation are optimally selected by Bartlett's likelihood-ratio test so that the populations attain homogeneous variances. The optimum parameters are then used to transform the corresponding channels in every sample. flowVS is therefore an explicit variance-stabilization method that stabilizes within-population variances in each channel by evaluating the homoskedasticity of clusters with a likelihood-ratio test. With two publicly available datasets, we show that flowVS removes the mean-variance dependence from raw FC data and makes the within-population variance relatively homogeneous. We demonstrate that alternative transformation techniques such as flowTrans, flowScape, logicle, and FCSTrans might not stabilize variance. Besides flow cytometry, flowVS can also be applied to stabilize variance in microarray data. With a publicly available data set we demonstrate that flowVS performs as well as the VSN software, a state-of-the-art approach developed for microarrays.

Conclusions: The homogeneity of variance in cell populations across FC samples is desirable when extracting features uniformly and comparing cell populations with different levels of marker expressions. The newly developed flowVS algorithm solves the variance-stabilization problem in FC and microarrays by optimally transforming data with the help of Bartlett's likelihood-ratio test. On two publicly available FC datasets, flowVS stabilizes within-population variances more evenly than the available transformation and normalization techniques. flowVS-based variance stabilization can help in performing comparison and alignment of phenotypically identical cell populations across different samples. flowVS and the datasets used in this paper are publicly available in Bioconductor.

Keywords: Bartlett’s test; Flow cytometry; Microarrays; Variance stabilization.


Figures

Fig. 1
Fig. 1
Mean fluorescence intensities (MFIs) of one-dimensional cell populations (also called density peaks) are plotted against the variances of the populations. Blood samples were collected from five healthy individuals on different days and stained with labeled antibodies against five biomarkers (see Section 3). Samples are compensated and gated for the lymphocytes, but no transformation is used. Populations identified in each fluorescence channel are shown with the same symbol and color. We observe that without proper transformation, variance increases monotonically with MFI
Fig. 2
Fig. 2
Subfigs. (a) and (b) show the 2D-projections of T-cell subpopulations from two samples in the ITN data set. Distributions of CD8 marker are shown below the corresponding samples in Subfigs. (c) and (d)
Fig. 3
Fig. 3
Identifying lymphocytes by a two-step gating from a representative sample in the HD data set. a We select an approximate rectangular region in the lower left corner of side-scatter vs. forward-scatter plot. b A dense elliptical region within the rectangular gate defines lymphocytes
Fig. 4
Fig. 4
Transforming five fluorescence channels in HD data. Subfigures in the top row show Bartlett’s statistic computed from density peaks after data are transformed by different cofactors. An optimum cofactor is obtained where Bartlett’s statistic reaches the minimum. The bottom row shows the density plots after the data are transformed by an asinh transformation with the optimum cofactors
Fig. 5
Fig. 5
Transforming four fluorescence channels in ITN data. Subfigures in the top row show Bartlett’s statistic computed from density peaks after data are transformed by different cofactors. An optimum cofactor is obtained where Bartlett’s statistic reaches the minimum. The bottom row shows the density plots after the data are transformed by the optimum cofactor
Fig. 6
Fig. 6
Transforming CD4 channels in HD data by four transformation algorithms. The top row shows the density plots after the data are optimally transformed by different transformations. The bottom row shows the standard deviation of density peaks against the rank of MFI
Fig. 7
Fig. 7
Transforming CD4 channels in ITN data by four transformation algorithms. The top row shows the density plots after the data are optimally transformed by different transformations. The bottom row shows the standard deviation of density peaks against the rank of MFI
Fig. 8
Fig. 8
The Q-Q plots for the eight 1-D clusters obtained from a representative sample in the HD data set. Every Q-Q plot shows linearity in the central part, except for a little deviation at the end, indicating that the clusters approximately follow normal distributions with heavier tails
Fig. 9
Fig. 9
For kidney microarray data [18], flowVs selects the optimum cofactor for the asinh transformation by minimizing Bartlett’s statistic. The cofactors are shown in the natural logarithm scale
Fig. 10
Fig. 10
The standard deviation and mean of each gene from the kidney data are plotted before transformation and after variance stabilization by flowVs, VSN, and DDHFm. Loess regression is used to smoothen the curves
Fig. 11
Fig. 11
Variance stabilization of the kidney microarray data [18] by (a) flowVs and (b) VSN [18]. Each black dot plots the standard deviation of a gene against the rank of its mean. The red lines depict the running median estimator. If there is no mean-variance dependence, then the red lines should be approximately horizontal

References

    1. Peters JM, Ansari MQ. Multiparameter flow cytometry in the diagnosis and management of acute leukemia. Arch Pathol Lab Med. 2011;135(1):44–54. - PubMed
    1. Seder RA, Darrah PA, Roederer M. T-cell quality in memory and protection: implications for vaccine design. Nat Rev Immunol. 2008;8(4):247–58. doi: 10.1038/nri2274. - DOI - PubMed
    1. Pyne S, Hu X, Wang K, Rossin E, Lin TI, Maier LM, Baecher-Allan C, McLachlan GJ, Tamayo P, Hafler DA, et al. Automated high-dimensional flow cytometric data analysis. Proc Natl Acad Sci. 2009;106(21):8519–524. doi: 10.1073/pnas.0903028106. - DOI - PMC - PubMed
    1. Perfetto SP, Chattopadhyay PK, Roederer M. Seventeen-colour flow cytometry: unravelling the immune system. Nat Rev Immunol. 2004;4(8):648–55. doi: 10.1038/nri1416. - DOI - PubMed
    1. Azad A, Rajwa B, Pothen A. Immunophenotypes of acute myeloid leukemia from flow cytometry data using templates. 2014. http://arxiv.org/abs/1403.6358.

Publication types