

Brief Report: Estimating Differences and Ratios in Median Times to Event
- PMID: 27465526
- PMCID: PMC5039102
- DOI: 10.1097/EDE.0000000000000539
Brief Report: Estimating Differences and Ratios in Median Times to Event
Abstract
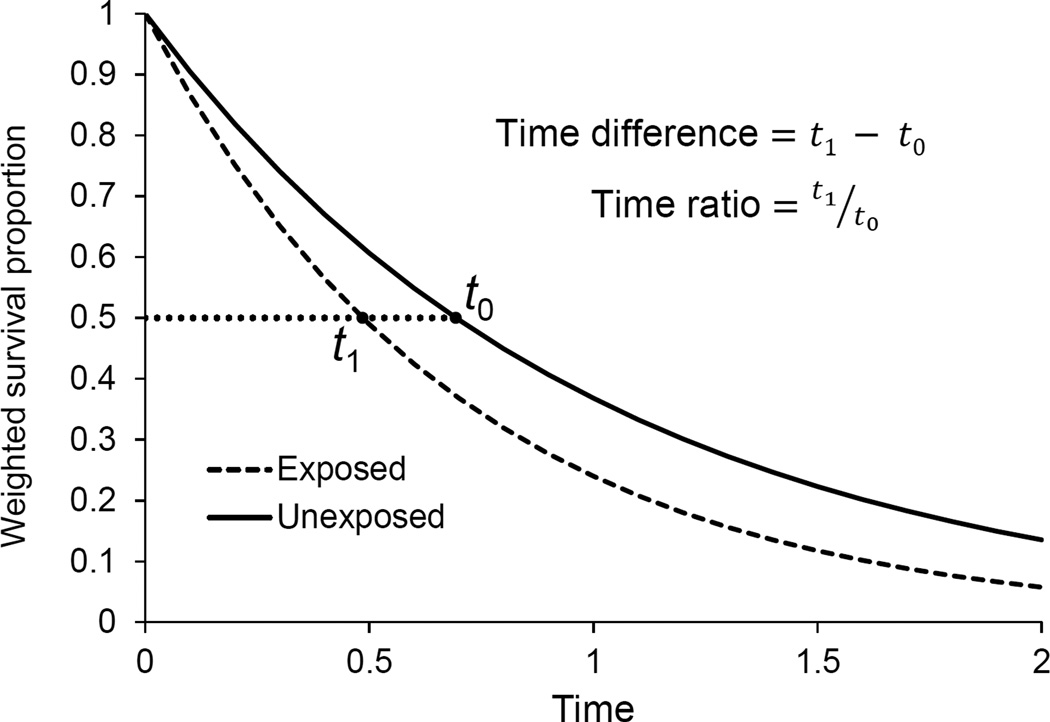
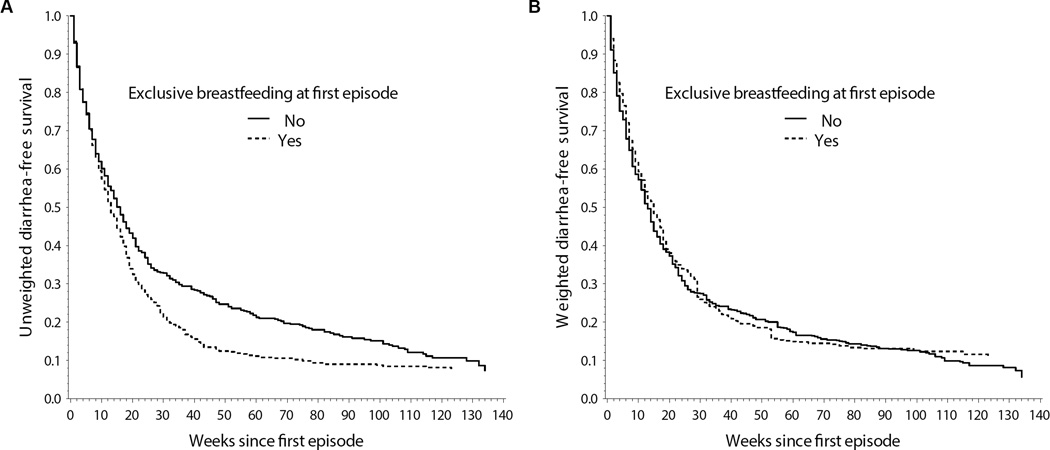
Time differences and time ratios are often more interpretable estimates of effect than hazard ratios for time-to-event data, especially for common outcomes. We developed a SAS macro for estimating time differences and time ratios between baseline-fixed binary exposure groups based on inverse probability-weighted Kaplan-Meier curves. The macro uses pooled logistic regression to calculate inverse probability of censoring and exposure weights, draws Kaplan-Meier curves based on the weighted data, and estimates the time difference and time ratio at a user-defined survival proportion. The macro also calculates the risk difference and risk ratio at a user-specified time. Confidence intervals are constructed by bootstrap. We provide an example assessing the effect of exclusive breastfeeding during diarrhea on the incidence of subsequent diarrhea in children followed from birth to 3 years in Vellore, India. The SAS macro provided here should facilitate the wider reporting of time differences and time ratios.
Figures
References
-
- Cox DR. Regression models and life-tables. Journal of the Royal Statistical Society Series B Methodological. 1972;34:187–220.
-
- Wei LJ. The accelerated failure time model: a useful alternative to the Cox regression model in survival analysis. Stat Med. 1992;11(14–15):1871–1879. - PubMed
-
- Cole SR, Chu H. Effect of acyclovir on herpetic ocular recurrence using a structural nested model. Contemp Clin Trials. 2005;26(3):300–310. - PubMed
-
- Ibrahim JG, Chen M-H, Sinha D. Bayesian Survival Analysis. New York, NY: Springer New York; 2001. [Accessed December 22, 2015]. http://link.springer.com/10.1007/978-1-4757-3447-8. - DOI
Publication types
MeSH terms
Grants and funding
LinkOut - more resources
Full Text Sources
Other Literature Sources
