

Loss of REDD1 augments the rate of the overload-induced increase in muscle mass
- PMID: 27465734
- PMCID: PMC5142228
- DOI: 10.1152/ajpregu.00159.2016
Loss of REDD1 augments the rate of the overload-induced increase in muscle mass
Abstract
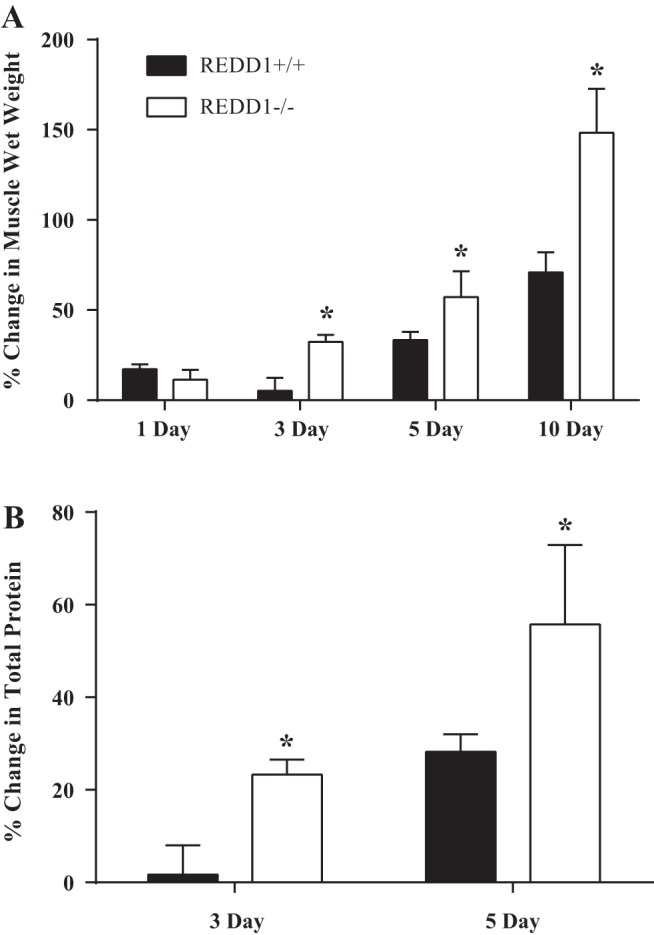
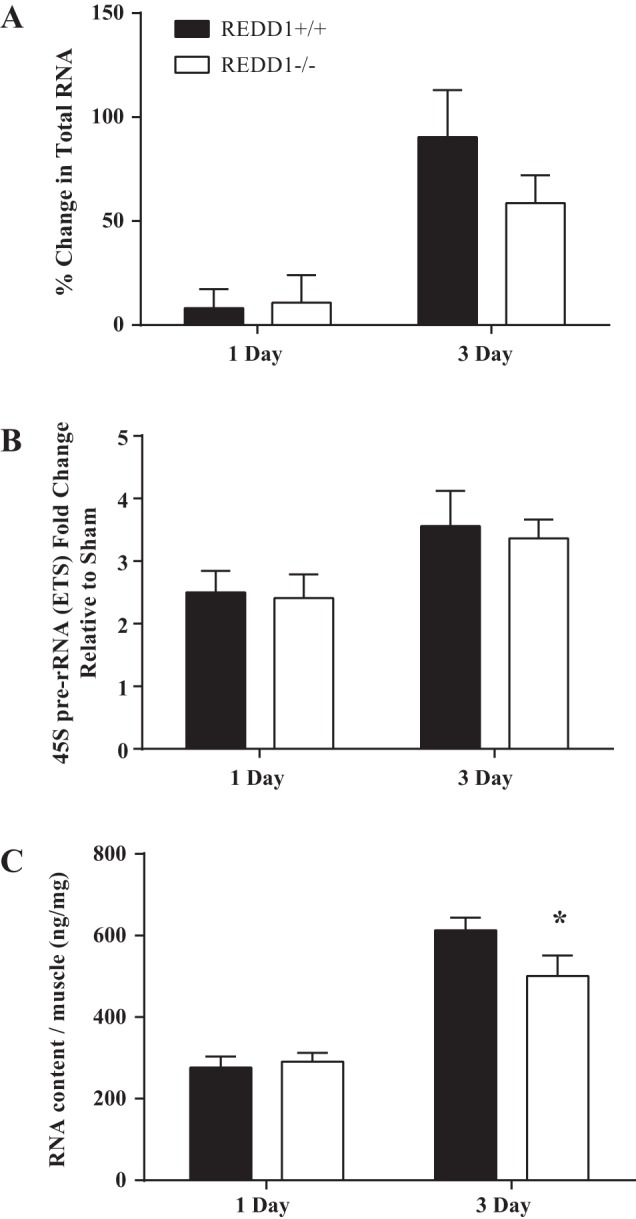
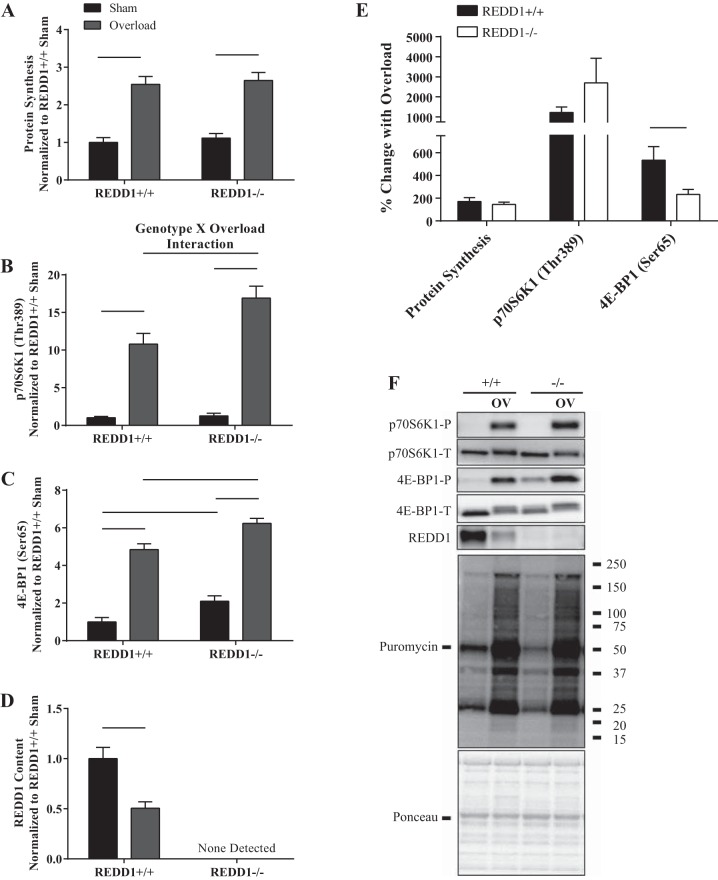
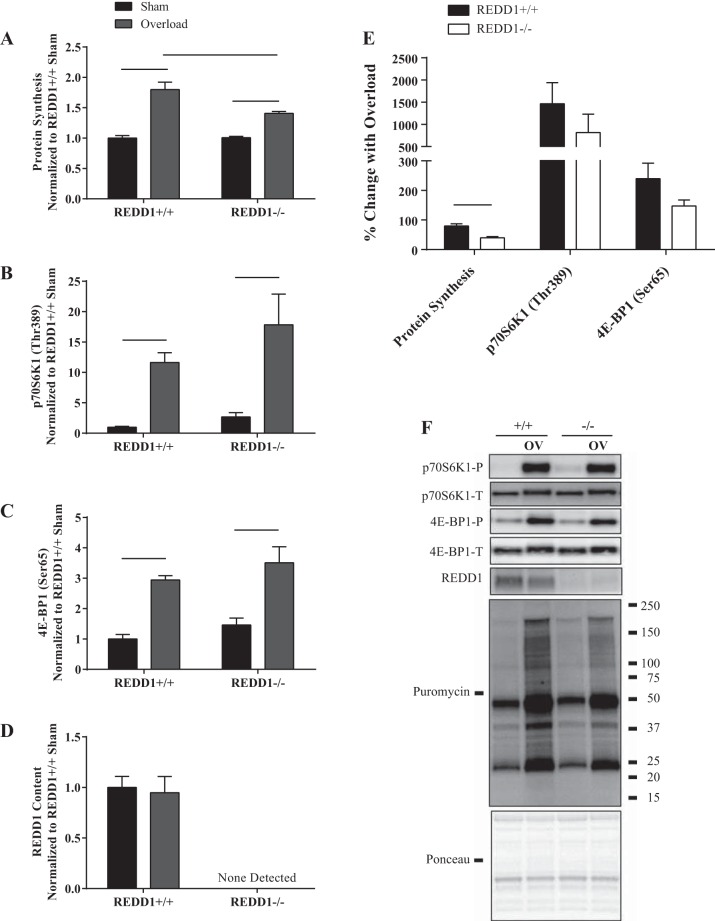
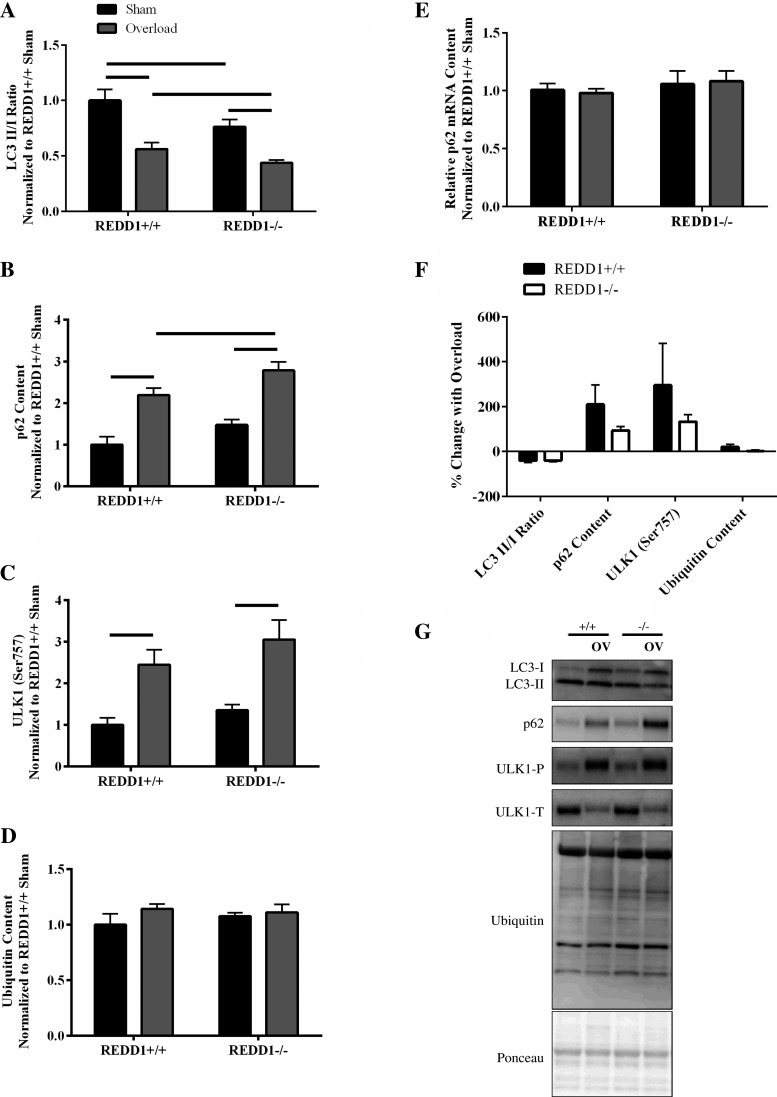
The overload-induced increase in muscle mass is accompanied by protein accretion; however, the initiating events are poorly understood. Regulated in Development and DNA Damage 1 (REDD1), a repressor of the mechanistic target of rapamycin in complex 1 (mTORC1), blunts the elevation in protein synthesis induced by acute muscle contractions. Therefore, this study was designed to determine whether REDD1 alters the rate of the overload-induced increase in muscle mass. Wild-type (WT) and REDD1-null mice underwent unilateral functional overload (OV) of the plantaris, while the contralateral sham leg served as a control. After 3 and 5 days of OV, puromycin incorporation was used as a measurement of protein synthesis. The percent increase in plantaris wet weight and protein content was greater in REDD1-null mice after 3, 5, and 10 days OV. The overload-stimulated rate of protein synthesis in the plantaris was similar between genotypes after 3 days OV, but translational capacity was lower in REDD1-null mice, indicating elevated translational efficiency. This was likely due to elevated absolute mTORC1 signaling [phosphorylation of p70S6K1 (Thr-389) and 4E-BP1 (Ser-65)]. By 5 days of OV, the rate of protein synthesis in REDD1-null mice was lower than WT mice with no difference in absolute mTORC1 signaling. Additionally, markers of autophagy (LC3II/I ratio and p62 protein) were decreased to a greater absolute extent after 3 days OV in REDD1-null mice. These data suggest that loss of REDD1 augments the rate of the OV-induced increase in muscle mass by altering multiple protein balance pathways.
Keywords: autophagy; protein synthesis; resistance exercise; ribosome biogenesis.
Copyright © 2016 the American Physiological Society.
Figures
Similar articles
-
Castration alters protein balance after high-frequency muscle contraction.J Appl Physiol (1985). 2017 Feb 1;122(2):264-272. doi: 10.1152/japplphysiol.00740.2016. Epub 2016 Dec 1. J Appl Physiol (1985). 2017. PMID: 27909227 Free PMC article.
-
Reduced REDD1 expression contributes to activation of mTORC1 following electrically induced muscle contraction.Am J Physiol Endocrinol Metab. 2014 Oct 15;307(8):E703-11. doi: 10.1152/ajpendo.00250.2014. Epub 2014 Aug 26. Am J Physiol Endocrinol Metab. 2014. PMID: 25159324 Free PMC article.
-
Nutrient-induced stimulation of protein synthesis in mouse skeletal muscle is limited by the mTORC1 repressor REDD1.J Nutr. 2015 Apr;145(4):708-13. doi: 10.3945/jn.114.207621. Epub 2015 Feb 25. J Nutr. 2015. PMID: 25716553 Free PMC article.
-
Emerging role for regulated in development and DNA damage 1 (REDD1) in the regulation of skeletal muscle metabolism.Am J Physiol Endocrinol Metab. 2016 Jul 1;311(1):E157-74. doi: 10.1152/ajpendo.00059.2016. Epub 2016 May 17. Am J Physiol Endocrinol Metab. 2016. PMID: 27189933 Free PMC article. Review.
-
Is REDD1 a Metabolic Éminence Grise?Trends Endocrinol Metab. 2016 Dec;27(12):868-880. doi: 10.1016/j.tem.2016.08.005. Epub 2016 Sep 6. Trends Endocrinol Metab. 2016. PMID: 27613400 Free PMC article. Review.
Cited by
-
Amino Acid Trafficking and Skeletal Muscle Protein Synthesis: A Case of Supply and Demand.Front Cell Dev Biol. 2021 May 31;9:656604. doi: 10.3389/fcell.2021.656604. eCollection 2021. Front Cell Dev Biol. 2021. PMID: 34136478 Free PMC article. Review.
-
Molecular Regulation of Exercise-Induced Muscle Fiber Hypertrophy.Cold Spring Harb Perspect Med. 2018 Jun 1;8(6):a029751. doi: 10.1101/cshperspect.a029751. Cold Spring Harb Perspect Med. 2018. PMID: 28490543 Free PMC article. Review.
-
The duration of glucocorticoid treatment alters the anabolic response to high-force muscle contractions.J Appl Physiol (1985). 2023 Jul 1;135(1):183-195. doi: 10.1152/japplphysiol.00113.2023. Epub 2023 Jun 8. J Appl Physiol (1985). 2023. PMID: 37289956 Free PMC article.
-
Exercise and the control of muscle mass in human.Pflugers Arch. 2019 Mar;471(3):397-411. doi: 10.1007/s00424-018-2217-x. Epub 2018 Oct 11. Pflugers Arch. 2019. PMID: 30310991 Review.
-
Senolytic treatment rescues blunted muscle hypertrophy in old mice.Geroscience. 2022 Aug;44(4):1925-1940. doi: 10.1007/s11357-022-00542-2. Epub 2022 Mar 24. Geroscience. 2022. PMID: 35325353 Free PMC article.
References
-
- Adams GR, Haddad F, Baldwin KM. Time course of changes in markers of myogenesis in overloaded rat skeletal muscles. J Appl Physiol (1985) 87: 1705–1712, 1999. - PubMed
-
- Bodine SC, Stitt TN, Gonzalez M, Kline WO, Stover GL, Bauerlein R, Zlotchenko E, Scrimgeour A, Lawrence JC, Glass DJ, Yancopoulos GD. Akt/mTOR pathway is a crucial regulator of skeletal muscle hypertrophy and can prevent muscle atrophy in vivo. Nat Cell Biol 3: 1014–1019, 2001. - PubMed
-
- Bradford MM. A rapid and sensitive method for the quantitation of microgram quantities of protein utilizing the principle of protein-dye binding. Anal Biochem 72: 248–254, 1976. - PubMed
-
- Britto FA, Begue G, Rossano B, Docquier A, Vernus B, Sar C, Ferry A, Bonnieu A, Ollendorff V, Favier FB. REDD1 deletion prevents dexamethasone-induced skeletal muscle atrophy. Am J Physiol Endocrinol Metab 307: E983–E993, 2014. - PubMed
-
- Corradetti MN, Inoki K, Guan KL. The stress-inducted proteins RTP801 and RTP801L are negative regulators of the mammalian target of rapamycin pathway. J Biol Chem 280: 9769–9772, 2005. - PubMed
Publication types
MeSH terms
Substances
Grants and funding
LinkOut - more resources
Full Text Sources
Other Literature Sources