. 2016 Sep 15;128(11):1475-89.
doi: 10.1182/blood-2016-02-698027. Epub 2016 Jul 27.

IL-15 activates mTOR and primes stress-activated gene expression leading to prolonged antitumor capacity of NK cells

Affiliations

IL-15 activates mTOR and primes stress-activated gene expression leading to prolonged antitumor capacity of NK cells

Yumeng Mao et al. Blood. .

Abstract

Treatment of hematological malignancies by adoptive transfer of activated natural killer (NK) cells is limited by poor postinfusion persistence. We compared the ability of interleukin-2 (IL-2) and IL-15 to sustain human NK-cell functions following cytokine withdrawal to model postinfusion performance. In contrast to IL-2, IL-15 mediated stronger signaling through the IL-2/15 receptor complex and provided cell function advantages. Genome-wide analysis of cytosolic and polysome-associated messenger RNA (mRNA) revealed not only cytokine-dependent differential mRNA levels and translation during cytokine activation but also that most gene expression differences were primed by IL-15 and only manifested after cytokine withdrawal. IL-15 augmented mammalian target of rapamycin (mTOR) signaling, which correlated with increased expression of genes related to cell metabolism and respiration. Consistently, mTOR inhibition abrogated IL-15-induced cell function advantages. Moreover, mTOR-independent STAT-5 signaling contributed to improved NK-cell function during cytokine activation but not following cytokine withdrawal. The superior performance of IL-15-stimulated NK cells was also observed using a clinically applicable protocol for NK-cell expansion in vitro and in vivo. Finally, expression of IL-15 correlated with cytolytic immune functions in patients with B-cell lymphoma and favorable clinical outcome. These findings highlight the importance of mTOR-regulated metabolic processes for immune cell functions and argue for implementation of IL-15 in adoptive NK-cell cancer therapy.


Figures

Figure 1
Figure 1
IL-15 primes NK cells with improved survival and cytolytic activity following cytokine withdrawal. Primary human NK cells were isolated from fresh peripheral blood mononuclear cells (PBMCs) and activated with IL-2 or IL-15 (both at 18.3 ng/mL) for 48 hours. (A) Cytolytic capacity against NK-sensitive target K562 (effector-to-target [E:T] ratio = 5:1) and proliferation of resting or cytokine activated human NK cells were measured by chromium release assay and thymidine incorporation assay, respectively. Following cytokine activation for 48 hours, NK cells were cultivated without cytokines (cytokine withdrawal) for an additional 24 hours and tested for their (B) cytolytic activity against K562 cells or (C) viability. Flow cytometry analysis of NK cells following cytokine activation including (D) frequencies of CD25+ cells, (E) expression of membrane-bound cytokines, and cytokine receptor complexes; intracellular expression of Bcl-2; and phosphorylation of STAT-3 (Y705) and STAT-5 (Y694). Results from multiple donors (n > 5) were summarized and are presented as mean ± SD. *P < .05; ***P < .001; Mann-Whitney nonparametric U test. cyt., cytokine; n.s., not significant.
Figure 2
Figure 2
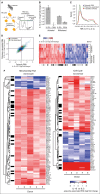
Abundant differential cytosolic mRNA levels and differential translation between NK cells activated with IL-15 or IL-2 following cytokine withdrawal. (A) Overview of gene expression studies. Isolation of polysome-associated mRNA (ie, associated with >2 ribosomes) and cytosolic mRNA from 6 donors and 4 conditions followed by generation of smartSeq2 RNAseq libraries. (B) Relative (IL-15 vs IL-2) polysome-associated mRNA levels for IL-2Rα and CD56 after 48 hours of cytokine activation and following withdrawal for an additional 24 hours. (C) Densities of genome-wide FDRs comparing IL-15– to IL-2–activated cells post-cytokine withdrawal using data from cytosolic or polysome-associated mRNA and translational efficiency as identified by anota. (D) Genome-wide log2 fold changes (IL-15 vs IL-2) following cytokine withdrawal using data from cytosolic or polysome-associated mRNA. mRNAs with differential polysome-association (green) or differential translational efficiency (red; by anota analysis) are indicated. (E) Heatmap showing log2 fold changes using data from cytosolic or polysome-associated mRNA for mRNAs showing differential polysome association between NK cells activated with IL-15 vs IL-2 following cytokine withdrawal. (F) Heatmap showing log2 fold changes using data from polysome-associated mRNA for differentially expressed genes belonging to the indicated gene ontology (GO) processes. (E-F) The sidebar indicates differentially translated genes identified by anota analysis (black).
Figure 3
Figure 3
IL-15 primes a stress-induced gene expression program in NK cells. (A) A heatmap of mean polysome-association (log2) per condition (A = activated, W = cytokine withdrawal) for mRNAs showing differential (IL-15 vs IL-2) polysome association after cytokine withdrawal. Clustering was performed using data from this set of mRNAs across all 4 conditions. The right sidebar indicates the identified gene subsets; the left sidebar shows proportions of genes regulated by differential translation (anota) per subset. Clusters corresponding to induced or primed modes of regulation are indicated. Across genes mean ± SD per condition and cluster is also plotted. (B) A heatmap illustrating results from enrichment analysis within subsets identified in panel A for cellular processes defined by GO. The color scale indicates significance for enrichment for GO terms identified as enriched in at least 1 subset (FDR <0.1 and odds ratio >1.5). (C) Freshly isolated human primary NK cells were activated (A) with IL-2 or IL-15 (18.3 ng/mL) for 48 hours with or without torin-1 (1 µM) and subsequently deprived of cytokines for 24 hours (W). Phosphorylation of the mTOR target S6 kinase was determined by western blot and compared with total S6K. Actin served as a loading control.
Figure 4
Figure 4
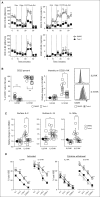
mTOR contributes to IL-15–associated protective and metabolic benefits in human NK cells. Freshly isolated primary human NK cells were activated with IL-2 or IL-15 for 48 hours in the presence of DMSO or the selective mTOR inhibitor torin-1 (1 μM). (A) The real-time OCR (picomoles per minute) and glycolysis rate (ECAR; milli-pH per minute) were measured using the Seahorse platform. (B) The impact of torin-1 on frequency and expression intensity of CD25 was measured on NK cells by FACS. (C) Expression levels of membrane-bound cytokines or IL-15Rα chain as determined by FACS. (D) Lysis of K562 cells mediated by IL-15–activated NK cells, in the presence of torin-1 (filled symbols), DMSO (open symbols) after direct activation or following cytokine withdrawal. Shaded symbols show lysis of K562 cells by IL-2–activated NK cells after cytokine withdrawal in the presence of DMSO. Results from multiple donors (n > 4) were summarized and presented as mean ± SD. Representative histograms were chosen based on proximity to average values. *P < .05; **P < .01; ***P < .001; Mann-Whitney nonparametric U test. FCCP, carbonyl cyanide-p-trifluoromethoxyphenylhydrazone; Gluc, glucose.
Figure 5
Figure 5
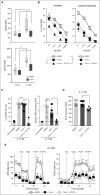
STAT-5 mediates mTOR-independent signaling upon IL-15 activation. (A) Phosphorylation of STAT-3 (n = 8) or STAT-5 (n = 7) were compared between NK cells activated with IL-2 or IL-15 in the presence or absence of torin-1. Alternatively, a selective STAT-5 inhibitor (400 μM) was added in combination with torin-1 during IL-15 activation of NK cells and (B) K562 lysis was assessed after 48 hours of activation or following an additional 24 hours of cytokine withdrawal. (C) Frequencies of CD25+ cells and expression intensities of CD25 on IL-15–activated NK cells. (D) Expression levels of intracellular Bcl-2 and (E) oxygen consumption and glycolytic potential were measured in NK cells cultured under described conditions. Results from multiple donors (n > 5) were summarized and presented as mean ± SD. Representative histograms were chosen based on proximity to average values. *P < .05; **P < .01; Mann-Whitney nonparametric U test. MFI, mean fluorescence intensity.
Figure 6
Figure 6
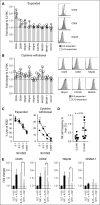
NK cells expanded with IL-15 are resistant to cytokine withdrawal. For expansion, 0.5 × 10⁶ to 2 × 10⁶ purified NK cells were cultured at a 1:10 ratio with irradiated EBV-transformed B cells in X-VIVO 20 medium supplemented with 10% heat-inactivated human AB serum, in the presence of recombinant human IL-2 (1000 IU/mL; Proleukin) or IL-15 (61 ng/mL). Fresh media supplemented with AB serum and cytokines (500 IU/mL for IL-2 or 30.5 ng/mL for IL-15) was added on day 5 and thereafter every 3 days and cells were harvested between 11 and 14 days. Expression levels of various activation markers on NK cells (A) freshly after expansion or (B) following 48 hours of cytokine withdrawal were measured by FACS. (C) Comparison of cytolytic capacity of IL2-NK (circles, dashed line) and IL15-NK (squares, solid line) cells against K562 target cells after expansion or cytokine withdrawal (48 hours). (D) NSG mice were injected (intraperitoneally) with 1 × 10⁶ to 5 × 10⁶ DiR-labeled IL-2– or IL-15–expanded NK cells. The liver was resected 4 to 5 days after injection of NK cells. Single-cell suspension of the liver was stained with a live-dead fixable aqua dead cell stain and anti-CD56 and thereafter acquired by flow cytometry. The frequency of NK cells calculated is based on viable CD56+/DiR+ cells. Each symbol represents 1 mouse injected with IL2-NK (n = 9) or IL15-NK (n = 8). Error bars show mean and SD and P value is calculated by a t test. (E) NK cells expanded with IL-2 or IL-15 were cultured in the same or alternative cytokines for 24 hours and expression intensities of various activating markers including CD25, CD69, NKp30, and DNAM-1 were measured by FACS. Results from 4 independent expansions were summarized and presented as mean ± SD. Representative histograms were chosen based on proximity to average values. *P < .05; **P < .01; ***P < .001; Mann-Whitney nonparametric U test.
Figure 7
Figure 7
IL-15 gene expression is associated with improved clinical outcome in patients with B-cell lymphomas. (A) Scatter plot of excess deaths (martingale residuals of the survival outcome in an empty Cox model) vs IL-15 gene expression (log2); tertile categories are separated by vertical dashed lines: low (<4.9), intermediate (4.9-5.9), high (>5.9). A loess curve with 95% confidence bands (gray) is indicated. (B) Kaplan-Meier plot for overall survival of patients categorized according to tertiles of IL-15 expression. (C) Correlation between IL-15 and Granzyme B (GZMB) or (D) Perforin 1 (PRF1) mRNA levels visualized using scatter plots and fitted linear model estimates with 95% confidence bands. Rs, Spearman rank correlation coefficient.

Similar articles

Cited by

References

    1. Miller JS, Soignier Y, Panoskaltsis-Mortari A, et al. Successful adoptive transfer and in vivo expansion of human haploidentical NK cells in patients with cancer. Blood. 2005;105(8):3051–3057. - PubMed
    1. Ruggeri L, Capanni M, Urbani E, et al. Effectiveness of donor natural killer cell alloreactivity in mismatched hematopoietic transplants. Science. 2002;295(5562):2097–2100. - PubMed
    1. Bachanova V, Burns LJ, McKenna DH, et al. Allogeneic natural killer cells for refractory lymphoma. Cancer Immunol Immunother. 2010;59(11):1739–1744. - PMC - PubMed
    1. Fehniger TA, Caligiuri MA. Interleukin 15: biology and relevance to human disease. Blood. 2001;97(1):14–32. - PubMed
    1. Waldmann TA. The biology of interleukin-2 and interleukin-15: implications for cancer therapy and vaccine design. Nat Rev Immunol. 2006;6(8):595–601. - PubMed

MeSH terms