. 2016 Sep 15;25(18):4052-4061.
doi: 10.1093/hmg/ddw244. Epub 2016 Jul 27.

Altered thalamocortical development in the SAP102 knockout model of intellectual disability

Affiliations

Altered thalamocortical development in the SAP102 knockout model of intellectual disability

Alex Crocker-Buque et al. Hum Mol Genet. .

Abstract

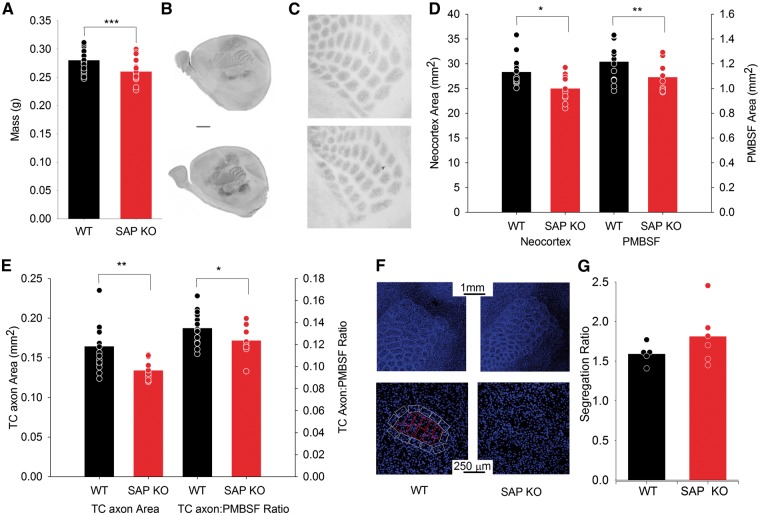
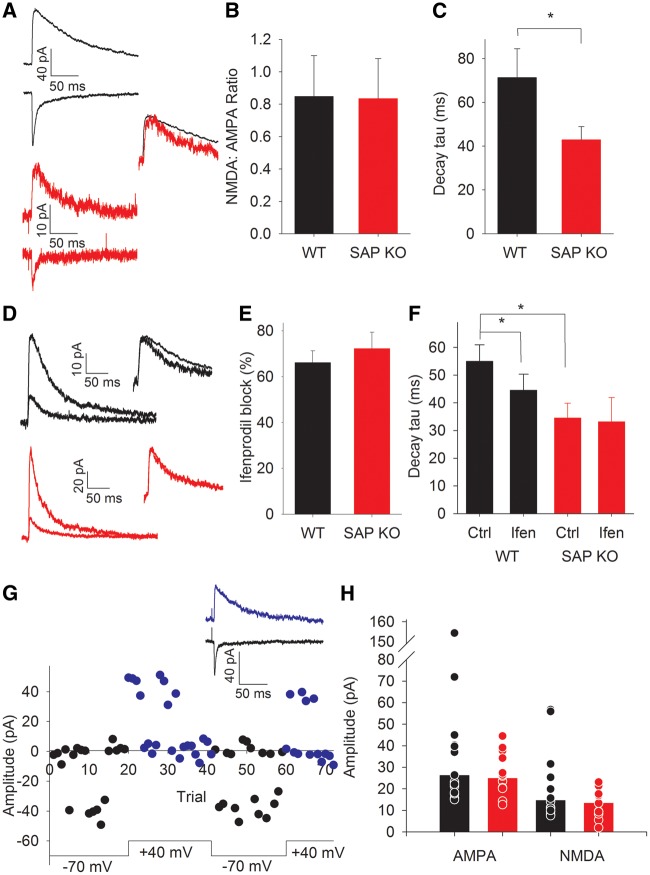
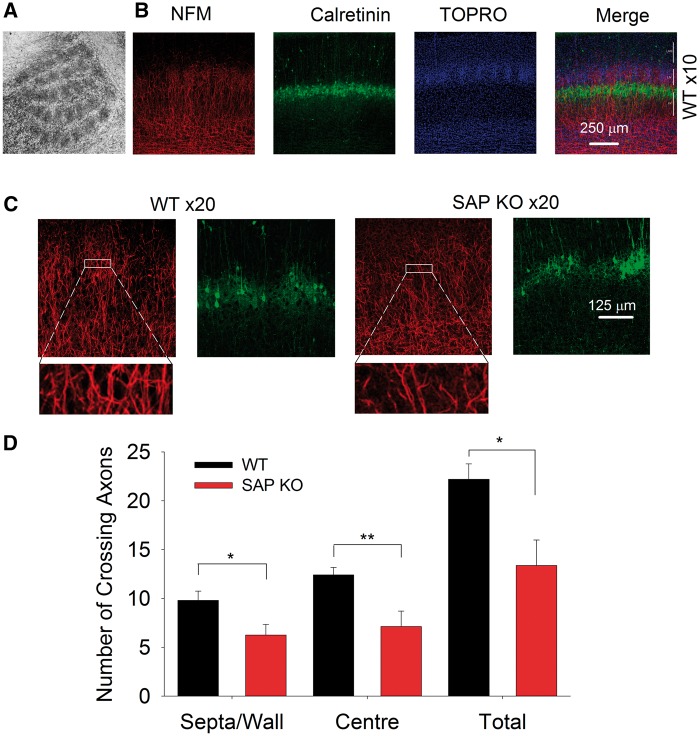
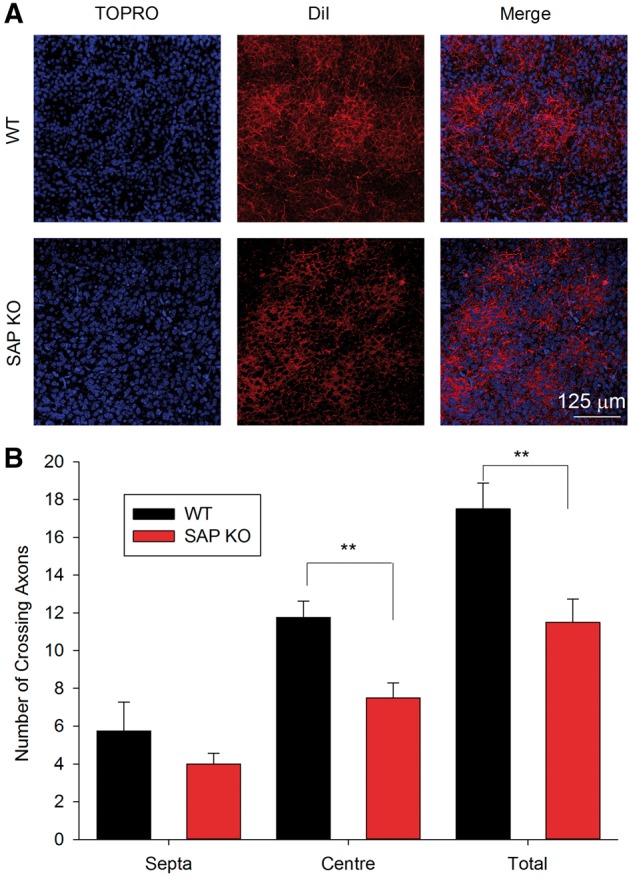
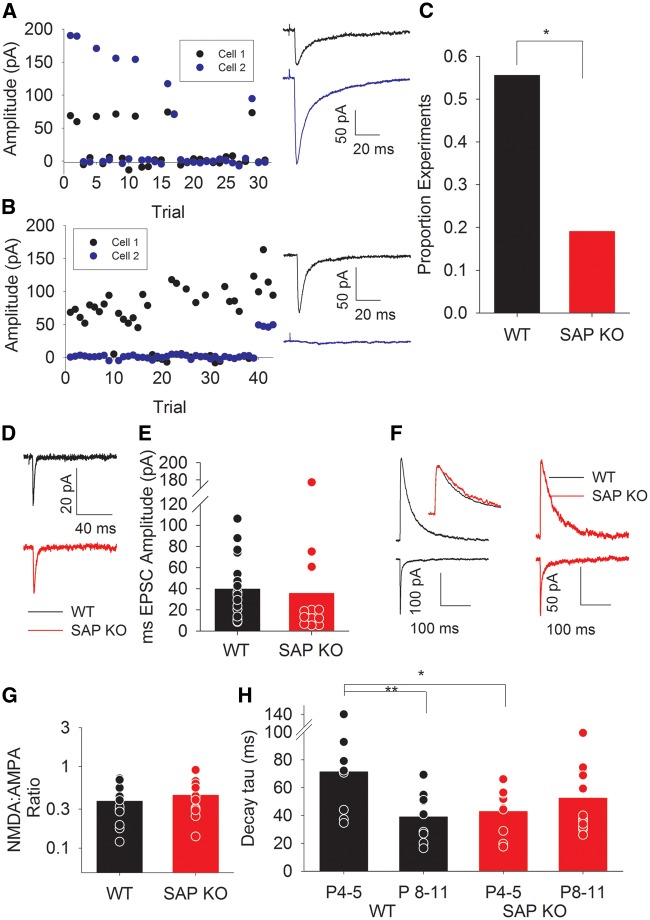
Genetic mutations known to cause intellectual disabilities (IDs) are concentrated in specific sets of genes including both those encoding synaptic proteins and those expressed during early development. We have characterized the effect of genetic deletion of Dlg3, an ID-related gene encoding the synaptic NMDA-receptor interacting protein synapse-associated protein 102 (SAP102), on development of the mouse somatosensory cortex. SAP102 is the main representative of the PSD-95 family of postsynaptic MAGUK proteins during early development and is proposed to play a role in stabilizing receptors at immature synapses. Genetic deletion of SAP102 caused a reduction in the total number of thalamocortical (TC) axons innervating the somatosensory cortex, but did not affect the segregation of barrels. On a synaptic level SAP102 knockout mice display a transient speeding of NMDA receptor kinetics during the critical period for TC plasticity, despite no reduction in GluN2B-mediated component of synaptic transmission. These data indicated an interesting dissociation between receptor kinetics and NMDA subunit expression. Following the critical period NMDA receptor function was unaffected by loss of SAP102 but there was a reduction in the divergence of TC connectivity. These data suggest that changes in synaptic function early in development caused by mutations in SAP102 result in changes in network connectivity later in life.


Figures

Figure 1.
Figure 1.
Reduced TC axon patch area in the barrel cortex. (A) Bar graph showing total brain mass of P7 WT (black) and SAP KO (red) mice. For this and subsequent graphs (unless otherwise stated) bars show mean value and points show values for individual animals. (B) Representative images form WT (top) and SAP KO (bottom) mice showing cortical arealization with SERT labelling. (C) Representative images showing TC axon patches with SERT labelling. (D) Bar graph of total neocortical area and area of PMBSF. (E)Bar graph of absolute area of TC axon patches (left) and as a proportion of PMBSF (right). (F) Representative images showing TO-PRO3 labelled cell bodies used to calculate barrel segregation at low (upper image) and high (lower image) magnification. (G). Bar graph showing barrel cellular segregation ratio. For this and subsequent figures * represents P < 0.05, ** represents P < 0.01 and *** represents P < 0.001.
Figure 2.
Figure 2.
Altered NMDA receptor kinetics in neonatal SAP KO mice. (A) Example traces showing TC AMPA- (upper trace recorded at − 70 mV) and NMDA-(lower, +40mV)-mediated EPSCs in WT (black) and SAP KO (red) mice. Inset shows NMDA EPSCs scaled to peak amplitude to show difference in kinetics. (B). Bar graph showing NMDA:AMPA ratio. (C) Bar graph showing NMDA EPSC decay tau. (D) Example traces showing pharmacologically isolated NMDA EPSCs in control (WT black, SAP KO red) and in the presence of ifenprodil (WT grey, SAP KO pink). (E) Bar graph showing inhibition by ifenprodil. (F) Bar graph showing NMDA decay kinetics in absence and presence of ifenprodil. (G) Amplitude versus time plot showing example minimal stimulation experiment. Black points show amplitude at a holding potential of − 70 mV blue at + 40 mV. Traces show averages at − 70 mV and +40 mV excluding failures for experiment in plot. H. Bar graph showing peak amplitude of minimal stimulation TC EPSCs recorded at − 70 mV (AMPA) and +40 mV (NMDA). Bars show median values.
Figure 3.
Figure 3.
Reduction in NFM-labelled axons in barrel cortex in P6-7 mice. (A). Flattened cortical section showing selective labelling of TC patches by NFM. (B) Representative images at low magnification showing NFM-labelled axons (red). Calretinin stain (green) was used to label L4/L5 boundary and barrel locations were identified by TO-PRO3 staining (blue). (C) Representative images at high magnification showing NFM and calretinin labelling in WT (left) and SAP KO (right) mice. Insets show expanded view of individual regions of interest used to calculate axon crossings. (D) Bar graph showing number of axons crossing a region of interest in barrel centres, septa/barrel wall and total (sum of centres and septa).
Figure 4.
Figure 4.
Reduction in DiI-labelled axons in barrel cortex. (A) Representative images showing DiI-labelled axons (red) in flattened cortical sections with barrel locations identified by TO-PRO3 staining (blue). (B) Graph showing number of axons crossing a region of interest in barrel centres, septa and total (sum of centres and septa) in P7 mice.
Figure 5.
Figure 5.
Reduced TC connectivity in P8-11 SAP KO mice. (A) Example 2-cell minimal stimulation experiment showing coincident EPSCs and failures in both cells. Traces show average of all trials excluding failures in cell 1 (black) and cell 2 (blue) (B) As for A except showing EPSCs in cell 1 coinciding with failures in cell 2. Traces for both cells show average of all trials in which an EPSC was seen in cell 1. (C) Bar graph showing proportion of experiments in which both cells showed coincident EPSCs and failures (as for experiment in A) in WT and SAP KO mice. (D) Representative traces showing minimal stimulation TC EPSCs (average of all sweeps excluding failures). (E) Bar graph showing minimal stimulation TC EPSC amplitude in P8-11 mice. (F) Example traces showing NMDA (upper traces) and AMPA (lower) EPSCs in WT (black) and SAP KO (red) mice. Inset shows NMDA EPSCs scaled to peak amplitude showing similar decay kinetics G. Bar graph showing TC NMDA:AMPA ratio. (H). Bar graph showing NMDA EPSC decay kinetics in P4–5 and P8–11 mice. P4–5 data are replotted from Figure 2 for comparison.

References

    1. Leonard H., Wen X. (2002) The epidemiology of mental retardation: challenges and opportunities in the new millennium. Ment. Retard. Dev. Disabil. Res. Rev., 8, 117–134. - PubMed
    1. Birnbaum R., Jaffe A.E., Hyde T.M., Kleinman J.E., Weinberger D.R. (2014) Prenatal expression patterns of genes associated with neuropsychiatric disorders. Am. J. Psychiatry, 171, 758–767. - PMC - PubMed
    1. Srivastava A.K., Schwartz C.E. (2014) Intellectual disability and autism spectrum disorders: Causal genes and molecular mechanisms. Neurosci. Biobehav. Rev., 46, 161–174. - PMC - PubMed
    1. Verpelli C., Montani C., Vicidomini C., Heise C., Sala C. (2013) Mutations of the synapse genes and intellectual disability syndromes. Eur. J. Pharmacol., 719, 112–116. - PubMed
    1. Muller B.M., Kistner U., Kindler S., Chung W.J., Kuhlendahl S., Fenster S.D., Lau L.F., Veh R.W., Huganir R.L., Gundelfinger E.D. et al. (1996) SAP102, a novel postsynaptic protein that interacts with NMDA receptor complexes in vivo. Neuron, 17, 255–265. - PubMed

Publication types

MeSH terms