. 2016 Oct 1;25(19):4143-4156.
doi: 10.1093/hmg/ddw248. Epub 2016 Jul 27.

Neurodevelopmental alterations and seizures developed by mouse model of infantile hypophosphatasia are associated with purinergic signalling deregulation

Affiliations

Neurodevelopmental alterations and seizures developed by mouse model of infantile hypophosphatasia are associated with purinergic signalling deregulation

Álvaro Sebastián-Serrano et al. Hum Mol Genet. .

Abstract

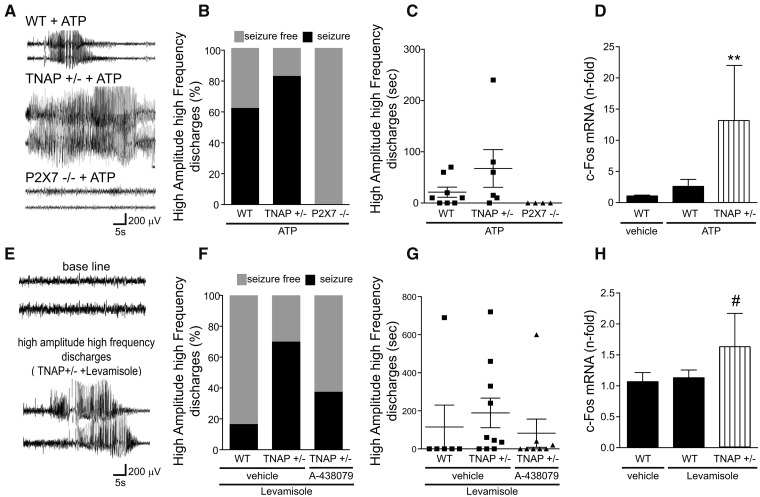
Hypomorphic mutations in the gene encoding the tissue-nonspecific alkaline phosphatase (TNAP) enzyme, ALPL in human or Akp2 in mice, cause hypophosphatasia (HPP), an inherited metabolic bone disease also characterized by spontaneous seizures. Initially, these seizures were attributed to the impairment of GABAergic neurotransmission caused by altered vitamin B6 (vit-B6) metabolism. However, clinical cases in human newborns and adults whose convulsions are refractory to pro-GABAergic drugs but controlled by the vit-B6 administration, suggest that other factors are involved. Here, to evaluate whether neurodevelopmental alterations are underlying the seizures associated to HPP, we performed morphological and functional characterization of postnatal homozygous TNAP null mice, a model of HPP. These analyses revealed that TNAP deficient mice present an increased proliferation of neural precursors, an altered neuronal morphology, and an augmented neuronal activity. We found that these alterations were associated with a partial downregulation of the purinergic P2X7 receptor (P2X7R). Even though deficient P2X7R mice present similar neurodevelopmental alterations, they do not develop neonatal seizures. Accordingly, we found that the additional blockage of P2X7R prevent convulsions and extend the lifespan of mice lacking TNAP. In agreement with these findings, we also found that exogenous administration of ATP or TNAP antagonists induced seizures in adult wild-type mice by activating P2X7R. Finally, our results also indicate that the anticonvulsive effects attributed to vit-B6 may be due to its capacity to block P2X7R. Altogether, these findings suggest that the purinergic signalling regulates the neurodevelopmental alteration and the neonatal seizures associated to HPP.


Figures

Figure 1.
Figure 1.
TNAP regulates different events of neocortical and hippocampal neuronal differentiation and proliferation. (A) TNAP enzymatic assays on brain slices shows the absence of alkaline phosphatase activity in TNAP-/- mice. cc, corpus callosum. Scale bar: 500 µm. (B) Axonal processes from WT or TNAP-/- neocortical neurons electroporated with EGFP can be seen extending medially toward the midline. Arrows indicate the end of the axonal tract and arrowheads point to longer single axons. Scale bar: 500 µm. (C) Quantification of axonal length in vivo (n ≥ 4 mice at P1 per genotype; axons ≥200 per mouse). (D-I) Representative pictures showing neurons from P9 mice (D) from upper cortical layers or granule cells (G) from dentate gyrus infected by EGFP-expressing retroviruses. Scale bar: 25 µm (upper panels) and 1 µm (lower panels). Total number of primary, secondary, and tertiary branches per neuron in layers II-III (E) or granule cell layer (H). Dendritic spine density in pyramidal neurons (F) or granule cells (I) (n ≥ 3 mice at P9 per genotype; neurons ≥30 per mouse). (J) Representative western blot using samples from hippocampus of P9 WT and TNAP-/- mice. Quantification of the protein expression of PSD-95, VGLUT1, VGAT and SYP (n ≥ 4 mice at P9 per genotype). (K) Micrographs showing increased c-Fos immunoreactivity in the dentate gyrus of TNAP-/- mice compared with WT (left panels). Cells expressing c-Fos in TNAP -/- mice are mainly NeuN positive mature neurons (right panels) Scale bar: 250 µm left panels and 20 µm right panels. (L) Total number of c-Fos positive cells in granule cell layer (n ≥ 3 mice at P9 per genotype; sections ≥10 per mouse). (M) Sagittal sections of hippocampus from WT and TNAP-/- mice stained with antibodies against calbindin and DAPI dye to delimit the main layers of the dentate gyrus. Molecular Layer, Granule Cell Layer and Hilus. Scale bar: 200 µm. (N) Quantification of the size of different dentate gyrus layers (n ≥ 6 mice at P9 per genotype; sections ≥10 per mouse) (O) Representative micrographs of hippocampal sections of P9 WT and TNAP-/- mice immunostained with anti-CldU antibody after injection with CldU at P6. Scale bar: 100 µm. (P) Total number of cells labelled by CldU or Caspase-3 in GCL (n ≥ 3 mice at P9 per genotype; sections ≥8 per mouse). *P < 0.05 between WT and TNAP-/- using unpaired t test. Data in bar graphs depict mean ± s.e.m. ML, Molecular Layer. GCL, Granule Cell Layer. DG, Dentate Gyrus. Ctx, cerebral cortex.
Figure 2.
Figure 2.
TNAP-/- mice present reduced expression and functionality of hippocampal P2X7R. (A) Representative images of western blot using hippocampal samples from P3 and P9 WT and TNAP-/- mice. Graphs show quantification of the protein expression of P2X7R and syntaxin (n ≥ 4 mice per genotype at each age indicated). (B) Quantification of relative abundance of P2X7R mRNA from P9 hippocampus of WT and TNAP-/- mice (n ≥ 4 mice per genotype). (C) Representative micrographs of P9 hippocampal sections from mice expressing EGFP under the P2X7R promoter in the presence (P2X7EGFP) or absence of TNAP-/- (P2X7EGFP; TNAP-/-). Scale bar: 300 µm. (D) Quantification of EGFP positive cells from granule cell layer in P2X7EGFP and P2X7EGFP; TNAP-/- mice (n ≥ 6 mice at P9 per genotype; sections ≥10 per mouse). (E) Double immunostaining against EGFP (under P2X7 promoter) in green and mature (Calbindin) or immature (Doublecortin, Dcx) neurons in red. Scale bar: 25 µm. (F) Graph showing similar reduction of reporter EGFP expression in mature and immature neurons in the absence of TNAP (n ≥ 3 mice at P9 per genotype, sections ≥4 per mouse). (G) Effect of the selective P2X7R antagonist A-438079 (10 μM) on Bz-ATP-induced currents in EGFP-positive neurons situated in the dentate gyrus of WT (n ≥ 12 cells) and TNAP-/- mice (n ≥ 5 cells). (H) Representative patch-clamp recordings of currents elicited by Bz-ATP (100 μM) in EGFP-positive neurons situated in the dentate gyrus of P2X7EGFP or P2X7EGFP; TNAP-/- mice. (I) Graph indicates the quantification of patch-clamp recordings showing a significant decrease in the response to Bz-ATP in TNAP-/-mice (n ≥ 7 cells) compared with WT (n ≥ 12 cells). (J) Representative pictures showing hippocampal mossy fibers from WT and TNAP-/- mice stained with antibodies against P2X7R (red) and syntaxin (green). Scale bar: 25 µm. (K) Responses to 600 µM ATP in isolated hippocampal synaptic terminal from P9 WT and TNAP-/- mice. Synaptosomes were stimulated with a pulse of 30 mM KCl at the end of the experiment to assess the functionality of the synaptosomes (n ≥ 3 mice at P9 per genotype, synaptosomes ≥100 per mouse). (L) TNAP-/- mice present a significant decrease in the percentage of hippocampal synaptic terminal expressing P2X7R that correlates with (M) a significant decrease in the percentage of synaptic terminals responding to ATP (n ≥ 3 mice at P9 per genotype, synaptosomes ≥100 per mouse). ns, non-significant, *P < 0.05 and **P < 0.01 between WT and TNAP-/- using unpaired t test. Data in bar graphs depict mean ± s.e.m. ML, Molecular layer. GCL, Granule Cell Layer. MF, Mossy Fibers. DG, Dentate Gyrus.
Figure 3.
Figure 3.
P2X7R is involved in the altered neurodevelopment detected in neonatal TNAP-/- mice. (A) Axonal processes from WT or TNAP-/- cortical neurons were co-electroporated with EGFP and shRNA P2X7. Arrows indicate the end of the main axonal tract and arrowheads point to longer single axons. Scale bar: 500 µm. (B) Quantification of axonal length in vivo (n ≥ 3 mice at P1 per genotype and axons ≥200 per mouse). (C) Representative micrographs of granule cell layer from P9 hippocampal sections showing cells labelled by CldU injections at P6 in WT and TNAP-/- mice treated with the P2X7R antagonist BBG or vehicle. Scale bar: 25 µm. (D) Total number of cells labelled by CldU in granule cell layer (n ≥ 3 mice at P9 per genotype and treatment; sections ≥8 per mouse). (E) The granule cell layer was divided in 3 equal-sized regions or bins to make quantitative analysis of the distribution of CldU populations (n ≥ 3 mice at P9 per genotype and treatment and sections ≥18 per mouse). (F) Representative immunofluorescence images of nuclei of CA3 pyramidal layer proximal to the dentate gyrus (CA3pDG, dotted line) stained with antibodies against Calbindin and DAPI dye showing axonal sprouting. Scale bar: 50 µm. (G) Quantification of the size of different dentate gyrus layers (n ≥ 4 mice at P9 per genotype and treatment and sections ≥10 per mouse). (H) Quantification of the size of CA3pDG area (n ≥ 4 mice at P9 per genotype and treatment; sections ≥10 per mouse). (I) Representative western blot images from the lysate of hippocampus from P9 WT and TNAP-/- mice treated with BBG. Graphs show quantification of the protein expression of VGLUT1, VGAT and PSD-95 (n ≥ 4 mice at P9 per genotype and treatment). (J) Micrograph showing c-Fos immunoreactivity in the dentate gyrus of P9 WT and TNAP-/- mice treated with BBG, the specific antagonist of P2X7R. Black arrowheads indicate c-Fos positive cells. Scale bar: 200 µm. (K) Total number of c-Fos positive cells in granule cell layer (n ≥ 3 mice at P9 per genotype and treatment; sections ≥10 per mouse). #P < 0.06, *P < 0.05, **P < 0.01 and ***P < 0.001 using one-way ANOVA followed by Tukeýs multiple comparison test. Data in bar graphs depict mean ± s.e.m. ML, Molecular layer. GCL, Granule Cell Layer. SGZ, Subgranular Zone. DG, Dentate Gyrus.
Figure 4.
Figure 4.
P2X7R-/- mice mimics the neuronal differentiation alterations developed by TNAP-/- mice. (A) Representative images of hippocampal sagittal sections from P9 WT and P2X7R-/- mice stained with antibody against Calbindin (red) and DAPI dye (blue) showing dentate gyrus (left panels) and CA3 pyramidal layer proximal to the dentate gyrus (CA3pDG) area (right panels). Scale bar: 200 µm (left panels) and 50 µm (right panels). (B) Quantification of the size of different dentate gyrus layers (n ≥ 4 mice at P9 per genotype; sections ≥10 per mouse). (C) Quantification of the size of CA3pDG area (n ≥ 4 mice at P9 per genotype; sections ≥10 per mouse). (D) Representative micrographs of granule cell layer from P9 hippocampal sections showing cells labelled by CldU injections at P6 in WT and P2X7R-/- mice. Scale bar: 20 µm. (E) Total number of cells labelled by CldU (n ≥ 3 mice at P9 per genotype; sections ≥18 per mouse). (F) The granule cell layer was divided in 3 equal-sized regions or bins to make quantitative analysis of the distribution of CldU populations (n ≥ 3 mice at P9 per genotype; sections ≥8 per mouse). (G) Representative pictures showing retrovirus labelled granule cells from P9 mice. Scale bar: 25 µm (left panels) and 1 µm (right panels). (H) Total number of primary, secondary, and tertiary branches per granule cell (n ≥ 3 mice at P9 per genotype) (I) Dendritic spine density (n ≥ 3 mice at P9 per genotype; neurons ≥30 per mouse). (J) Representative images of western blot using hippocampal samples from P9 WT and P2X7R-/- mice. Quantification of the protein expression of PSD-95, VGLUT1 and VGAT (n ≥ 4 mice at P9 per genotype). #P < 0.06, *P < 0.05, **P < 0.01 and ***P < 0.001 between WT and P2X7R using unpaired t test. Data in bar graphs depict mean ± s.e.m. ML, Molecular layer. GCL, Granule Cell Layer. SGZ, Subgranular Zone. DG, Dentate Gyrus.
Figure 5.
Figure 5.
Selective knockdown and pharmacological inhibition of P2X7R increases the longevity of TNAP-/- mice. PLP but not PL decreases the response to Bz-ATP of P2X7EGFP cells from dentate gyrus. (A) Survival of TNAP-/- mice (black; n = 5) and TNAP-/-; P2X7R-/- mice (grey; n = 10). The log-rank test was used to compare survival between groups. (B) Representative patch-clamp recordings illustrating current responses to 100 μM Bz-ATP in EGFP-positive neurons placed in dentate gyrus from P2X7EGFP mice in the absence (vehicle) or the presence of 300 μM PLP or PL. (C) Graph indicates the quantification of patch-clamp recordings showing a significant decrease in the response to Bz-ATP when the slices are pre-treated with PLP (n ≥ 3 mice at P9; cells ≥ 6 per mouse), but not with PL (n ≥ 3 mice at P9; cells ≥ 5 per mouse). **P < 0.01 between pharmacological pre-treatment and the corresponding vehicle using one-way ANOVA followed by Tukeýs multiple comparison test. Data in bar graphs depict mean ± s.e.m.
Figure 6.
Figure 6.
TNAP antagonists and ATP induce seizures by P2X7R activation. (A) Representative EEG spectrograms showing frequency and amplitude data during ATP-induce seizure in WT, TNAP+/- or P2X7R-/- mice. (B) Percentage of animals that suffer seizures after i.c.v. ATP administration (n = 8 WT mice at 2-3M months-old; n = 6 TNAP+/- mice at 2-3M months-old; n = 4 P2X7R-/- mice at 2-3M months-old). (C) Average duration of HAHFDs during seizure (n = 8 WT mice at 2-3M months-old; n = 6 TNAP+/- mice at 2-3M months-old; n = 4 P2X7R-/- mice at 2-3M months-old). (D) Levels of the activity-regulated gene c-Fos from ipsilateral hippocampus lysates 2 h after i.c.v. administration of ATP or the corresponding vehicle in WT or TNAP+/- animals (n ≥ 4 mice at 2-3M months-old per genotype and treatment). (E) Representative EEG spectrograms showing frequency and amplitude data during Levamisole-induced seizure in TNAP+/- mice. (F) Percentage of animals that suffer seizures after i.c.v. Levamisole administration showing a protective effect of P2X7R antagonist A-438079 (n = 6 WT mice at 2-3M months-old treated with vehicle; n = 10 TNAP+/- mice at 2-3M months-old treated with vehicle; n = 8 TNAP+/- mice at 2-3M months-old treatment with A-438079) (G) Average duration of HAHFDs during seizure (n = 6 WT mice at 2-3M months-old treated with vehicle; n = 10 TNAP+/- mice at 2-3M months-old treated with vehicle; n = 8 TNAP+/- mice at 2-3M months-old treatment with A-438079). (H) Levels of the activity-regulated gene c-Fos from ipsilateral hippocampus lysates 2 h after i.c.v. administration of Levamisole or the corresponding vehicle (n ≥ 6 mice per genotype and treatment). #P < 0.06 or **P < 0.01 between WT and TNAP+/- mice using one-way ANOVA followed by Tukeýs multiple comparison test. Data in bar graphs depict mean ± s.e.m.

Similar articles

Cited by

References

    1. Millan J.L. (2006) Alkaline Phosphatases: Structure, substrate specificity and functional relatedness to other members of a large superfamily of enzymes. Purinergic. Signal, 2, 335–341. - PMC - PubMed
    1. Narisawa S., Hasegawa H., Watanabe K., Millan J.L. (1994) Stage-specific expression of alkaline phosphatase during neural development in the mouse. Dev. Dyn., 201, 227–235. - PubMed
    1. Whyte M.P., Zhang F., Wenkert D., McAlister W.H., Mack K.E., Benigno M.C., Coburn S.P., Wagy S., Griffin D.M., Ericson K.L., et al. (2015) Hypophosphatasia: validation and expansion of the clinical nosology for children from 25 years experience with 173 pediatric patients. Bone, 75, 229–239. - PubMed
    1. Narisawa S., Frohlander N., Millan J.L. (1997) Inactivation of two mouse alkaline phosphatase genes and establishment of a model of infantile hypophosphatasia. Dev. Dyn., 208, 432–446. - PubMed
    1. Narisawa S., Wennberg C., Millan J.L. (2001) Abnormal vitamin B6 metabolism in alkaline phosphatase knock-out mice causes multiple abnormalities, but not the impaired bone mineralization. J. Pathol., 193, 125–133. - PubMed

MeSH terms

Supplementary concepts