. 2016 Sep 8;6(9):2867-79.
doi: 10.1534/g3.116.031906.

Genome-Wide Divergence in the West-African Malaria Vector Anopheles melas

Affiliations

Genome-Wide Divergence in the West-African Malaria Vector Anopheles melas

Kevin C Deitz et al. G3 (Bethesda). .

Abstract

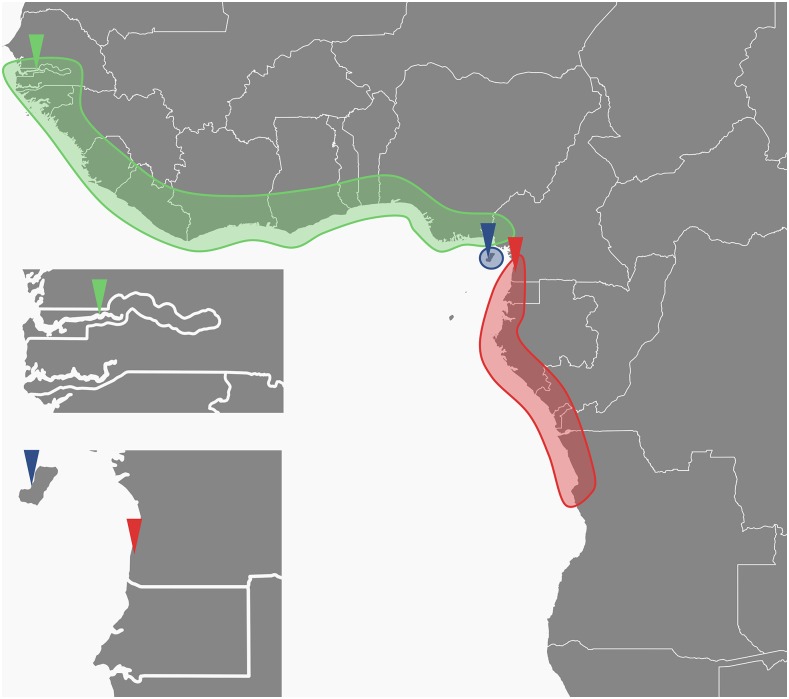
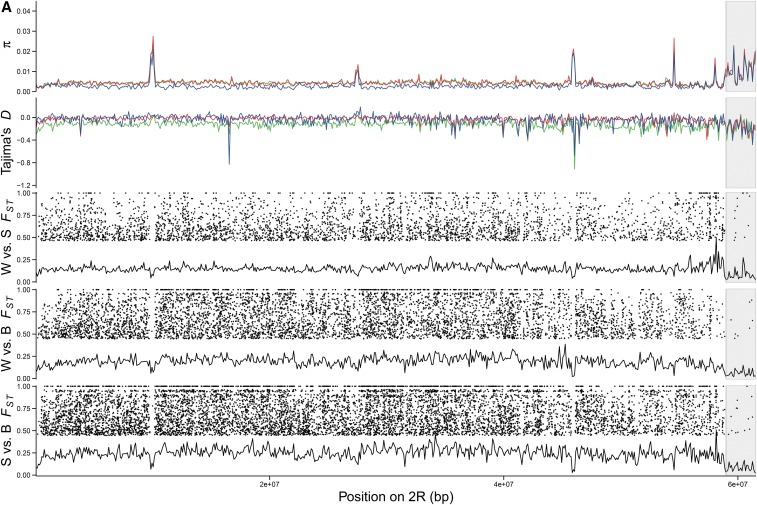
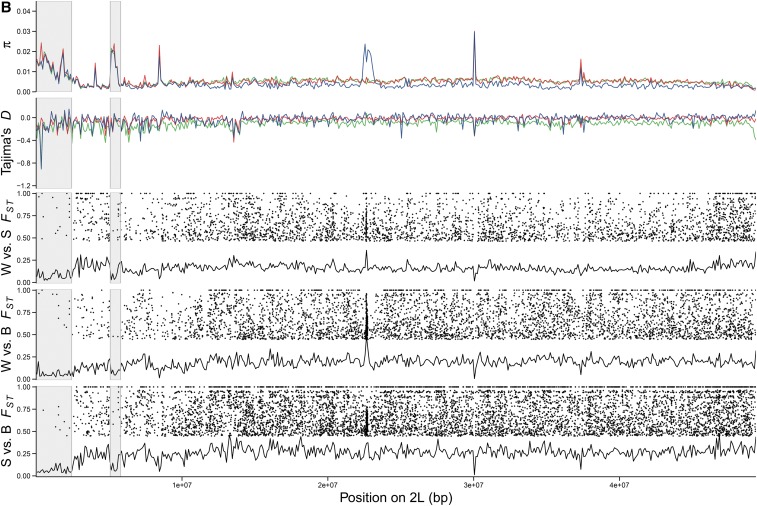
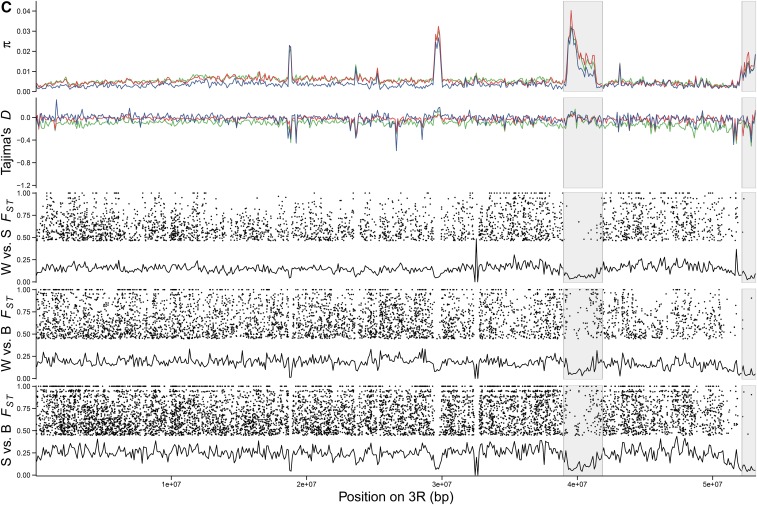
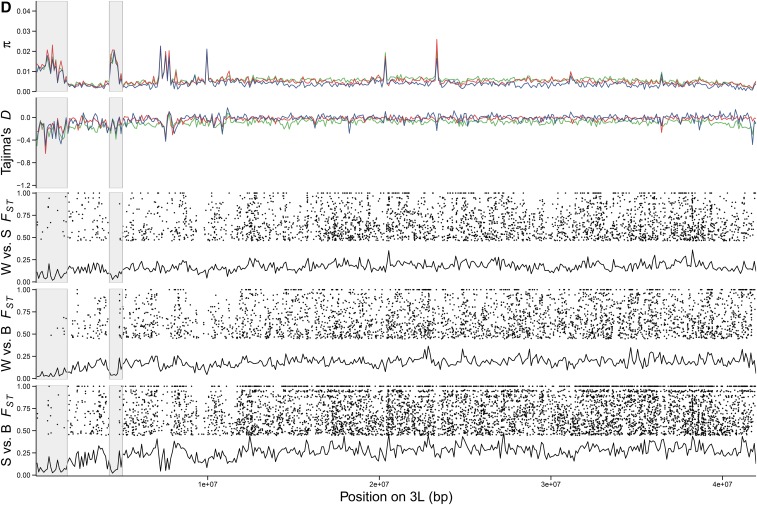
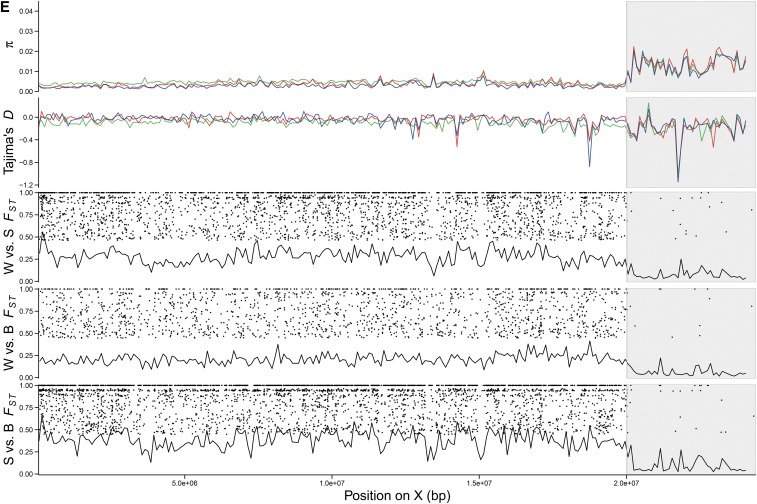
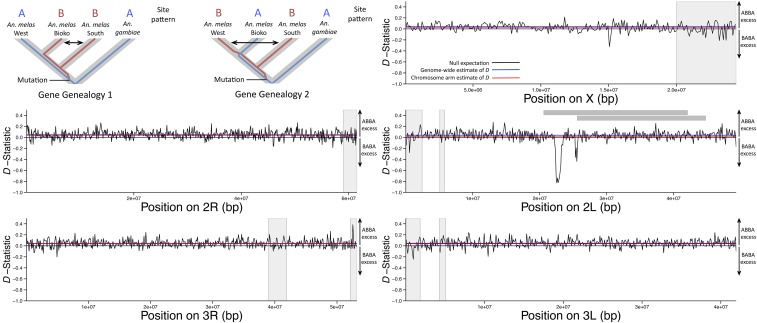
Anopheles melas is a member of the recently diverged An. gambiae species complex, a model for speciation studies, and is a locally important malaria vector along the West-African coast where it breeds in brackish water. A recent population genetic study of An. melas revealed species-level genetic differentiation between three population clusters. An. melas West extends from The Gambia to the village of Tiko, Cameroon. The other mainland cluster, An. melas South, extends from the southern Cameroonian village of Ipono to Angola. Bioko Island, Equatorial Guinea An. melas populations are genetically isolated from mainland populations. To examine how genetic differentiation between these An. melas forms is distributed across their genomes, we conducted a genome-wide analysis of genetic differentiation and selection using whole genome sequencing data of pooled individuals (Pool-seq) from a representative population of each cluster. The An. melas forms exhibit high levels of genetic differentiation throughout their genomes, including the presence of numerous fixed differences between clusters. Although the level of divergence between the clusters is on a par with that of other species within the An. gambiae complex, patterns of genome-wide divergence and diversity do not provide evidence for the presence of pre- and/or postmating isolating mechanisms in the form of speciation islands. These results are consistent with an allopatric divergence process with little or no introgression.

Keywords: Anopheles gambiae; Anopheles melas; Pool-seq; malaria; population genomics.


Figures

Figure 1
Figure 1
This map of West Africa illustrates the distributions of An. melas genetic clusters. Ranges of An. melas West (green), South (red), and Bioko (blue) are shown as shaded regions. Triangles show the sample locations of An. melas populations used to represent each An. melas genetic cluster. The top inset shows the collection location of Ballingho, The Gambia (green triangle, An. melas West), and the bottom inset shows the collection locations of Arena Blanca, Bioko Island, Equatorial Guinea (blue triangle, An. melas Bioko) and Ipono, Cameroon (red triangle, An. melas South).
Figure 2
Figure 2
Summary violin plots of the FST null distribution and false discovery rate simulation. The left plots show the allele frequency distribution of population and sequencing pools. The middle plot represents the difference between two randomly sampled allele frequencies drawn from the sequencing pool. The right plot shows the distribution of FST values calculated from the distribution of allele frequency differences.
Figure 3
Figure 3
Line plots illustrate genome-wide nucleotide diversity (π) and Tajima’s D estimates for each chromosome arm and population based upon nonoverlapping, 100 kb sliding windows. (A–E) Green lines represent An. melas West, red lines represent An. melas South, and blue lines represent An. melas Bioko. FST plots are presented for each pairwise population comparison: An. melas West vs. South (W vs. S), West vs. Bioko (W vs. B), and South vs. Bioko (S vs. B). The solid line indicates FST calculated for nonoverlapping, 100 kb sliding windows, and dots indicate significant FST SNPs. Vertical gray bars indicate regions of heterochromatin in the An. gambiae genome that were not included in the calculation of summary statistics.
Figure 3
Figure 3
Line plots illustrate genome-wide nucleotide diversity (π) and Tajima’s D estimates for each chromosome arm and population based upon nonoverlapping, 100 kb sliding windows. (A–E) Green lines represent An. melas West, red lines represent An. melas South, and blue lines represent An. melas Bioko. FST plots are presented for each pairwise population comparison: An. melas West vs. South (W vs. S), West vs. Bioko (W vs. B), and South vs. Bioko (S vs. B). The solid line indicates FST calculated for nonoverlapping, 100 kb sliding windows, and dots indicate significant FST SNPs. Vertical gray bars indicate regions of heterochromatin in the An. gambiae genome that were not included in the calculation of summary statistics.
Figure 4
Figure 4
Line plots illustrate genome-wide values of Patterson’s D-statistic for each chromosome arm for the An. melas population tree {[(West,Bioko)South]An. gambiae}. Positive values indicate an excess of ABBA patterns and negative values indicate a biased proportion of BABA patterns. Horizontal black lines indicate the null expectation, no ABBA or BABA excess (D = 0). Horizontal blue lines indicate the genome-wide estimate of Patterson’s D, and horizontal red lines indicate the average Patterson’s D for each chromosome arm. Vertical gray bars indicate regions of heterochromatin in the An. gambiae genome that were not included in the calculation of summary statistics. Horizontal gray bars in the chromosome arm 2L panel indicate the locations of the 2La/+ (top) and 2La2/+ (bottom) inversions. The top left panel demonstrates the ABBA vs. BABA patterns in the context of the An. melas tree, where an ABBA pattern indicates introgression between An. melas Bioko and South, and a BABA pattern indicates introgression between An. melas West and South (arrows).

References

    1. Aboagye-Antwi F., Alhafez N., Weedall G. D., Brothwood J., Kandola S., et al. , 2015. Experimental swap of Anopheles gambiae’s assortative mating preferences demonstrates key role of X–chromosome divergence island in incipient sympatric speciation. PLoS Genet. 11: e1005141. - PMC - PubMed
    1. Athrey G., Hodges T. K., Reddy M. R., Overgaard H. J., Matias A., et al. , 2012. The effective population size of malaria mosquitoes: large impact of vector control. PLoS Genet. 8: e1003097. - PMC - PubMed
    1. Besansky N. J., Powell J. R., Caccone A., Hamm D. M., Scott J. A., et al. , 1994. Molecular phylogeny of the Anopheles gambiae complex suggests genetic introgression between principal malaria vectors. Proc. Natl. Acad. Sci. USA 91: 6885–6888. - PMC - PubMed
    1. Bogh C., Lindsay S. W., Clarke S. E., Dean A., Jawara M., et al. , 2007. High spatial resolution mapping of malaria transmission risk in The Gambia, West Africa using TM satellite imagery. Am. J. Trop. Med. Hyg. 76: 875–881. - PubMed
    1. Bolger A. M., Lohse M., Usadel B., 2014. Trimmomatic: a flexible trimmer for Illumina sequence data. Bioinformatics 30: 2114–2120. - PMC - PubMed

Publication types

LinkOut - more resources