. 2016 Sep 15;76(18):5229-5240.
doi: 10.1158/0008-5472.CAN-15-1798. Epub 2016 Jul 27.

Lack of p53 Augments Antitumor Functions in Cytolytic T Cells

Affiliations

Lack of p53 Augments Antitumor Functions in Cytolytic T Cells

Anirban Banerjee et al. Cancer Res. .

Abstract

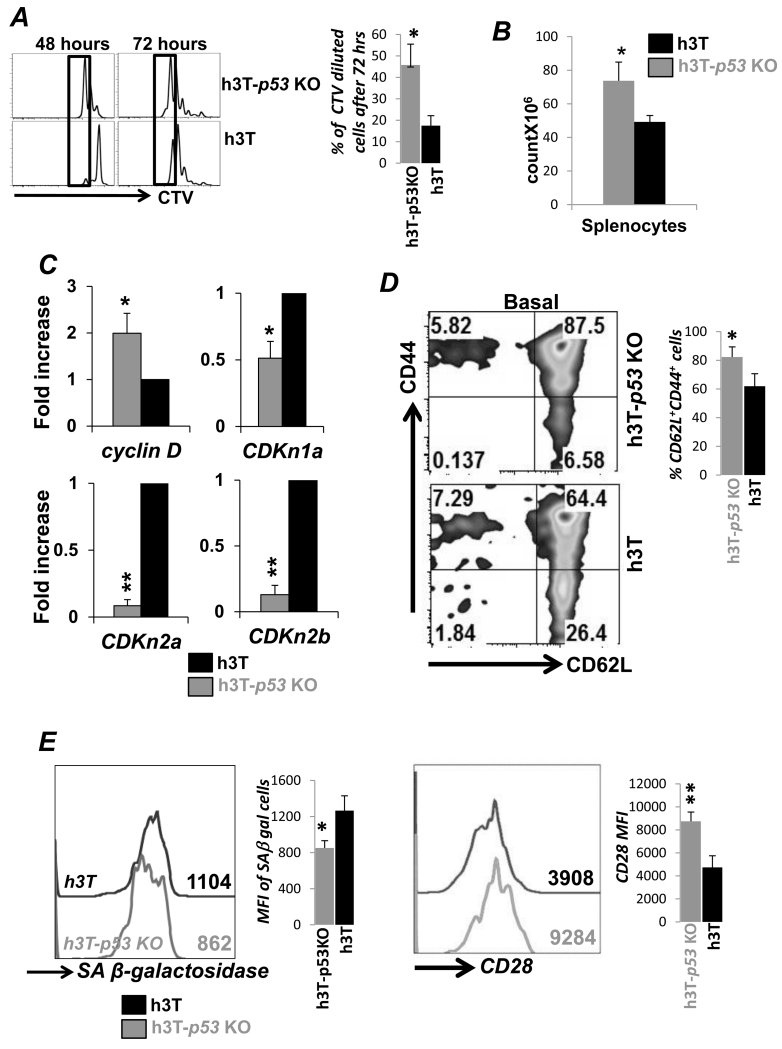
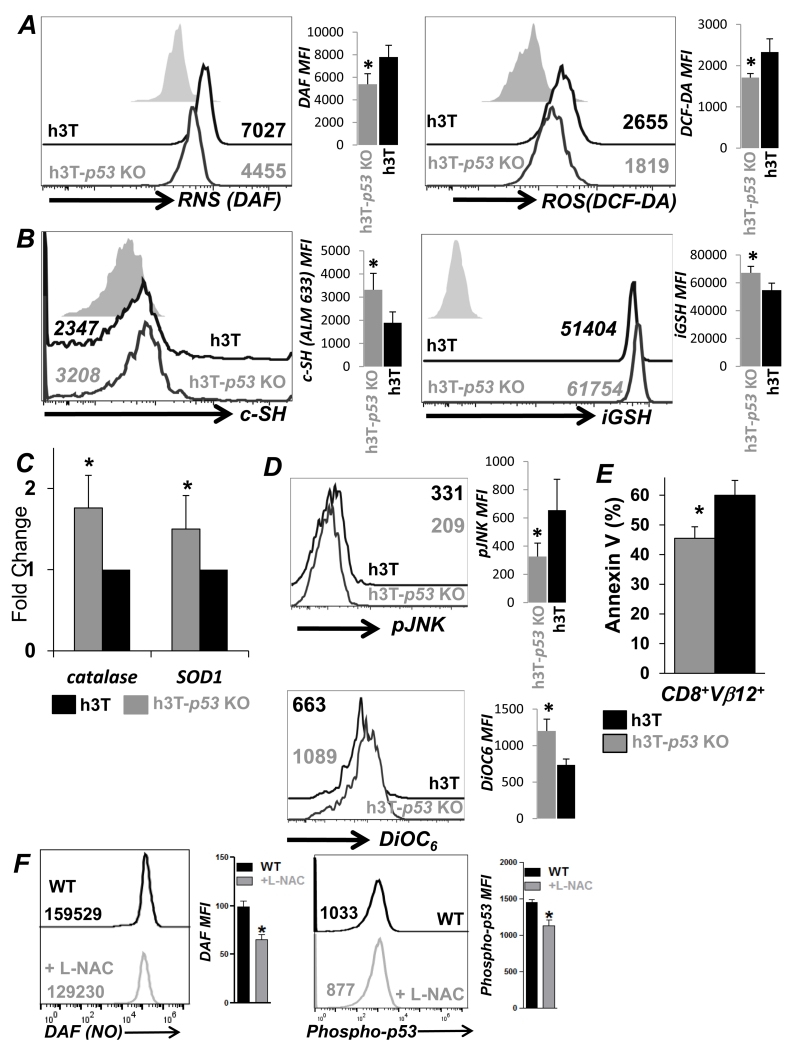
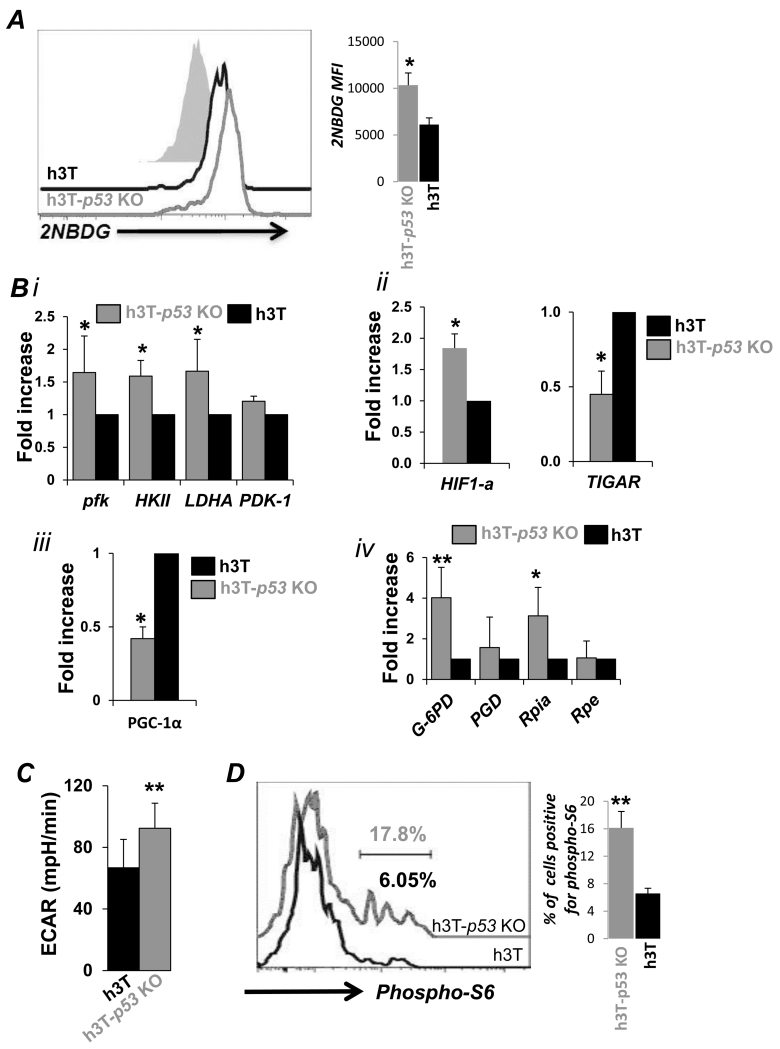
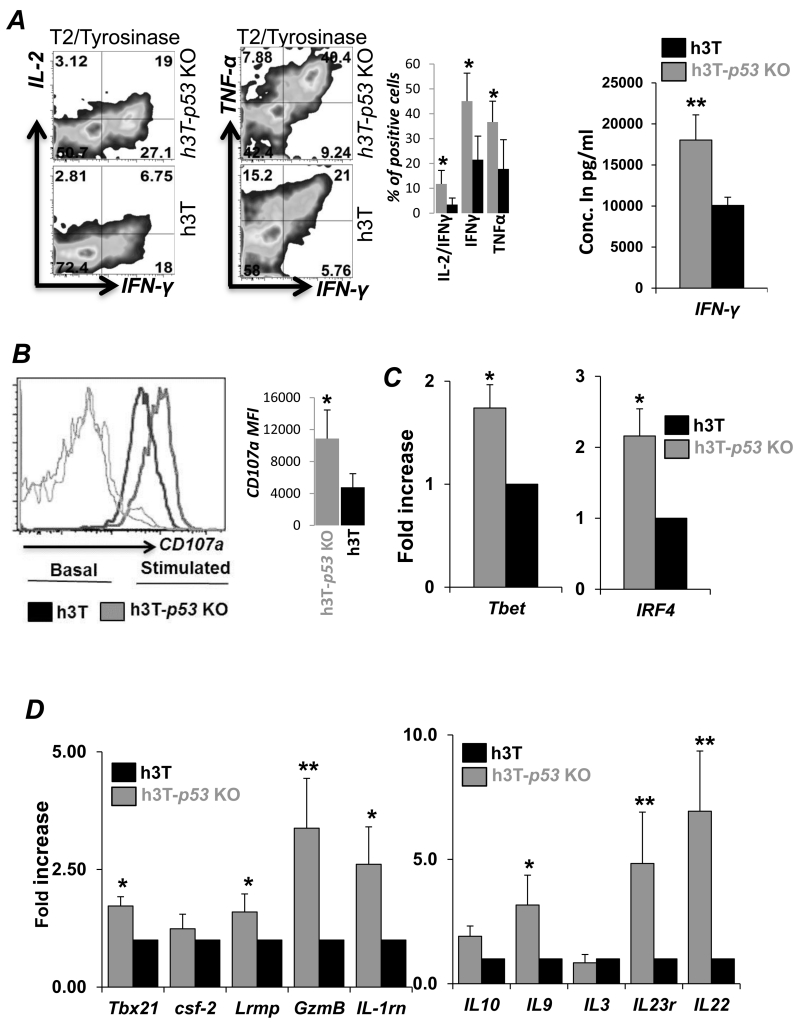
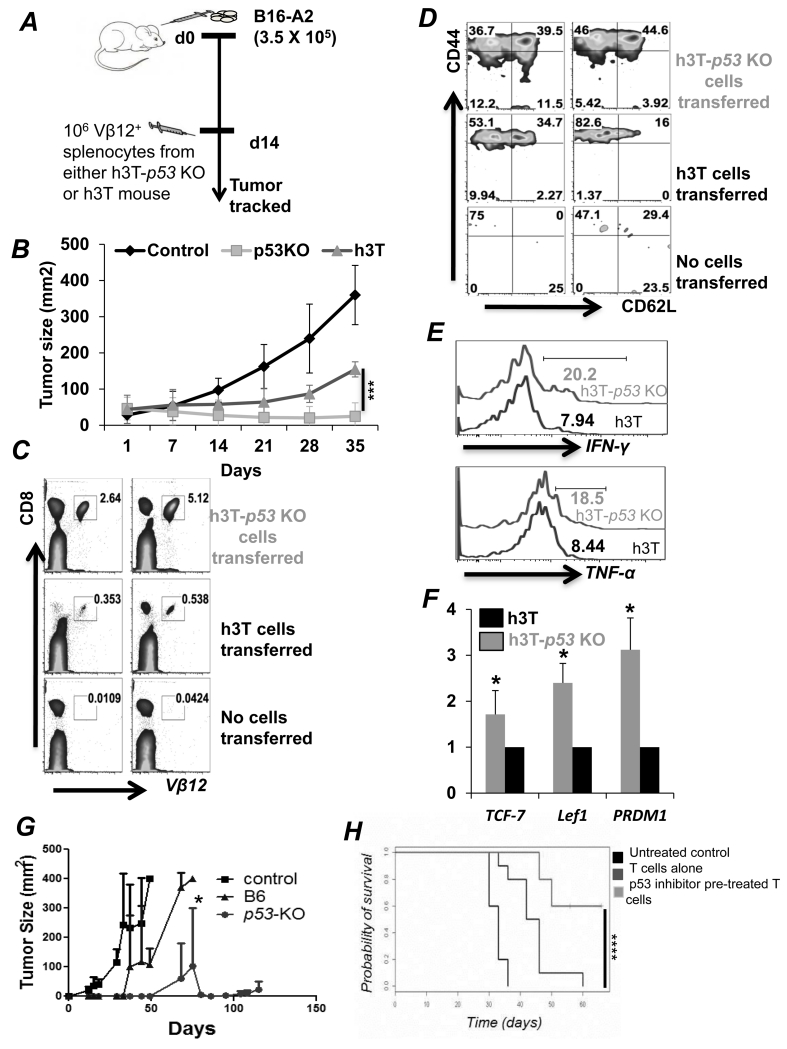
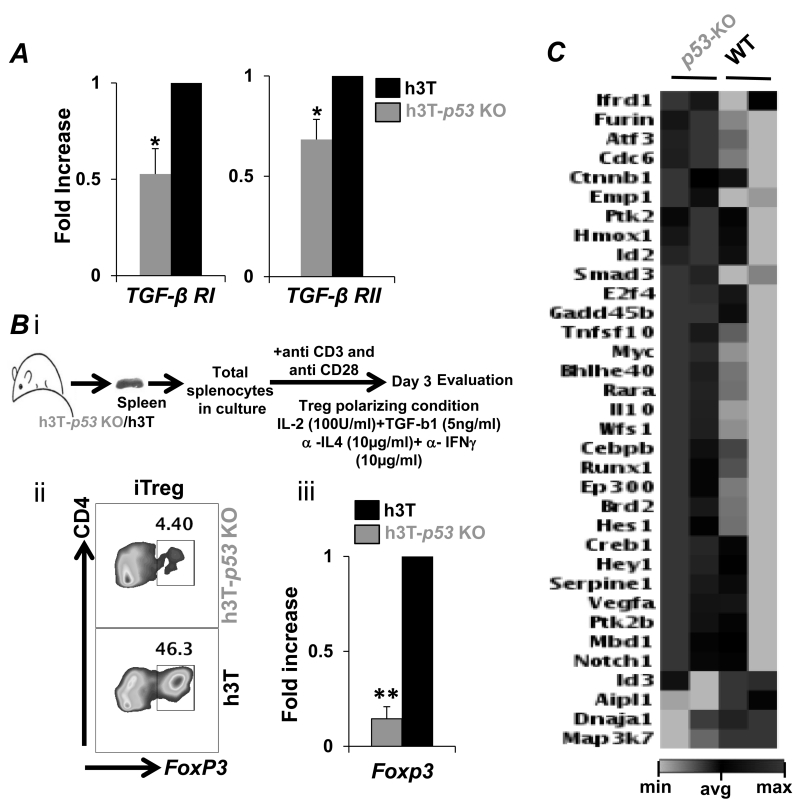
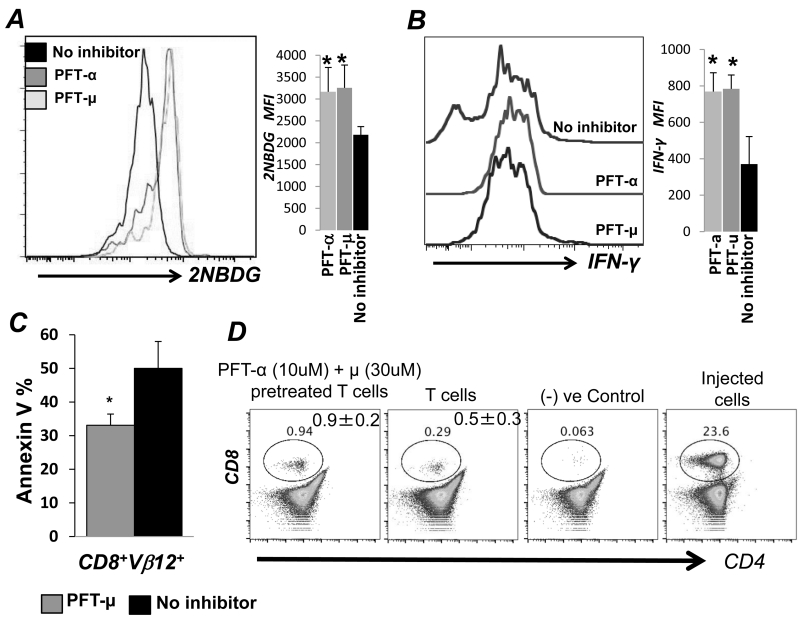
Repetitive stimulation of T-cell receptor (TCR) with cognate antigen results in robust proliferation and expansion of the T cells, and also imprints them with replicative senescence signatures. Our previous studies have shown that life-span and antitumor function of T cells can be enhanced by inhibiting reactive oxygen species (ROS) or intervening with ROS-dependent JNK activation that leads to its activation-induced cell death. Because tumor suppressor protein p53 is also a redox active transcription factor that regulates cellular ROS generation that triggers downstream factor-mediating apoptosis, we determined if p53 levels could influence persistence and function of tumor-reactive T cells. Using h3T TCR transgenic mice, with human tyrosinase epitope-reactive T cells developed on p53 knockout (KO) background, we determined its role in regulating antitumor T-cell function. Our data show that as compared with h3T cells, h3T-p53 KO T cells exhibited enhanced glycolytic commitment that correlated with increased proliferation, IFNγ secretion, cytolytic capacity, expression of stemness gene signature, and decreased TGF-β signaling. This increased effector function correlated to the improved control of subcutaneously established murine melanoma after adoptive transfer of p53-KO T cells. Pharmacological inhibition of human TCR-transduced T cells using a combination of p53 inhibitors also potentiated the T-cell effector function and improved persistence. Thus, our data highlight the key role of p53 in regulating the tumor-reactive T-cell response and that targeting this pathway could have potential translational significance in adoptive T-cell therapy. Cancer Res; 76(18); 5229-40. ©2016 AACR.


Figures

Figure 1
Figure 1. p53 KO T cells preserve Tcm phenotype despite increased proliferation
A) Splenocytes from the h3T and h3T-p53 KO mouse were harvested and stained with cell trace violet (CTV) dye before stimulating with human tyrosinase peptide pulsed irradiated splenic feeder cells from HLA-A2 mouse. The dilution of CTV dye with time was determined using FACS to evaluate antigen specific proliferation. Adjacent bar diagram shows percent increase in proliferating cells from different experiments. B) Bar diagram representing the total viable splenocytes obtained from three individual h3T and h3T-p53 KO mouse as counted using trypan blue dye. C) Real time quantitative PCR analysis for cyclin D and cyclin inhibitors (CDKn1a, CDKn2a, CDKn2b) was done using RNA obtained from h3T and h3T-p53 KO mouse derived splenic T cells. Data from two repeat experiment is shown. D) Basal cell surface expression of CD44 and CD62L was determined using FACS on Vβ12+ gated splenic T cells from h3T and h3T-p53 KO. Adjacent bar diagram shows percent difference in CD62L+CD44+ T cells from repeat experiments. E) TCR activated splenic T cells from h3T and h3T-p53 KO were used to detrmine expression of senescence associated β-galactosidase as per manufacturer’s protocol, and CD28 expression using FACS. Numerical value represents mean fluorescence intensity. Adjacent bar diagram shows cumulative data from different experiments. (N=3, *p < 0.05; **p < 0.01).
Figure 2
Figure 2. Increased anti-oxidant capacity and lower cell death in p53-KO T cells
TCR activated splenic T cells from h3T and h3T-p53 KO mouse at day three were used: A) after re-stimulation with cognate human tyrosinase antigen pulsed T2-A2 cells for 4 hr and stained using DAF (for NO), or DCF-DA (for H2O2) dyes before analyzing by FACS, B) for staining with alexa-fluor labeled maleamide dye to determine the expression of cell surface thiols (c-SH), and with monochlorobimane dye for determining intracellular glutathione (iGSH) levels using FACS, C) for real time quantitative PCR analysis of anti-oxidant genes catalase and superoxide dismutase using RNA, D) for staining with fluorochrome conjugated phospho-JNK antibody (left panel), and membrane potential dye DiOC6 (right panel) after 4h of re-stimulation, E) for determining AICD 4hr after 4h TCR restimulation by staining with Annexin V and using FACS. Numerical value represents MFI in FACS overlay panels, and adjacent bar diagram represent cumulative data from different experiments. (*p < 0.05). F) Wild type splenic T cells were TCR stimulated cultured for 72h in presence of IL-2 (100 U/ml), after which these were harvested, washed, and then either incubated with NAC (10 mM) for 45 minutes or left untreated. Cells were further TCR re-srimulated and stained with DAF and phopho-p53 antibody following manufacturer’s protocol (BD phosflow), and CD8+ T cells were gated for FACS analysis. N=2.
Figure 3
Figure 3. Increased glycolytic commitment in p53-KO T cells
Splenic T cells from h3T and h3T-p53 KO mouse were TCR activated for three days and used: A) for determining the fluoresecent glucose (2NBDG) uptake using FACS as detailed in Material and methods. B) to obtain RNA for analyzing the expression of key glycolytic genes (i), HIF1-α, and TIGAR (ii), mitochondrial biogenesis regulator PGC1-α (iii), and pentose phosphate pathway genes (iv). C) for determining basal extracellular acidification rate (ECAR) using seahorse assay bio-analyzer as per manufacturer’s protocol. D) to determine phosphorylation level of S6 protein after intracellular staining and analusis using FACS. (*p<0.05; **p<0.01). Bar diagram on right of each overlay represent cumulative data from different experiments.
Figure 4
Figure 4. p53-KO T cells exhibit enhanced effector functions
A) Splenic T cells from h3T and h3T-p53 KO mouse activated for three days were either re-stimulated with cognate human tyrosinase antigen pulsed T2-A2 cells for 6 hr. before performing intracellular staining using flurochrome conjugated anti-cytokine (IL-2, IFN-γ, TNF-α) antibody (left panel), or were re-stimulated overnight to determine the IFN-γ secretion in the supernatant by ELISA (right panel). B) The degree of degranulation was determined in naïve or three day activated h3T and h3T-p53 KO splenic T cells by staining for CD107a expression. RNA isolated from three day activated h3T and h3T-p53 KO mouse were used to determine expression of: C) Transcription factors T-bet and IRF4, and D) Effector molecules and cytokine, cytokine receptors. The fold change in expression of these molecules in h3T-p53 KO T cells was calculated over h3T cells. (*p <0.05; **p <0.01).
Figure 5
Figure 5. Improved tumor control by adoptively transferred h3T-p53 KO T cells
A) Schematic representation of the experimental protocol. B) Tumor growth curve (in mm2) obtained after treating subcutaneously established melanoma in C57BL/6 recipient mice by adoptively transferring either 1 × 10⁶ h3T or h3T-p53 KO T cells. Nine mice per group were treated using ACT. The peripheral blood was obtained from the recipient mice and the adoptively transferred Vβ12+ T cells were evaluated for: C) total percent population; D) cell surface expression of CD44 and CD62L; E) cytokine IFN-γ and TNF-α secretion upon restimulation. F) Activated h3T or h3T-p53 KO splenic T cells were used to prepare RNA and determine the expression of genes related to stem cell phenotype using qPCR. G) Splenic CD8+ T cells obtained from C57BL/6 WT or C57BL/6-p53 KO mouse strains were transduced with HLA-A2+ human tyrosinase epitope reactive TIL1383I TCR splenocytes and 107 cells were adoptively transferred to the Rag-A2 recipients with sub-cutaneously established murine melanoma B16-A2. The tumor growth in various groups of recipient mice that were either treated or left un-treated is shown. Seven mice in each group between two experiments were used and showed identical response. H) Melanoma epitope gp100 reactive T cells were obtained from Pmel TCR transgenic mouse, and activated for three days with cognate antigen either alone or in presence of p53 inhibitors (5 μM Pif-α + Pif-μ). The activated T cells were transferred to the B16-F10 murine melanoma bearing C57BL/6 host and tumor growth were measured twice weekly. A total of 12-16 mice in each group were treated in two experiments with similar results. (*p<0.05; **p<0.005, ***p<0.00, ****p = 0.0006).
Figure 6
Figure 6. Altered TGF-β signaling in p53-KO T cells
A) Activated h3T or h3T-p53 KO splenic CD8+ T cells obtained after FACS sorting were used to prepare RNA and determine the expression of TGF-β receptors (TGF-βRI and TGF-βRII). B) h3T or h3T-p53 KO splenic T cells were cultured for three days under iTreg polarizing conditions, and FoxP3 expression analysis was done using intracellular staining (left panel), or real-time PCR (right panel). C) RNA from A) was also used to run the TGF-β signaling real-time PCR based 84 gene array. The data obtained is presented in fold change with genes grouped for pathways indicated on left. The data is representative from one of two experiments and genes with similar results in both array experiments are presented.
Figure 7
Figure 7. p53 inhibitor treated TCR transduced T cells exhibit increased effector function and persistence
Human peripheral blood T cells from normal healthy individuals were retro-virally transduced with melanoma epitope tyrosinase reactive TIL1383I TCR and were either left untreated or were pretreated for an hour with p53 inhibitors Pifithrin-α (30μM) or Pifithrin-μ (10μM) before TCR restimulation with tyrosinase peptide pulsed T2-A2 cells for 4-6 hrs to analyze: A) Glucose uptake using 2NBDG assay, B) Cytokine secretion by intracellular IFN-γ staining, and C) Susceptibility to AICD by Annexin V staining (*p<0.01). Bar diagram on right of each overlay represent cumulative data from different experiments. D) Ten million human T cells engineered with tyrsoinase reactive TIL1383I TCR were either untreated or pretreated with a combination of p53 inhibitors Pifithrin-α and Pifithrin-μ and adoptively transferred to NSG-A2 mice. Peripheral blood and spleens of recipient mice were stained for human Vβ12, human CD8 and CD4 for tracking the persistence of the transferred cells. Data was acquired using FACS. Numerical value is the average from three mice in similar groups.

References

    1. Feldman SA, Assadipour Y, Kriley I, Goff SL, Rosenberg SA. Adoptive Cell Therapy--Tumor-Infiltrating Lymphocytes, T-Cell Receptors, and Chimeric Antigen Receptors. Seminars in oncology. 2015;42(4):626–39. - PMC - PubMed
    1. Chatterjee S, Thyagarajan K, Kesarwani P, Song JH, Soloshchenko M, Fu J, et al. Reducing CD73 expression by IL1beta-Programmed Th17 cells improves immunotherapeutic control of tumors. Cancer research. 2014;74(21):6048–59. - PMC - PubMed
    1. Kesarwani P, Al-Khami AA, Scurti G, Thyagarajan K, Kaur N, Husain S, et al. Promoting thiol expression increases the durability of antitumor T-cell functions. Cancer research. 2014;74(21):6036–47. - PMC - PubMed
    1. Norell H, Martins da Palma T, Lesher A, Kaur N, Mehrotra M, Naga OS, et al. Inhibition of superoxide generation upon T-cell receptor engagement rescues Mart-1(27-35)-reactive T cells from activation-induced cell death. Cancer research. 2009;69(15):6282–9. - PMC - PubMed
    1. Zuckerman V, Wolyniec K, Sionov RV, Haupt S, Haupt Y. Tumour suppression by p53: the importance of apoptosis and cellular senescence. The Journal of pathology. 2009;219(1):3–15. - PubMed

Publication types

Substances