. 2016 Oct 1;27(19):2924-34.
doi: 10.1091/mbc.E16-01-0029. Epub 2016 Jul 27.

Tau antagonizes end-binding protein tracking at microtubule ends through a phosphorylation-dependent mechanism

Affiliations

Tau antagonizes end-binding protein tracking at microtubule ends through a phosphorylation-dependent mechanism

Sacnicte Ramirez-Rios et al. Mol Biol Cell. .

Abstract

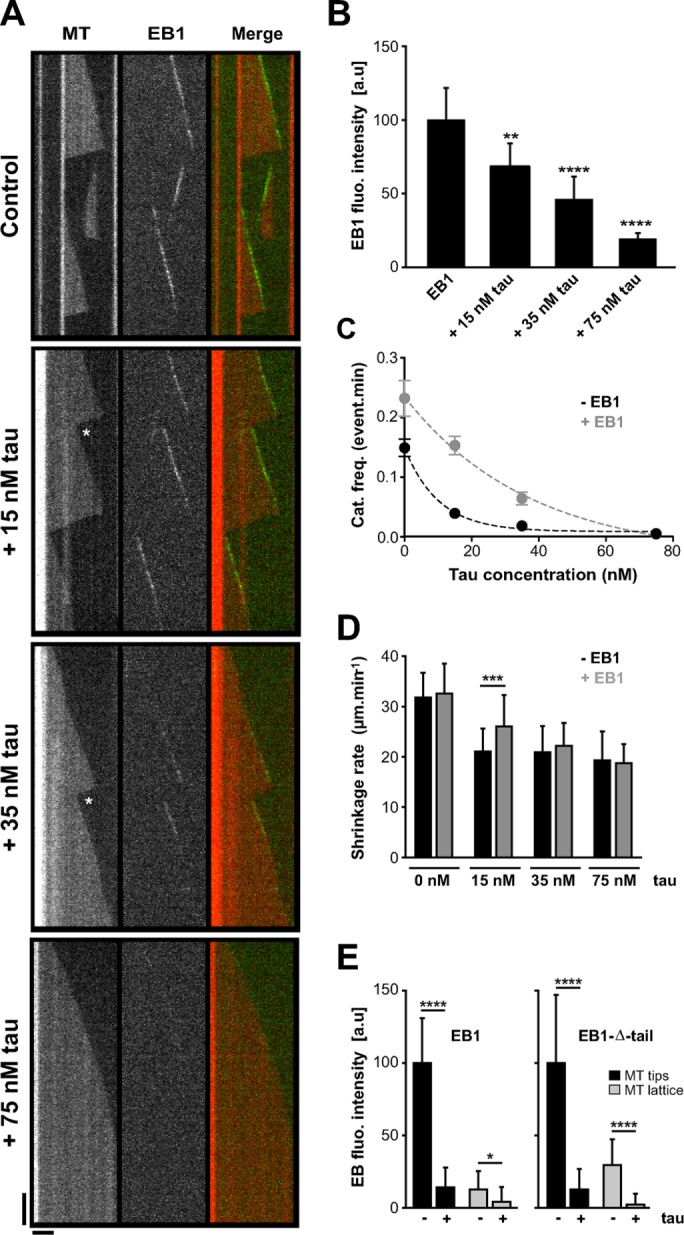
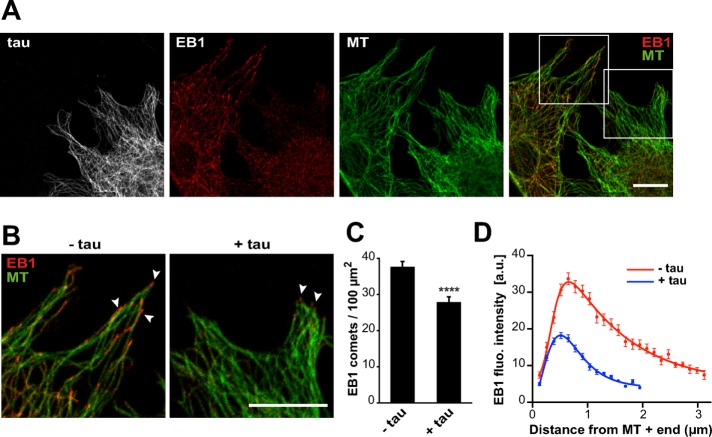
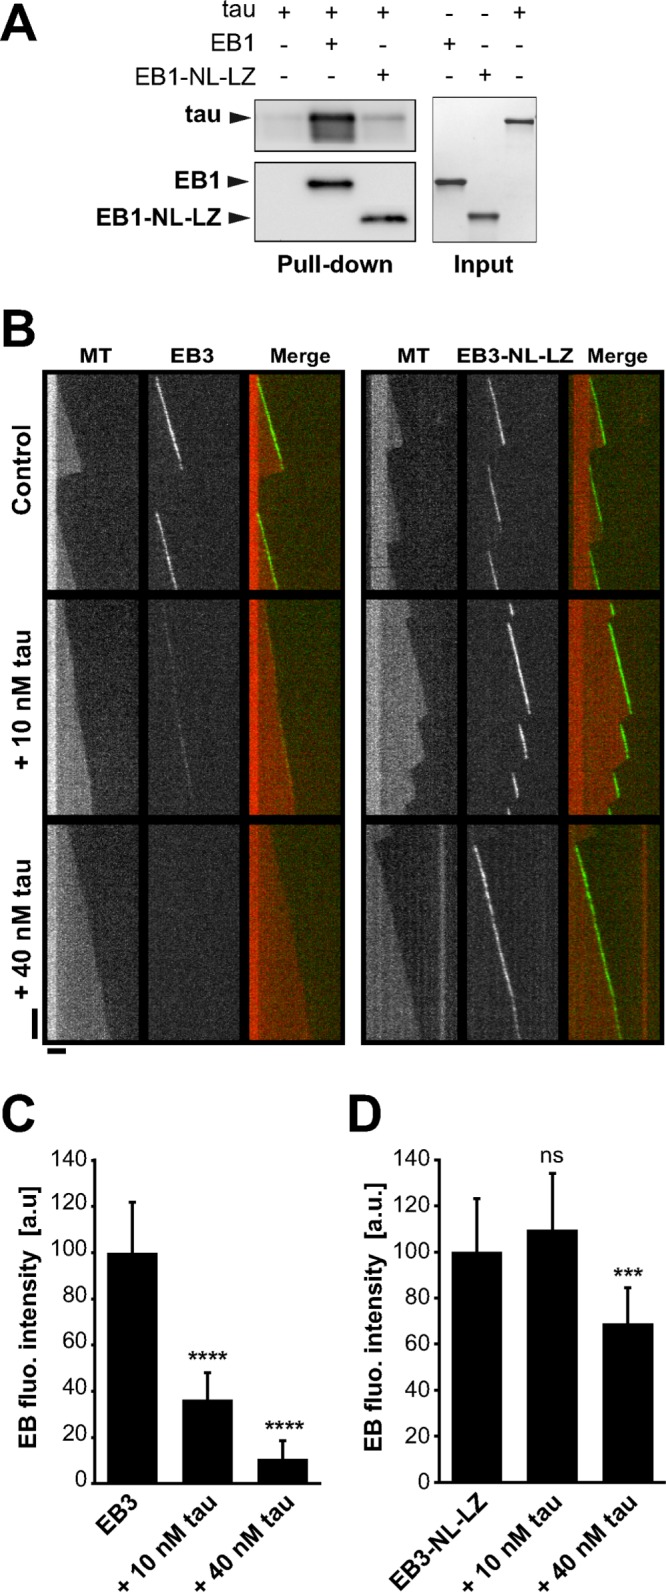
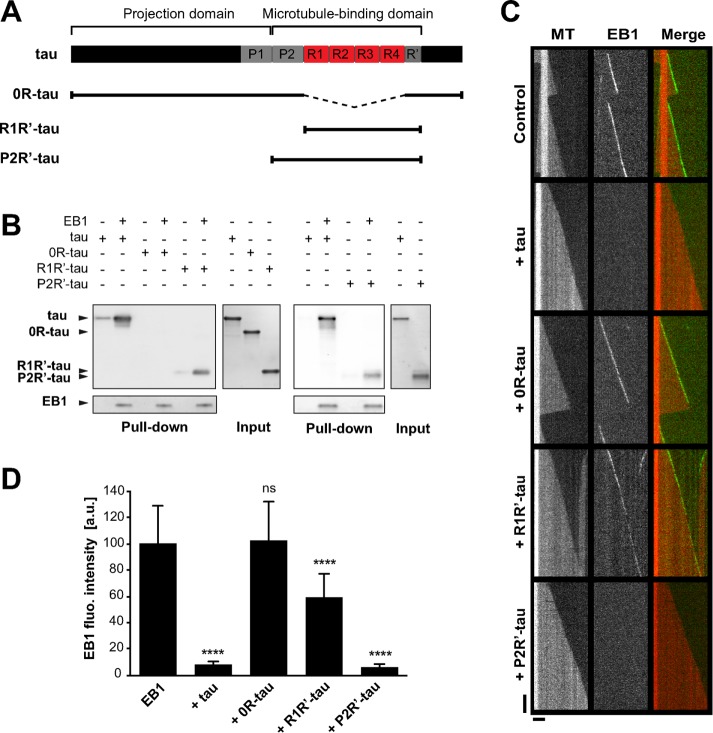
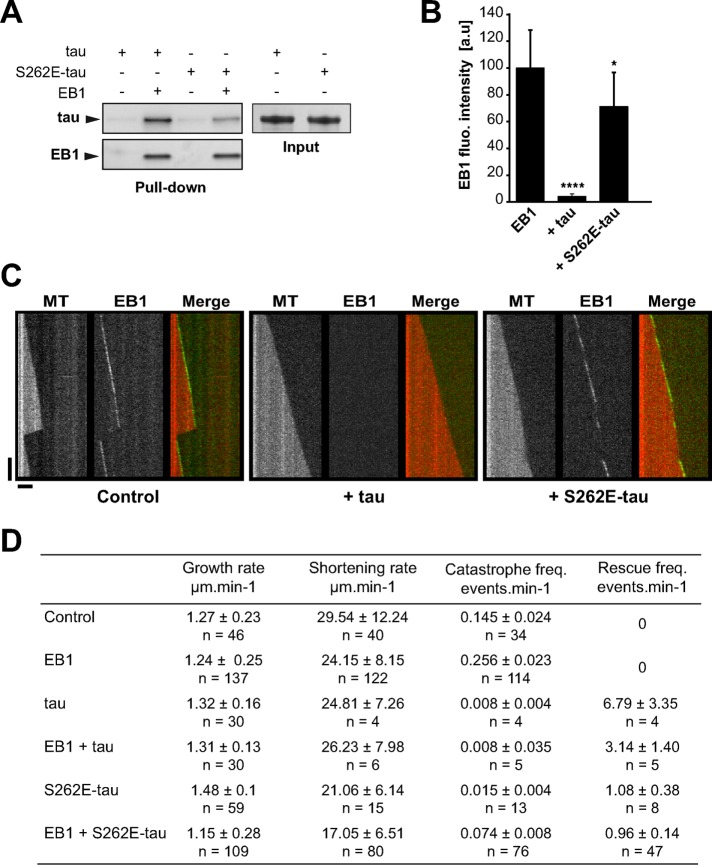
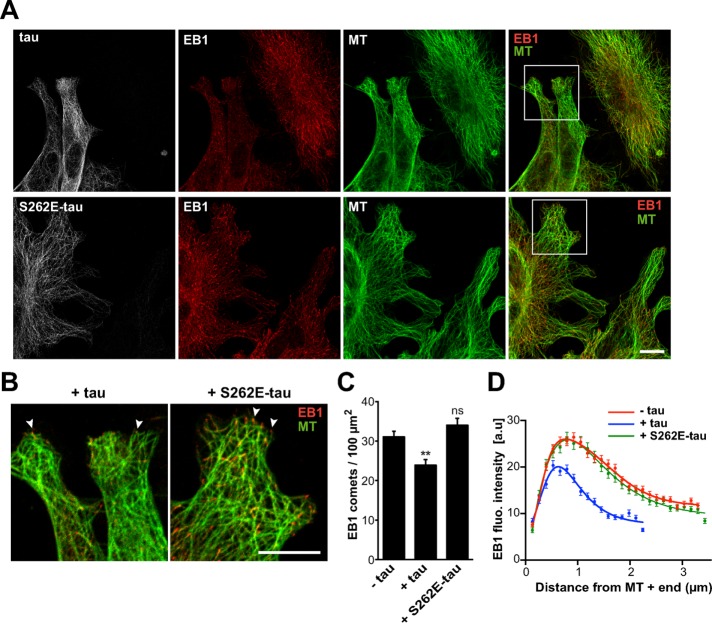
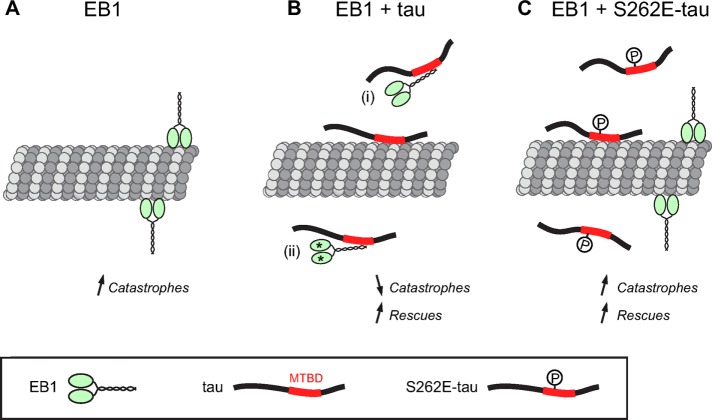
Proper regulation of microtubule dynamics is essential for cell functions and involves various microtubule-associated proteins (MAPs). Among them, end-binding proteins (EBs) accumulate at microtubule plus ends, whereas structural MAPs bind along the microtubule lattice. Recent data indicate that the structural MAP tau modulates EB subcellular localization in neurons. However, the molecular determinants of EB/tau interaction remain unknown, as is the effect of this interplay on microtubule dynamics. Here we investigate the mechanisms governing EB/tau interaction in cell-free systems and cellular models. We find that tau inhibits EB tracking at microtubule ends. Tau and EBs form a complex via the C-terminal region of EBs and the microtubule-binding sites of tau. These two domains are required for the inhibitory activity of tau on EB localization to microtubule ends. Moreover, the phosphomimetic mutation S262E within tau microtubule-binding sites impairs EB/tau interaction and prevents the inhibitory effect of tau on EB comets. We further show that microtubule dynamic parameters vary, depending on the combined activities of EBs and tau proteins. Overall our results demonstrate that tau directly antagonizes EB function through a phosphorylation-dependent mechanism. This study highlights a novel role for tau in EB regulation, which might be impaired in neurodegenerative disorders.


Figures

FIGURE 1:
FIGURE 1:
Tau inhibits EB1 tracking at microtubule ends in a concentration-dependent manner. (A) Kymographs of microtubules assembled in the presence of 75 nM GFP-EB1 alone or with combinations of 75 nM GFP-EB1 and increasing concentrations of tau (15, 35, and 75 nM). The white stars indicate rescues after catastrophe events. Horizontal and vertical bars, 5 μm and 60 s, respectively. MT, microtubule. (B) Histogram indicating GFP-EB1 fluorescence intensity at microtubule tips in the absence or presence of increasing tau concentration. **p < 0.01, ****p < 0.0001 (Kruskal–Wallis analysis of variance [ANOVA] followed by post hoc Dunn’s comparison; n = 35, 75, 81, and 34 for GFP-EB1, GFP-EB1 + 15 nM tau, GFP-EB1 + 35 nM tau, and GFP-EB1 + 75 nM tau, respectively). The p values were calculated in comparison to the condition without tau. a.u., arbitrary units. (C) Catastrophe frequency vs. tau concentration in the absence (black) or presence (gray) of GFP-EB1. Data were fitted by a one-phase exponential decay model (R2 = 0.99 for both data sets), and the two curves were significantly different with p = 0.02 (F-test). (D) Microtubule shrinkage rates measured with or without GFP-EB1 (75 nM) and at increasing tau concentrations (0, 15, 35, and 75 nM). ***p < 0.001 (Mann–Whitney U test, n = 22 and 104 for tau 15 nM and tau 15 nM + GFP-EB1, respectively). (E) Histograms showing GFP-EB1 (left) and GFP-EB1-Δ-tail (right) fluorescence intensity at microtubule tips and on the microtubule lattice in the presence or absence of tau. Equimolar concentrations (75 nM) of GFP-EB1, GFP-EB1-Δ-tail, and tau were used. *p < 0.05, ****p < 0.0001 (Mann–Whitney U test comparison, n = 20 for each condition). All error bars represent SDs.
FIGURE 2:
FIGURE 2:
Tau inhibits EB localization at microtubule ends in fibroblasts. (A) Mouse embryonic fibroblasts were transfected with pEGFP-tau and stained for EGFP (tau, gray), EB1 (red), and tubulin (MT, green). Right, merged image with EB1 and tubulin staining. Images include transfected and nontransfected cells in the same field. Bar, 10 μm. (B) Higher magnifications of nontransfected (−tau) and transfected (+tau) cells. Arrowheads point to comets. Bar, 10 μm. (C) EB1 comet density normalized to the microtubule network surface (comet number/100 μm2 of microtubule network) in lamellipodia of nontransfected (−tau) or pEGFP-tau transfected (+tau) cells. The histogram shows the mean ± SEM. ****p < 0.0001, Mann-Whitney U test comparison (n = 80 and 88 regions of interest for –tau and +tau conditions, respectively). (D) The fluorescence intensity of comets was quantified in nontransfected (−tau) and transfected (+tau) cells and plotted against the distance from microtubule plus ends. Nonlinear regression curves fitting the mean fluorescence intensities ± SEM (70 and 95 comets for –tau and +tau conditions, respectively). a.u., arbitrary units.
FIGURE 3:
FIGURE 3:
Tau inhibitory effect on microtubule-tracking properties of EBs requires the C-terminal part of EBs. (A) Pull-down assays of tau with biotinylated-EB1 or biotinylated-EB1-NL-LZ. (B) Kymographs of microtubules assembled with 10 nM GFP-EB3 (left) or GFP-EB3-NL-LZ (right) in the absence (control) or presence of increasing concentrations of tau. Protein concentrations were decreased compared with conditions with GFP-EB1 and tau (Figure 1) to avoid GFP-EB3-NL-LZ binding to the microtubule lattice. Horizontal and vertical bars, 5 μm and 60 s, respectively. MT, microtubule. (C, D) Fluorescence intensity of GFP-EB3 (C) and GFP-EB3-NL-LZ (D) comets in the absence or presence of increasing concentrations of tau. ***p < 0.001; ****p < 0.0001; ns, nonsignificant; nonparametric Kruskal–Wallis ANOVA followed by post hoc Dunn’s comparison (42, 37, and 48 microtubules for EB3, EB3 + 10 nM tau, and EB3 + 40 nM tau, respectively; 22, 40, and 30 microtubules for EB3-NL-LZ, EB3-NL-LZ + 10 nM tau, and EB3-NL-LZ + 40 nM tau, respectively). The p values were calculated in comparison to the conditions without tau. All error bars represent SD. a.u., arbitrary units.
FIGURE 4:
FIGURE 4:
EB1 interacts with tau microtubule-binding sites. (A) Schematic representation of full-length tau and the constructs used in this study. The N-terminal extremity and the proline-rich P1 region constitute the projection domain of tau. The microtubule-binding domain includes the second proline-rich P2 region, the tandem repeats (R1–R4). and the pseudorepeat motif (R′). (B) Pull-down assays of the indicated tau proteins with biotinylated-EB1. (C) Kymographs of individual microtubules growing with 75 nM GFP-EB1 in the absence (control) or presence of 75 nM indicated tau protein. MT, microtubule. (D) Fluorescence intensity of EB1 comets in the absence or in the presence of the indicated tau proteins. ****p < 0.0001; ns, nonsignificant; nonparametric Kruskal–Wallis ANOVA followed by post hoc Dunn’s comparison (32, 27, 42, and 35 microtubules for EB1, EB1 + tau, EB1 + 0R-tau, and EB1 + R1R′-tau, respectively) and Mann–Whitney U test (30 and 39 microtubules for EB1 and EB1 + P2R′-tau, respectively). The p values were calculated in comparison to the condition without tau. All error bars represent SD. a.u., arbitrary units.
FIGURE 5:
FIGURE 5:
S262E-tau interacts weakly with EB1 and does not inhibit EB1 tracking at microtubule ends. (A) Pull-down assays of tau and S262E-tau with biotinylated-EB1. One representative experiment. Quantifications indicate a decrease of 50.1% ± 15.8 of S262E-tau bound to EB1 compared with tau (three independent experiments, mean ± SD). (B) Quantification of fluorescence intensity of EB1 comets in the presence of tau or S262E-tau. *p < 0.05, ****p < 0.0001, nonparametric Kruskal–Wallis ANOVA followed by post hoc Dunn’s comparison (37, 25, and 26 microtubules for EB1, EB1 + tau, and EB1 + S262E-tau, respectively). The p values were calculated in comparison to the condition without tau. Error bars represent SD. a.u., arbitrary units. (C) Kymographs of microtubules assembled with 75 nM GFP-EB1 in the absence (control) or presence of 75 nM of tau (+ tau) or S262E-tau (+ S262E-tau). Horizontal and vertical bars, 5 μm and 60 s, respectively. MT, microtubule. (D) Microtubule dynamics for tubulin alone (control) or in the presence of EB1, tau, S262E-tau, EB1 + tau, or EB1 + S262E-tau. The total times of measurements were 233.14, 444.28, 487.57, 567.19, 821.12, and 1014.26 min for tubulin alone, EB1, tau, EB1 + tau, S262E-tau, and EB1+S262E-tau, respectively. n, number of events measured for each condition. Values represent the mean ± SD.
FIGURE 6:
FIGURE 6:
S262E-tau does not inhibit endogenous EB1 localization at microtubule ends. (A) Mouse embryonic fibroblasts were transfected with either pcDNA-tau (tau, top) or pcDNA-S262E-tau (S262E-tau, bottom) and stained for tau (gray), EB1 (red), and tubulin (MT, green). Right, merged images with EB1 and tubulin staining. Images include nontransfected and transfected cells in the same field. Bar, 10 μm. MT, microtubule. (B) Higher magnifications of cells transfected with pcDNA-tau (+tau) and pcDNA-S262E-tau (+S262E-tau). Arrowheads point to EB1 comets. Bar, 10 μm. (C) EB1 comet density normalized to the microtubule network surface (comet number/100 μm2 of microtubule network) in lamellipodia of nontransfected cells (−tau) and cells transfected with tau (+tau) or S262E-tau (+S262E-tau). The histogram shows the mean ± SEM. **p < 0.01; ns, nonsignificant; nonparametric Kruskal–Wallis ANOVA followed by post hoc Dunn’s comparison (74, 46, and 52 regions of interest for –tau, +tau, and +S262E-tau conditions, respectively). The p values were calculated in comparison to the condition without tau. (D) The fluorescence intensity of comets was quantified in nontransfected (−tau) and transfected cells (+tau and +S262E-tau) and plotted against distance from microtubule plus ends. Nonlinear regression curves fitting the mean fluorescence intensities ± SEM (247, 177, and 132 comets for –tau, +tau, and +S262E-tau cells, respectively). a.u., arbitrary units.
FIGURE 7:
FIGURE 7:
Model for the inhibitory activity of tau on EB tracking at microtubule ends. (A) In the absence of tau, EB1 binds to microtubule ends and exerts its intrinsic catastrophe-promoting activity. (B) The microtubule-binding domain (MTBD) of tau directly interacts with the C-terminal part of EB1. This interaction would hamper EB1 localization to microtubule ends through EB1 sequestration (i) and/or EB1 conformational changes (stars; ii). In these conditions, the catastrophe frequency decreases concomitantly with the apparition of rescues. (C) The phosphomimetic mutation S262E within tau MTBD impairs EB1/tau interaction and prevents tau-mediated inhibition of EB1 comets at microtubule ends. Microtubules are dynamic and undergo both catastrophes and rescues due to the opposing activities of EB1 and S262E-tau.

Similar articles

Cited by

References

    1. Ackmann M, Wiech H, Mandelkow E. Nonsaturable binding indicates clustering of tau on the microtubule surface in a paired helical filament-like conformation. J Biol Chem. 2000;275:30335–30343. - PubMed
    1. Akhmanova A, Steinmetz MO. Microtubule +TIPs at a glance. J Cell Sci. 2010;123:3415–3419. - PubMed
    1. Alonso AD, Di Clerico J, Li B, Corbo CP, Alaniz ME, Grundke-Iqbal I, Iqbal K. Phosphorylation of tau at Thr212, Thr231, and Ser262 combined causes neurodegeneration. J Biol Chem. 2010;285:30851–30860. - PMC - PubMed
    1. Amos LA, Schlieper D. Microtubules and maps. Adv Protein Chem. 2005;71:257–298. - PubMed
    1. Bieling P, Laan L, Schek H, Munteanu EL, Sandblad L, Dogterom M, Brunner D, Surrey T. Reconstitution of a microtubule plus-end tracking system in vitro. Nature. 2007;450:1100–1105. - PubMed

Publication types