. 2016 Jul 27;36(30):7829-40.
doi: 10.1523/JNEUROSCI.0262-16.2016.

Neural Responses to Heartbeats in the Default Network Encode the Self in Spontaneous Thoughts

Affiliations

Neural Responses to Heartbeats in the Default Network Encode the Self in Spontaneous Thoughts

Mariana Babo-Rebelo et al. J Neurosci. .

Abstract

The default network (DN) has been consistently associated with self-related cognition, but also to bodily state monitoring and autonomic regulation. We hypothesized that these two seemingly disparate functional roles of the DN are functionally coupled, in line with theories proposing that selfhood is grounded in the neural monitoring of internal organs, such as the heart. We measured with magnetoencephalograhy neural responses evoked by heartbeats while human participants freely mind-wandered. When interrupted by a visual stimulus at random intervals, participants scored the self-relatedness of the interrupted thought. They evaluated their involvement as the first-person perspective subject or agent in the thought ("I"), and on another scale to what degree they were thinking about themselves ("Me"). During the interrupted thought, neural responses to heartbeats in two regions of the DN, the ventral precuneus and the ventromedial prefrontal cortex, covaried, respectively, with the "I" and the "Me" dimensions of the self, even at the single-trial level. No covariation between self-relatedness and peripheral autonomic measures (heart rate, heart rate variability, pupil diameter, electrodermal activity, respiration rate, and phase) or alpha power was observed. Our results reveal a direct link between selfhood and neural responses to heartbeats in the DN and thus directly support theories grounding selfhood in the neural monitoring of visceral inputs. More generally, the tight functional coupling between self-related processing and cardiac monitoring observed here implies that, even in the absence of measured changes in peripheral bodily measures, physiological and cognitive functions have to be considered jointly in the DN.

Significance statement: The default network (DN) has been consistently associated with self-processing but also with autonomic regulation. We hypothesized that these two functions could be functionally coupled in the DN, inspired by theories according to which selfhood is grounded in the neural monitoring of internal organs. Using magnetoencephalography, we show that heartbeat-evoked responses (HERs) in the DN covary with the self-relatedness of ongoing spontaneous thoughts. HER amplitude in the ventral precuneus covaried with the "I" self-dimension, whereas HER amplitude in the ventromedial prefrontal cortex encoded the "Me" self-dimension. Our experimental results directly support theories rooting selfhood in the neural monitoring of internal organs. We propose a novel functional framework for the DN, where self-processing is coupled with physiological monitoring.

Keywords: MEG; default network; heartbeat-evoked responses; self; spontaneous cognition.


Figures

Figure 1.
Figure 1.
Experimental paradigm and behavior. A, Examples of thoughts along the two scales of self-relatedness. The “Me” scale described the content of the thought oriented either toward oneself or toward an external object, event, or person. The “I” scale described the engagement of the participant as the protagonist or the agent in the thought. B, Time course of a trial. Each trial consisted of a fixation period (13.5–30 s, randomized) interrupted by a visual stimulus. During fixation, participants were asked to let their thoughts develop freely while avoiding structured thinking (e.g., singing, counting…). Participants pressed a button in response to the visual stimulus and had to remember the thought that was interrupted by the visual stimulus. Then, they rated this thought along four scales (“I,” “Me,” Time, and Valence). Participants could also skip the ratings if the interrupted thought was unclear or if they were not sure how to use the scales. C, Selection of MEG data locked to the two T peaks of the ECG preceding the visual stimulus to compute heartbeat-evoked responses during the thought. D, Distribution of ratings on the scales, across all participants (n = 16) and thoughts (n = 80 per participant). Error bars indicate SEM.
Figure 2.
Figure 2.
Differential HERs for “high” and “low” ratings on the “I” scale. A, Topographical map of the HER difference between “high” and “low” ratings on the “I” scale, grand-averaged across 16 participants, in the 298–327 ms time window in which a significant difference was observed (Monte Carlo p = 0.0313, corrected for multiple comparisons). White dots represent the sensors contributing to the significant cluster. B, Time course of the HER (± SEM) for “high” and “low” ratings on the “I” scale at the sensor indicated in A (white star). The signal that might be residually contaminated by the cardiac artifact appears in lighter color (before 80 ms, not included in the analysis). Black bar represents the time window in which a significant difference was observed. C, HER cluster amplitude, during thoughts rated as “high” or “low” along the “I” scale, and during a separate eyes-open resting state session. Cluster amplitude during rest was intermediate between cluster amplitude during thoughts rated as “high” (p = 0.0016) and cluster amplitude during thoughts rated as “low” (p = 0.0088). D, Histogram of the distribution of the maximal cluster t statistic (difference between “high” and “low” trials) obtained for the 100 permutations of surrogate heartbeats. The original cluster t statistic (arrow) lies outside the distribution of statistics obtained on surrogate data. E, Neural sources of the differential HERs for thoughts rated as “high” or “low” on the “I” scale. Only the left vPC (black circle) survived correction for multiple comparisons (Monte Carlo p = 0.037; threshold for visualization: >10 contiguous vertices at uncorrected p < 0.005). F, Time course of the HERs (± SEM) in the left vPC. Signal that might be residually contaminated by the cardiac artifact appears in lighter color (before 80 ms). Black bar represents the time window of the significant HER difference at the sensor level. The average neural currents in this time window differed from 0 for “high” ratings (p = 0.0017), but not for “low” ratings (p = 0.56, Bayes factor = 1.78), showing that an HER could be detected in the vPC only when the self was the subject of the ongoing thought. *p < 0.05. **p < 0.01. ***p < 0.005.
Figure 3.
Figure 3.
Differential HERs for “high” and “low” ratings on the “Me” scale. A, Topographical map of the HER difference between “high” and “low” ratings on the “Me” scale, grand-averaged across 16 participants, in the 94–169 ms time window in which a significant difference was observed (Monte Carlo p = 0.0097, corrected for multiple comparisons). White dots represent the sensors contributing to the significant cluster. B, Time course of the HER (± SEM) for “high” and “low” ratings on the “Me” scale at the sensor indicated in A (white star). The signal that might be residually contaminated by the cardiac artifact appears in lighter color (before 80 ms, not included in the analysis). Black bar represents the time window in which a significant difference was observed. C, HER cluster amplitude, during thoughts rated as “high” or “low” along the “Me” scale, and during a separate eyes-open resting state session. Cluster amplitude during rest was intermediate between cluster amplitude during thoughts rated as “high” (p = 0.048) and cluster amplitude during thoughts rated as “low” (p = 0.0072). D, Histogram of the distribution of the maximal cluster t statistic (difference between “high” and “low” trials) obtained for 100 permutations of surrogate heartbeats. The original cluster t statistic (arrow) lies outside the distribution of statistics obtained on surrogate data. E, Neural sources of the differential HERs for thoughts rated as “high” or “low” on the “Me” scale. Only the left vmPFC (black circle) survived correction for multiple comparisons (Monte Carlo p = 0.030; threshold for visualization: >10 contiguous vertices at uncorrected p < 0.005). F, Time course of the HERs (± SEM) in the left vmPFC. Signal that might be residually contaminated by the cardiac artifact appears in lighter color (before 80 ms). Black bar represents the time window of the significant HER difference at the sensor level. The average neural currents in this time window differed from 0 for “high” ratings (p = 1.7 × 10⁻⁴), but not for “low” ratings (p = 1, Bayes factor = 4.40), showing that an HER could be detected in the vmPFC only when the self was the object of the ongoing thought. *p < 0.05. **p < 0.01. ***p < 0.005.
Figure 4.
Figure 4.
Functional connectivity between vmPFC and vPC and overlap with default network (DN). Red-white represents functional connectivity computed from resting-state BOLD time series of 1000 subjects at rest (Yarkoni et al., 2011), with a seed placed in left vmPFC (MNI coordinates: 0, 45, −15, left, red dot) where a differential HER along the “Me” dimension was observed. The left vPC region showing a differential HER along the “I” dimension (MNI coordinates: −8, −59, 25; right, blue dot) is functionally connected to left vmPFC (Pearson correlation r = 0.47). Green outline represents the DN (Laird et al., 2011).
Figure 5.
Figure 5.
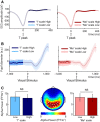
Controls. A, Time course of the average ECG signal (± SEM) for “high” and “low” ratings along the “I” (left) and “Me” (right) scales, on the vertical derivation lead II. The signal appearing in darker color corresponds to the time window that was analyzed in the MEG data. The ECG, recorded from seven electrodes around the base of the neck to carefully monitor the potential direct contribution of heart electrical activity to MEG signals, appeared similar in “high” versus “low” trials on both scales, and no significant differences were found. B, Time course of the average pupil diameter (± SEM) signal for “high” and “low” ratings along the “I” (left) and “Me” (right) scales. We analyzed the time window during the thought, from the last-but-one heartbeat to 400 ms preceding the visual stimulus (signal in darker color). We observed no statistical difference between “high” and “low” trials for either the “I” or the “Me” scales (both p ≥ 0.67, both Bayes factors ≥3.78). C, Average alpha power (± SEM) for “high” and “low” ratings along the “I” (left) and “Me” (right) scales, on the 15 sensors with the largest alpha power across conditions, indicated by white dots in the alpha power topographical map (center). We did not observe differences in alpha power between “high” and “low” trials for either scale (both p ≥ 0.41, both Bayes factors ≥2.57). NS, Not significant.

Similar articles

Cited by

References

    1. Andrews-Hanna JR, Smallwood J, Spreng RN. The default network and self-generated thought: component processes, dynamic control, and clinical relevance. Ann N Y Acad Sci. 2014;1316:29–52. doi: 10.1111/nyas.12360. - DOI - PMC - PubMed
    1. Armour JA, Ardell JL. Basic and clinical neurocardiology. In: Armour JA, Ardell JL, editors. New York: Oxford UP; 2004.
    1. Beissner F, Meissner K, Bär KJ, Napadow V. The autonomic brain: an activation likelihood estimation meta-analysis for central processing of autonomic function. J Neurosci. 2013;33:10503–10511. doi: 10.1523/JNEUROSCI.1103-13.2013. - DOI - PMC - PubMed
    1. Birn RM. The role of physiological noise in resting-state functional connectivity. Neuroimage. 2012;62:864–870. doi: 10.1016/j.neuroimage.2012.01.016. - DOI - PubMed
    1. Bishara AJ, Hittner JB. Testing the significance of a correlation with nonnormal data: comparison of Pearson, Spearman, transformation, and resampling approaches. Psychol Methods. 2012;17:399–417. doi: 10.1037/a0028087. - DOI - PubMed

Publication types

LinkOut - more resources