. 2016 Jul 27;36(30):7957-70.
doi: 10.1523/JNEUROSCI.0736-16.2016.

Neural Activity in the Ventral Pallidum Encodes Variation in the Incentive Value of a Reward Cue

Affiliations

Neural Activity in the Ventral Pallidum Encodes Variation in the Incentive Value of a Reward Cue

Allison M Ahrens et al. J Neurosci. .

Abstract

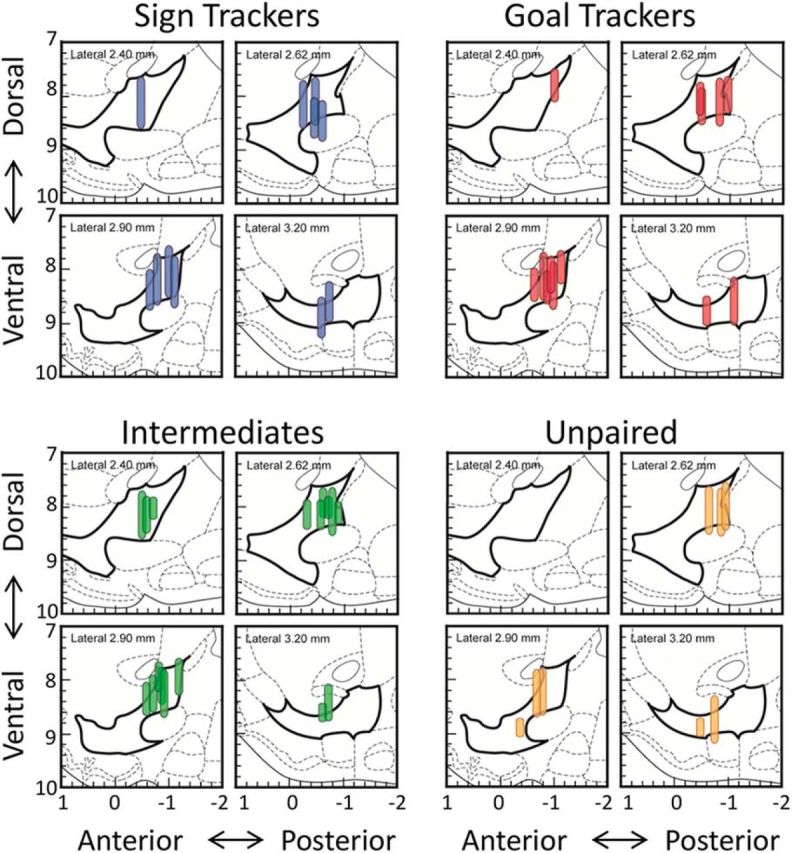
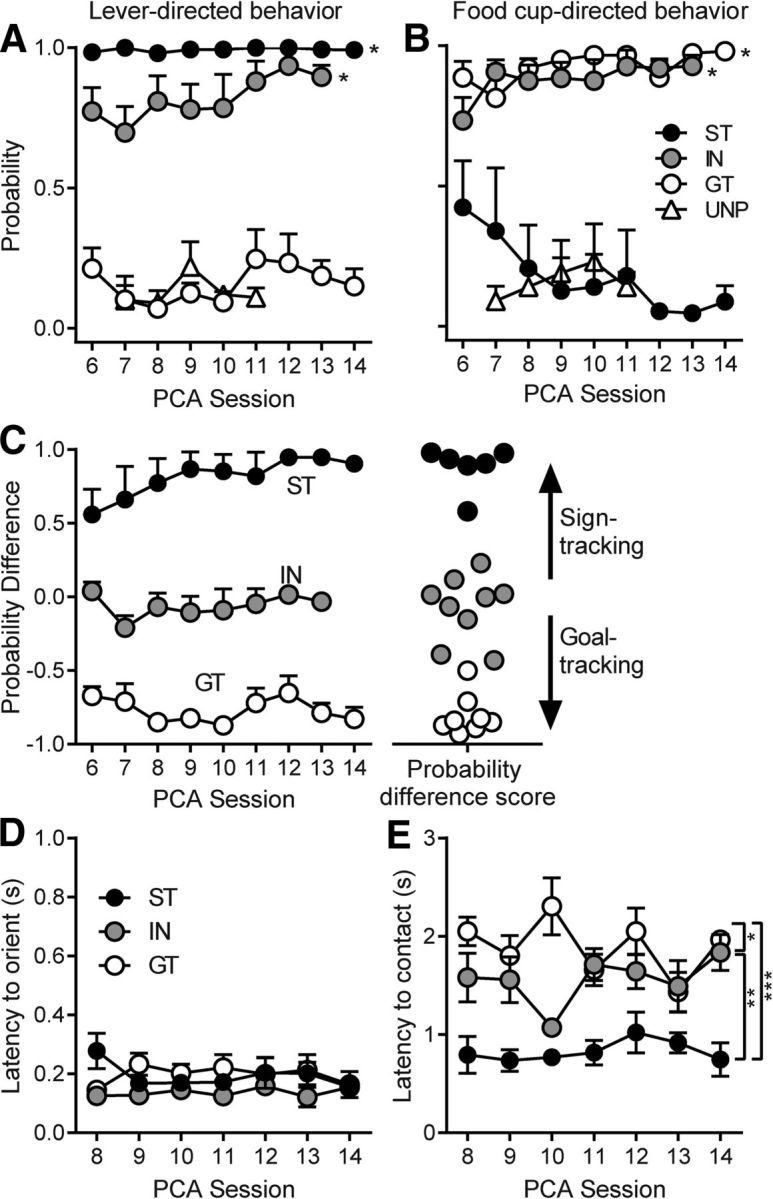
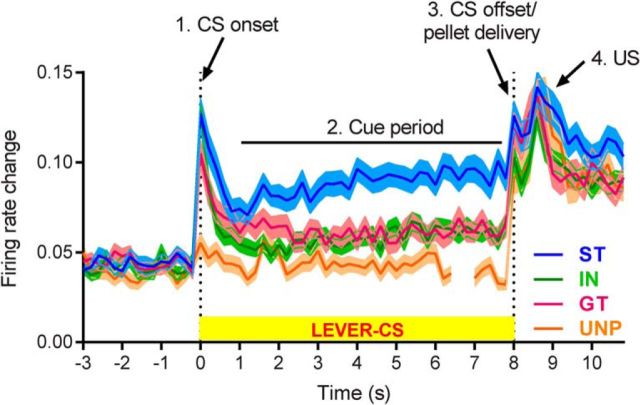
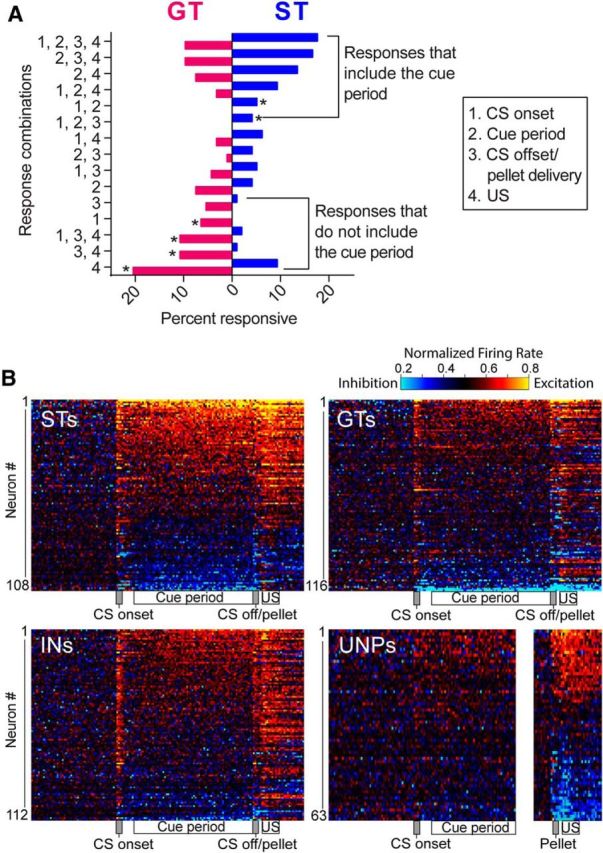
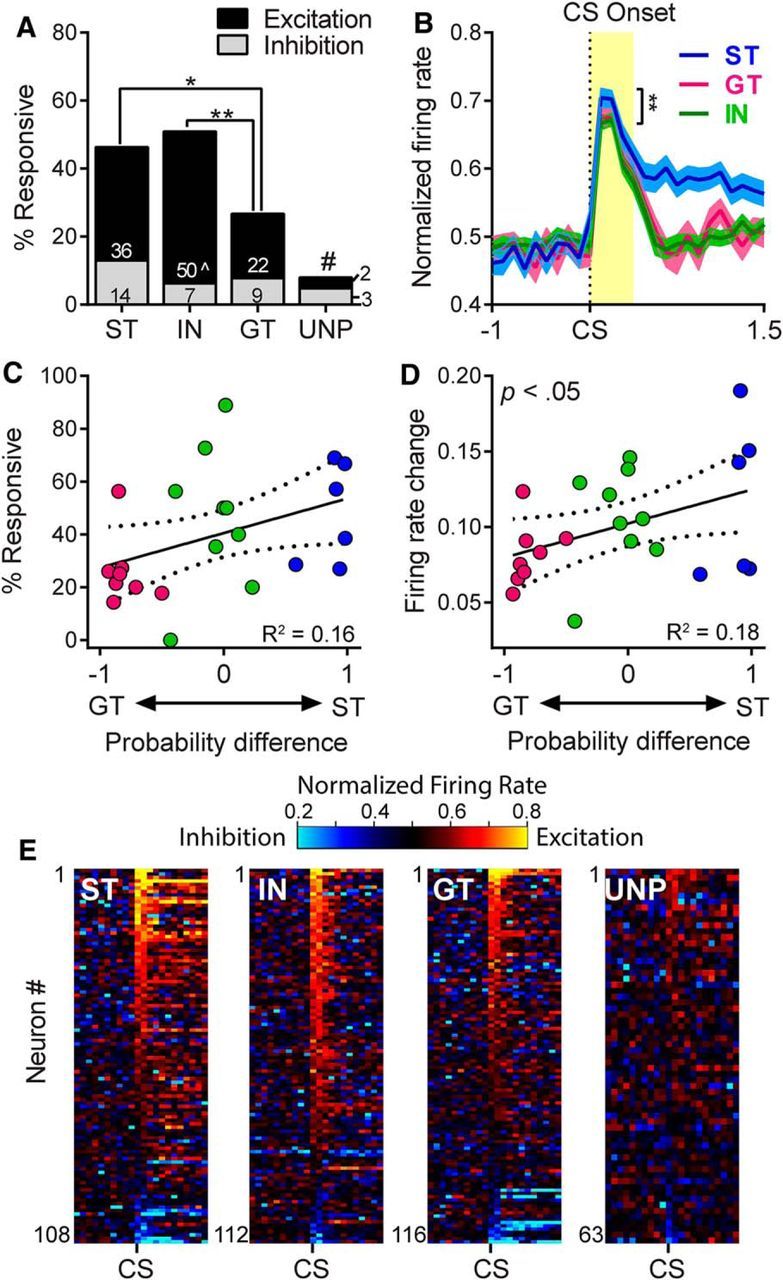
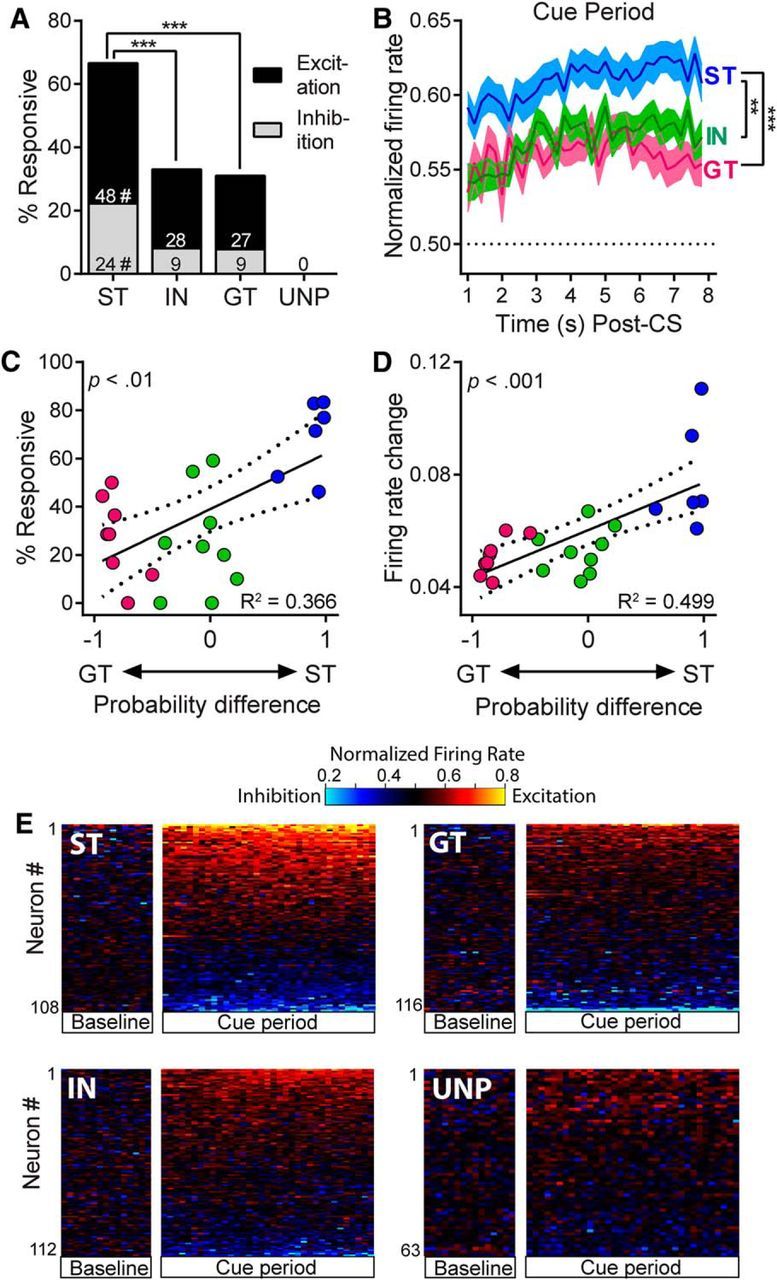
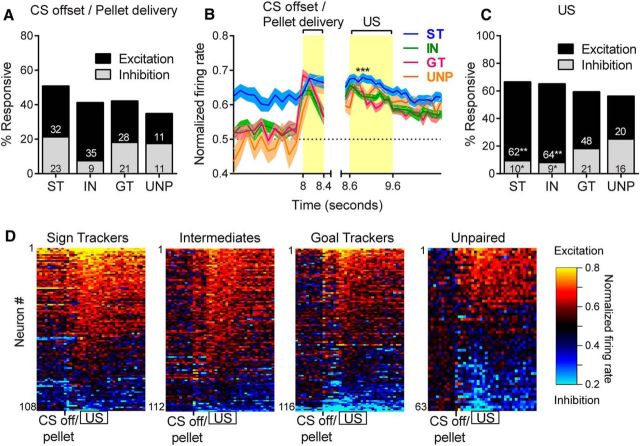
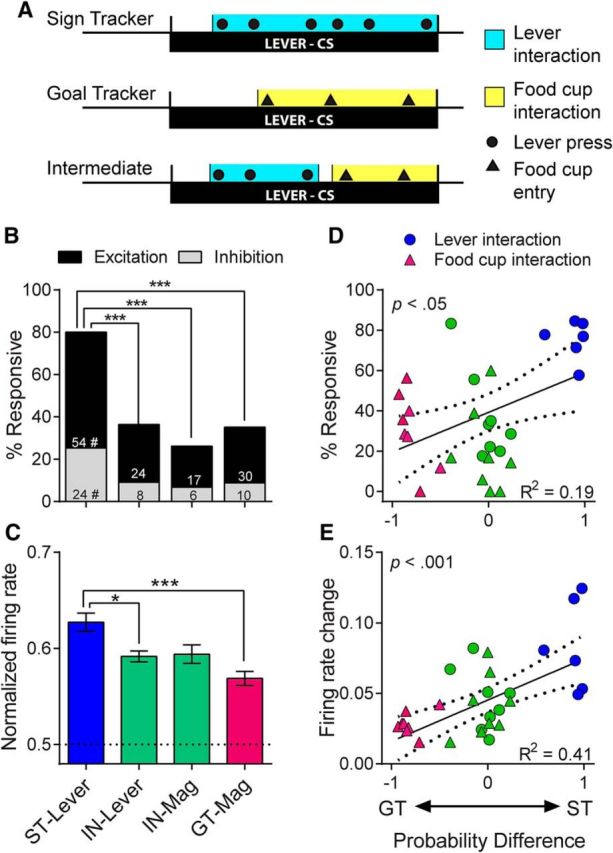
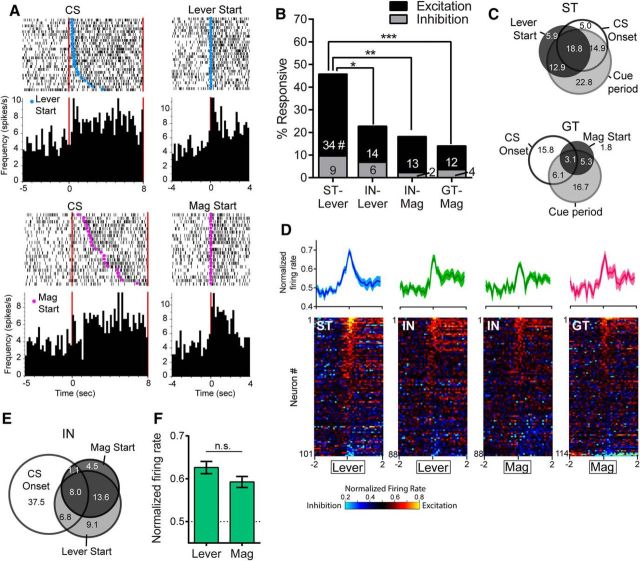
There is considerable individual variation in the extent to which reward cues are attributed with incentive salience. For example, a food-predictive conditioned stimulus (CS; an illuminated lever) becomes attractive, eliciting approach toward it only in some rats ("sign trackers," STs), whereas others ("goal trackers," GTs) approach the food cup during the CS period. The purpose of this study was to determine how individual differences in Pavlovian approach responses are represented in neural firing patterns in the major output structure of the mesolimbic system, the ventral pallidum (VP). Single-unit in vivo electrophysiology was used to record neural activity in the caudal VP during the performance of ST and GT conditioned responses. All rats showed neural responses to both cue onset and reward delivery but, during the CS period, STs showed greater neural activity than GTs both in terms of the percentage of responsive neurons and the magnitude of the change in neural activity. Furthermore, neural activity was positively correlated with the degree of attraction to the cue. Given that the CS had equal predictive value in STs and GTs, we conclude that neural activity in the VP largely reflects the degree to which the CS was attributed with incentive salience.

Significance statement: Cues associated with reward can acquire motivational properties (i.e., incentive salience) that cause them to have a powerful influence on desire and motivated behavior. There are individual differences in sensitivity to reward-paired cues, with some individuals attaching greater motivational value to cues than others. Here, we investigated the neural activity associated with these individual differences in incentive salience. We found that cue-evoked neural firing in the ventral pallidum (VP) reflected the strength of incentive motivation, with the greatest neural responses occurring in individuals that demonstrated the strongest attraction to the cue. This suggests that the VP plays an important role in the process by which cues gain control over motivation and behavior.

Keywords: Pavlovian conditioning; goal tracking; motivation; rats; sign tracking; ventral pallidum.


Figures

Figure 1.
Figure 1.
Recording sites in the VP are shown for each group. Vertical lines mark the dorsal–ventral range of recording sites from each wire bundle because wires were initially implanted above the VP and lowered 80–160 μm on each day of recording. Electrode placement is shown in the sagittal plane, with left and right hemispheres combined and bregma = 0.
Figure 2.
Figure 2.
The probability of contacting the lever or food cup (mean ± SEM) during the PCA sessions in which neural activity was recorded. Rats showed stable individual differences in the tendency to display ST or GT CRs during exposure to the lever CS. In the unpaired group (UNP), the lever was not paired with food reward. A, B, STs and INs had a higher probability of contacting the lever than GTs and the unpaired group (*p < 0.001; A), whereas GTs and INs had a greater probability of contacting the food cup than STs and the unpaired group (*p < 0.001; B). C, Probability difference (the probability of lever contact minus the probability of food-cup contact) was used to classify rats as STs, INs, or GTs. Probability difference scores were calculated for each rat by averaging across all days of recording and rats were classified as STs if their scores fell >0.5, GTs if their scores fell below −0.5, and INs if their scores were between 0.5 and −0.5. D, There were no differences between STs, INs, and GTs in the latency to display an orienting response to the lever CS. E, Latency to make initial contact with the target of conditioned approach was shortest in STs, though INs were faster than GTs; *p < 0.05, **p < 0.01, ***p < 0.001.
Figure 3.
Figure 3.
Average VP firing rate changes across a trial. VP cells were very responsive to task events in STs, GTs, and INs (but not the unpaired control group; UNP). During the cue period, when the lever was available and rats performed ST or GT CRs, the change in neural firing was greater in STs than in GTs or INs. All groups, including the unpaired group, showed enhanced neural activity in response to pellet delivery and receipt. The UNP line is shown with a gap between lever and pellet trials because the CS and US occurred in separate trials for the unpaired group. Data are shown as normalized firing rates (mean ± SEM), with all change from baseline shown as positive in direction. All cells from each group are included, whether they were considered responsive to task events or not (ST, n = 108; IN, n = 112; GT, n = 116; UNP, n = 63).
Figure 4.
Figure 4.
Many VP cells were responsive to more than one of the four task events and several different response combinations were observed. A, Percentage of cells with each combination of responses. The most frequent firing patterns for STs included the cue period in combination with other CS and/or US events, whereas GTs frequently responded to combination of CS onset, CS offset, and/or US retrieval, but not the cue period (*p < 0.05, significant differences between STs and GTs, χ2 with uncorrected p-values). B, STs have more sustained changes in activity compared with the punctate pattern in GTs. Overall VP activity is depicted for each group in heat maps, in which each row represents the firing of an individual cell, with rows sorted by highest to lowest normalized firing rate during all four events combined.
Figure 5.
Figure 5.
Neural activity during the cue onset period, defined as the first 400 ms after the lever CS was extended into the cage. Presentation of the lever CS elicited an immediate (and largely excitatory) neural response in the VP. A, STs, GTs, and INs all had significantly more responsive cells than the unpaired (UNP) group, #p < 0.01–0.001; STs and INs both had significantly more responsive cells than GTs; *p < 0.05, **p < 0.01. When excitatory responses were examined separately, the only significant difference was between INs and GTs, ∧p < 0.001. B, The magnitude of excitation did not differ between STs and GTs, although it was significantly greater in STs compared with INs; **p < 0.01. C, D, When firing was examined in individual rats there was no correlation between probability difference scores and the percentage of responsive neurons (C); however, there was a significant correlation between probability difference scores and the overall magnitude of firing changes during CS onset (D). E, Cue responses of individual cells are shown in heat maps (100 ms bins) sorted by highest to lowest firing rate during the first 200 ms after lever insertion cue onset.
Figure 6.
Figure 6.
Neural activity during the cue interaction period while rats engaged in ST or GT behavior. A, STs had significantly more responsive cells than GTs and INs; ***p < 0.001; and this was true for excitatory responses as well as inhibitory responses, #p < 0.05-.01. The unpaired group had zero cells that were responsive during the cue period. B, Magnitude of excitation during the cue period was significantly greater in STs than in INs and GTs (the horizontal line represents baseline firing); **p < 0.01, ***p < 0.001. C, D, When neural activity was examined for individual rats, probability difference scores were significantly correlated with the proportion of cells responsive during the cue period (C) and the magnitude of firing rate change during the cue period (D). E, Heat maps showing the firing patterns of individual neurons sorted by response magnitude during the cue period (shown in 200 ms bins). Firing is aligned to CS onset, but the CS onset interval is omitted. VP neural activity was visibly more intense for STs than it was for INs, GTs, or unpaired (UNP) rats.
Figure 7.
Figure 7.
Neural activity during the moment when the pellet was delivered (CS offset/pellet delivery) as well as during the interval when the pellet was retrieved (US). A high percentage of VP neurons responded during this period, although the excitatory response to the US was greater in STs than in the other groups. A, Percentage of neurons that responded to CS offset/pellet delivery did not differ between groups. B, Magnitude of excitatory responses to both the CS offset/pellet delivery epoch and the US epoch in 100 ms bins STs showed significantly higher magnitude of excitation during the US period compared with INs (p < 0.01) and GTs (p < 0.001). C, During the US epoch, STs and INs had more excitatory responses and fewer inhibitory responses than the unpaired (UNP) group; *p < 0.05, **p < 0.01. D, Because the US epoch occurred so close in time to the CS offset/pellet delivery epoch, both are shown in the same heat maps, with rows sorted by the magnitude of firing during the US epoch.
Figure 8.
Figure 8.
Although the 7 s cue period described above captured periods of sign- and goal-tracking, there was some variation in behavior from trial to trial. Therefore, we isolated the portion of each trial in which rats were actively engaged with the lever or magazine. A, Example ratings of lever and magazine interaction intervals for individual trials. B, STs had significantly more cells that were responsive during their interaction with the lever CS than INs during interactions with either the lever CS or the food magazine and than GTs during interactions with the food magazine; ***p < 0.001. This was true for excitatory and inhibitory responses, as STs had more of both than INs and GTs; # p < 0.05–0.001. C, The increase in firing during interaction intervals (among excitatory cells only) was significantly greater in STs than GTs and IN-Lever; *p < 0.05, ***p < 0.001. There were significant correlations between probability difference scores and the percentage of responsive cells (D) and the firing rate change for individual rats (E).
Figure 9.
Figure 9.
VP neural activity at the moment of initial contact with the lever or magazine. A, Example rasters and histograms are shown for a single ST cell (top) and a single GT cell (bottom) that were responsive both to task events and the start of lever or magazine interaction (“lever start” and “mag start,” respectively). Left panels show spikes aligned to CS onset, with trials sorted by the latency of lever start or mag start. In the right panels, the same cells show clear excitatory responses when aligned to lever start or mag start. B, STs had significantly more cells responsive to Lever Start than GTs and INs had responsive to either Lever Start or Mag Start; *p < 0.05, ***p < 0.001. These group differences were observed among excitatory responses, but not inhibitory responses; #STs significantly greater than IN-Lever (p < 0.05), IN-Mag (p < 0.001), and GT-Mag (p < 0.001). C, Venn diagrams showing that the majority of contact-responsive neurons in STs and GTs were also considered responsive to CS onset and/or the cue period (numbers are percentage responsive to each combination). D, Heat maps showing firing aligned to initial lever or magazine contact. Figures above show the average magnitude of excitation in that group (100 ms bins). Although the population response was stronger in STs (in terms of percentage), the magnitude of responses did not differ between groups. E, INs had cells that were responsive to both lever and magazine start, as well as other task events. Venn diagrams show the overlap of responses to lever start, mag start, and CS onset. F, Among IN cells that showed excitatory responses to both lever and mag start, there was no significant difference in the magnitude of responses.

References

    1. Ambroggi F, Ghazizadeh A, Nicola SM, Fields HL. Roles of nucleus accumbens core and shell in incentive-cue responding and behavioral inhibition. J Neurosci. 2011;31:6820–6830. doi: 10.1523/JNEUROSCI.6491-10.2011. - DOI - PMC - PubMed
    1. Avila I, Lin SC. Motivational salience signal in the basal forebrain is coupled with faster and more precise decision speed. PLoS Biol. 2014a;12:e1001811. doi: 10.1371/journal.pbio.1001811. - DOI - PMC - PubMed
    1. Avila I, Lin SC. Distinct neuronal populations in the basal forebrain encode motivational salience and movement. Front Behav Neurosci. 2014b;8:421. doi: 10.3389/fnbeh.2014.00421. - DOI - PMC - PubMed
    1. Beckmann JS, Chow JJ. Isolating the incentive salience of reward-associated stimuli: value, choice, and persistence. Learn Mem. 2015;22:116–127. doi: 10.1101/lm.037382.114. - DOI - PMC - PubMed
    1. Cardinal RN, Parkinson JA, Hall J, Everitt BJ. Emotion and motivation: the role of the amygdala, ventral striatum, and prefrontal cortex. Neurosci Biobehav Rev. 2002;26:321–352. doi: 10.1016/S0149-7634(02)00007-6. - DOI - PubMed

Publication types

LinkOut - more resources