. 2016 Jul;6(7):160055.
doi: 10.1098/rsob.160055.

Dynamic phosphorylation of RelA on Ser42 and Ser45 in response to TNFα stimulation regulates DNA binding and transcription

Affiliations

Dynamic phosphorylation of RelA on Ser42 and Ser45 in response to TNFα stimulation regulates DNA binding and transcription

Francesco Lanucara et al. Open Biol. 2016 Jul.

Abstract

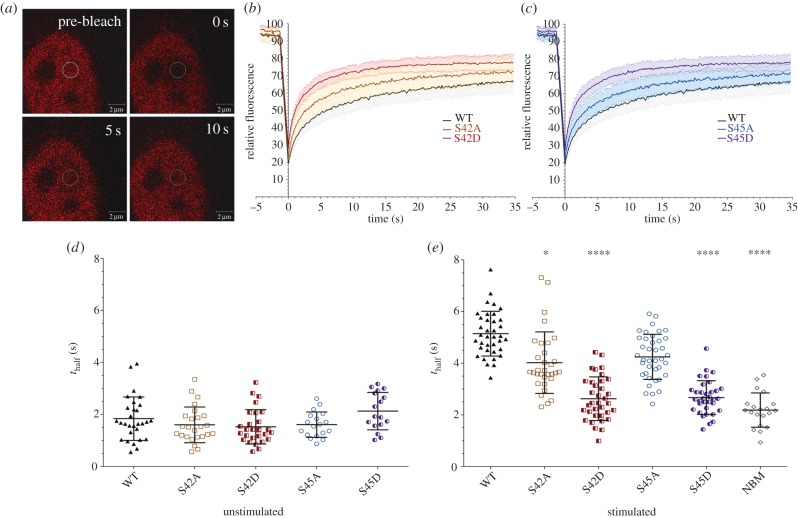
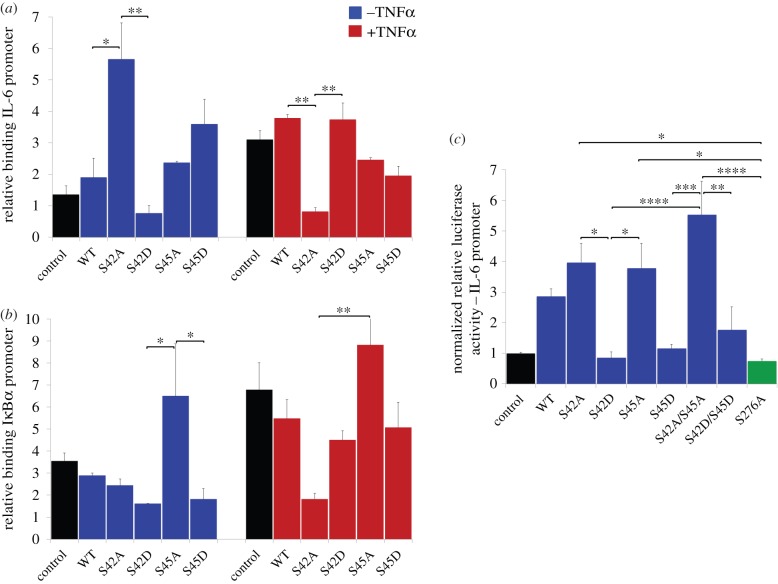
The NF-κB signalling module controls transcription through a network of protein kinases such as the IKKs, as well as inhibitory proteins (IκBs) and transcription factors including RelA/p65. Phosphorylation of the NF-κB subunits is critical for dictating system dynamics. Using both non-targeted discovery and quantitative selected reaction monitoring-targeted proteomics, we show that the cytokine TNFα induces dynamic multisite phosphorylation of RelA at a number of previously unidentified residues. Putative roles for many of these phosphorylation sites on RelA were predicted by modelling of various crystal structures. Stoichiometry of phosphorylation determination of Ser45 and Ser42 revealed preferential early phosphorylation of Ser45 in response to TNFα. Quantitative analyses subsequently confirmed differential roles for pSer42 and pSer45 in promoter-specific DNA binding and a role for both of these phosphosites in regulating transcription from the IL-6 promoter. These temporal dynamics suggest that RelA-mediated transcription is likely to be controlled by functionally distinct NF-κB proteoforms carrying different combinations of modifications, rather than a simple 'one modification, one effect' system.

Keywords: NF-κB; RelA; phosphorylation; proteomics; quantification; transcription.


Figures

Figure 1.
Figure 1.
TNFα induces dynamic multi-site phosphorylation of endogenous RelA. (a) Phosphorylation sites identified at 5, 20, 40, 60 min post-stimulation of SK-N-AS cells with the cytokine TNFα are detailed. No phosphorylation sites were observed in the absence of stimulation. CID product ion spectra of a (b) doubly charged ion at m/z 437.7, indicating phosphorylation of Ser42 and Ser45; (c) doubly charged ion at m/z 570.1, indicating phosphorylation of Ser131; (d) triply charged ion at m/z 669.7, indicating phosphorylation of Ser136; (e) doubly charged ion m/z 796.2, indicating phosphorylation of Ser261; (f) triply charged ion at m/z 769.2, indicating phosphorylation of Ser269. (g) Schematic of RelA detailing known and novel (*) sites of modification. Phosphorylation sites are in red, glycosylation sites in green; a, acetylation; m, methylation; n, nitrosylation; o, oxidation; u, ubiquitination; TA, transactivation domain. Dark grey blocks represent those regions in the primary sequence identified by shotgun LC–MS/MS analysis following proteolytic cleavage with different enzymes.
Figure 2.
Figure 2.
In vitro site-specific RelA phosphorylation is significantly increased in the presence of IκBα and/or p50. The sites identified following in vitro phosphorylation of RelA with PKA or IKKβ, either alone or in the presence of stoichiometric amounts of p50, or p50 and IκBα are detailed. (a) Qualitative phosphosite identification following discovery LC–MS/MS. (b) Selected reaction monitoring (SRM) determined relative change in phosphopeptide level compared with RelA alone. Statistical significance was assessed using a one-way ANOVA and a post hoc Tukey test; *p < 0.05, ***p < 0.001 with respect to RelA alone for each site and kinase; ###p < 0.001 with respect to RelA : p50 for each site and kinase. N.B. Relative phosphorylation cannot be directly compared between phosphopeptides and thus phosphorylation sites owing to differences in peptide ionization efficiency.
Figure 3.
Figure 3.
Structural representations of RelA. (ae) Cartoon of RelA and interfaces with specific interaction partners. Phosphorylated residues are depicted as spheres and images are coloured as follows: RelA, yellow; p50, cyan; IκBα, orange; interface residues on RelA, red or blue; novel serine phosphorylation sites, yellow; known serine phosphorylation sites, pale yellow; novel threonine phosphorylation sites, light brown; known threonine phosphorylation sites, brown. (a) Location of phosphorylation sites on RelA (from PDB ID: 1IKN [43]). (b) RelA interface with IκBα (PDB ID: 1NFI [42]). (c) Interface residues on the RelA homodimer with IκBβ (PDB ID:1K3Z [44]—IκBβ removed for clarity). (d) RelA : p50 heterodimer (PDB ID: 1LEI [45]—DNA strand removed for clarity) (e) RelA contacts with the κB DNA sequence (PDB ID: 1LEI—p50 removed for clarity).
Figure 4.
Figure 4.
Selected-reaction monitoring (SRM) of RelA phosphorylation in response to treatment of SK-N-AS cells with the cytokine TNFα. (a) List of targeted (phospho)peptides included in the SRM analysis. Sequences of peptides, including phosphorylation sites (p), are listed along with their respective precursor ion m/z values, precursor ion charge state, retention time (RT) and product ions. C represents carbamidomethylated cysteine; −98 indicates loss of H3PO4 from the precursor ion; −116 indicates loss of (H3PO4 + H2O) from precursor ion; n.d. not detected; consistently observed product ions are highlighted in bold. (Phospho)peptides containing modified residues pSer45 (b), pSer42/45 (c), pSer45* (d), pSer276 (e) and the RelA control peptide DGFYEAELCPDR, where C denotes carbamidomethylation of Cys (f) were quantified by scheduled LC–SRM analysis following stimulation of SK-N-AS cells with TNFα; stimulation and analysis was repeated in triplicate for three different biological replicates represented in black, blue and red. Isotope-labelled internal reference (phospho)peptides were included, permitting absolute peptide quantification and phosphorylation site stoichiometry determination. pSer45* is the calculated stoichiometry of the Ser45 phosphorylation site obtained by summating percentage phosphorylation of the pSer45 and pSer42/45 phosphopeptides. Immunoblot analysis of pSer42/45 (g) is shown as a function of time following TNFα stimulation with reference to total RelA levels and actin control.
Figure 5.
Figure 5.
Nuclear movement of S42/S45 phosphomimetic versions of RelA–DsRed is increased. Fluorescent recovery after photobleaching (FRAP) was used to assess nuclear movement of RelA–DsRed species (wild-type (WT), S42A, S42D, S45A, S45D) in SK-N-AS cells. Cells were unstimulated (control) or stimulated with TNFα (10 ng µl−1) for 30 min prior to bleaching of a 3.14 µm2 (2 µm diameter) region of interest (ROI). (a) Single captures of a representative SK-N-AS cell nucleus with WT RelA–DsRed: prior to bleaching and at 0, 5 and 10 s post-bleaching. Images show recovery of fluorescence into the ROI following bleaching. (b,c) Mean fluorescent recovery curves of WT, S42A/S42D (b) and S45A/S45D (c) RelA–DsRed species. Error bars represent standard deviation (σ). All curves are significantly different from one another (p < 0.0001). (d,e) Scatter dot plots of the half time to recovery, thalf (s), of individual RelA–dsRed species in the cytoplasm of unstimulated cells (d) or in the nucleus following TNFα treatment (e). NBM refers to the non-binding mutant (Y36A/E39D) of RelA. The Kruskal–Wallis test was used with a Dunn's multiple comparison test to determine statistical difference: *p < 0.1; ****p < 0.0001.
Figure 6.
Figure 6.
Ser42 and Ser45 regulate DNA binding and transcription. (a,b) SK-N-AS cells were either untransfected (control, black) or transfected with wild-type (WT) or mutant full-length RelA expression constructs. After 48 h, cells were treated with TNFα (5 ng ml−1 for 3 h) prior to cross-linking of chromatin and cell harvesting. Relative binding of RelA to the IL-6 (a) or IκBα (b) promoter was assessed by quantitative ChIP assay. (c) SK-N-AS cells were transfected with IL-6 promoter luciferase construct and co-transfected with WT or mutant full-length RelA as indicated. Cells were harvested after 48 h and luciferase assay carried out on cell lysates. Results are normalized to protein concentration; n = 3. A one-way analysis of variance (ANOVA) with a post hoc Tukey multiple comparisons test was used to probe for statistical differences: *p < 0.05, **p < 0.01, ***p < 0.001, ****p < 0.0001.

References

    1. Lawrence T. 2009. The nuclear factor NF-κB pathway in inflammation. Cold Spring Harb. Perspect. Biol. 1, a001651 (doi:10.1101/cshperspect.a001651) - DOI - PMC - PubMed
    1. Sun SC, Chang JH, Jin J. 2013. Regulation of nuclear factor-κB in autoimmunity. Trends Immunol. 34, 282–289. (doi:10.1016/j.it.2013.01.004) - DOI - PMC - PubMed
    1. DiDonato JA, Mercurio F, Karin M. 2012. NF-κB and the link between inflammation and cancer. Immunol. Rev. 246, 379–400. (doi:10.1111/j.1600-065X.2012.01099.x) - DOI - PubMed
    1. Neumann M, Naumann M. 2007. Beyond IκBs: alternative regulation of NF-κB activity. FASEB J. 21, 2642–2654. (doi:10.1096/fj.06-7615rev) - DOI - PubMed
    1. Perkins ND. 2006. Post-translational modifications regulating the activity and function of the nuclear factor κB pathway. Oncogene 25, 6717–6730. (doi:10.1038/sj.onc.1209937) - DOI - PubMed

Publication types