. 2016 Sep;146(9):1722-30.
doi: 10.3945/jn.116.230441. Epub 2016 Jul 27.

Highly Processed and Ready-to-Eat Packaged Food and Beverage Purchases Differ by Race/Ethnicity among US Households

Affiliations

Highly Processed and Ready-to-Eat Packaged Food and Beverage Purchases Differ by Race/Ethnicity among US Households

Jennifer M Poti et al. J Nutr. 2016 Sep.

Abstract

Background: Racial/ethnic disparities in dietary quality persist among Americans, but it is unclear whether highly processed foods or convenience foods contribute to these inequalities.

Objective: We examined the independent associations of race/ethnicity with highly processed and ready-to-eat (RTE) food purchases among US households. We determined whether controlling for between-group differences in purchases of these products attenuated associations between race/ethnicity and the nutritional quality of purchases.

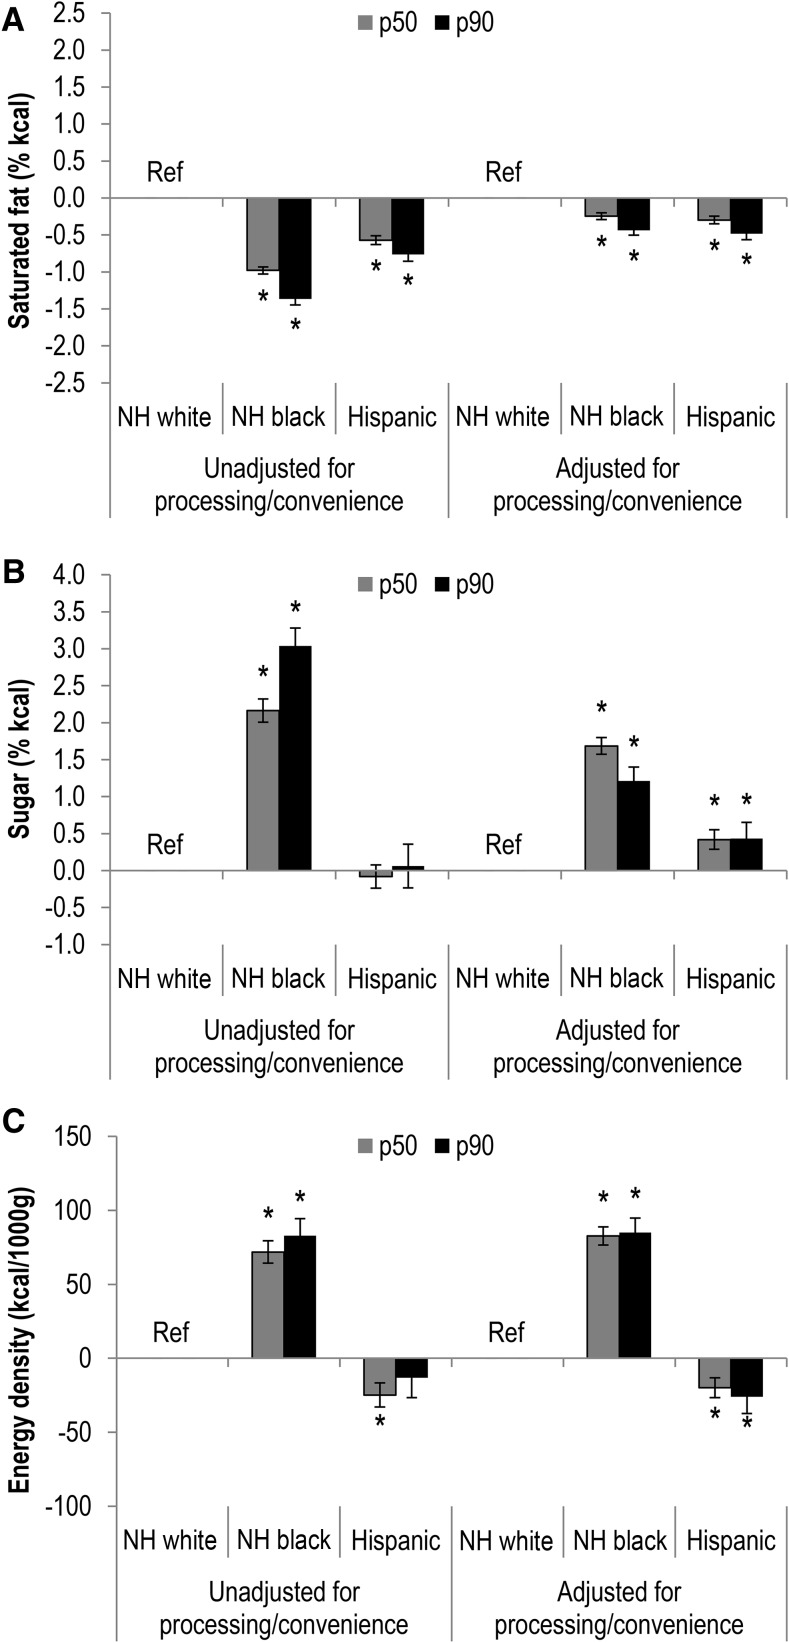
Methods: The 2000-2012 Homescan Panel followed US households (n = 157,142) that scanned their consumer packaged goods (CPG) food and beverage purchases. By using repeated-measures regression models adjusted for sociodemographic characteristics, we examined time-varying associations of race/ethnicity with processed and convenience food purchases, expressed as a percentage of calories purchased. We estimated associations between race/ethnicity and saturated fat, sugar, or energy density of total purchases with and without adjustment for processed and convenience food purchases.

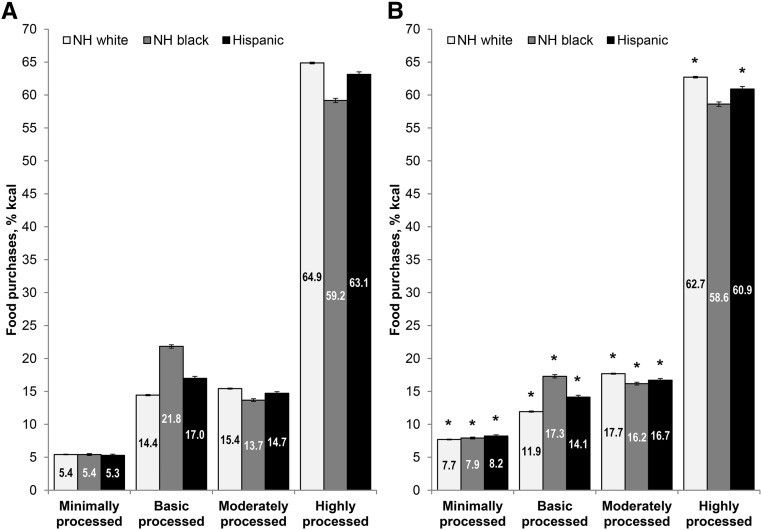
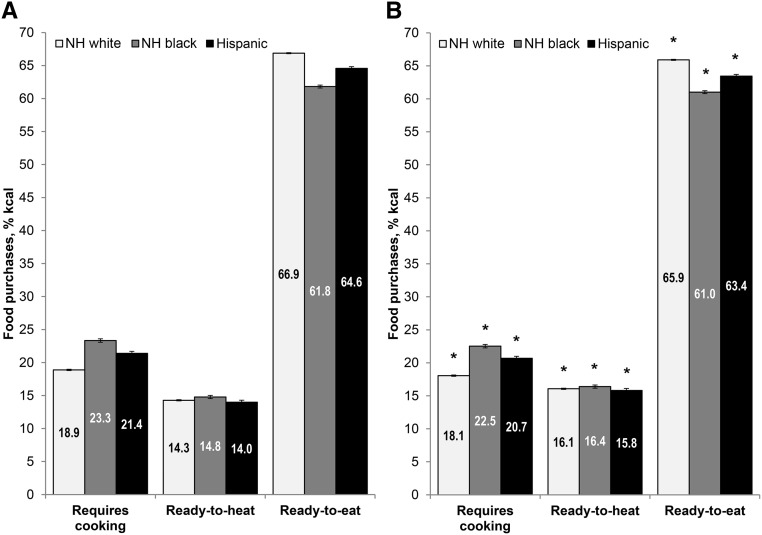
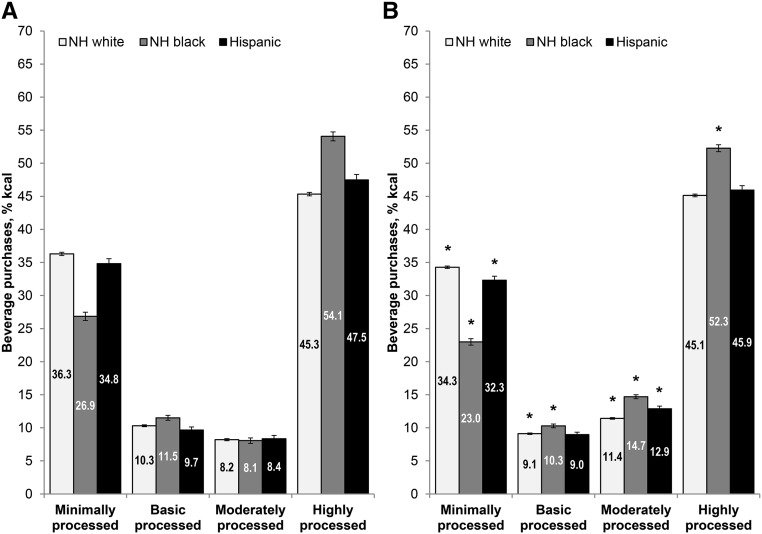
Results: Compared with white households, black households had significantly lower purchases of highly processed foods (-4.1% kcal) and RTE convenience foods (-4.9% kcal) and had higher purchases of basic processed foods, particularly cooking oils and sugar (+5.4% kcal), foods requiring cooking/preparation (+4.5% kcal), and highly processed beverages (+7.1% kcal). Hispanics also had lower purchases of highly processed and RTE foods than whites. Blacks had CPG purchases with significantly higher median sugar (+2.2% kcal) and energy density (+72 kcal/1000 g), whereas Hispanics had purchases with lower saturated fat (-0.6% kcal) and energy density (-25 kcal/1000 g) than whites. Racial/ethnic differences remained significant after adjustment for processed and convenience food purchases.

Conclusions: In our study, compared with white households, both black and Hispanic households had lower purchases of highly processed and RTE foods, yet had total CPG purchases with differing nutritional quality. Our findings suggest that highly processed convenience foods are associated with, but cannot fully explain, racial/ethnic disparities in the nutritional quality of CPG purchases.

Keywords: convenience; disparities; ethnicity; food processing; processed food; race.


Conflict of interest statement

2 Author disclosures: JM Poti, MA Mendez, SW Ng, and BM Popkin, no conflicts of interest.

Figures

FIGURE 1
FIGURE 1
Multivariable-adjusted associations between race/ethnicity and the contribution of minimally processed, basic processed, moderately processed, and highly processed foods to total calories in all CPG food purchases in 2000 (A) and 2012 (B) among US households in the Homescan Panel. Values are adjusted means (95% CIs) from longitudinal random-effects linear regression models that regress percentage of kilocalories (% kcal) from each processing category on year (dummy variables), household race/ethnicity, and the interaction of year and race/ethnicity with adjustment for educational level, household income, household composition, the number of household members in each age and sex group, geographic market, and market-level unemployment rate; n = 656,172 household year-level observations from n = 127,871 NH white, n = 14,539 NH black, and n = 11,133 Hispanic households (results for “other races/ethnicities” not shown). *Significant within-group change in % kcal from processed foods between 2000 and 2012, P < 0.001 (Wald test). CPG, consumer packaged goods; NH, non-Hispanic.
FIGURE 2
FIGURE 2
Multivariable-adjusted associations between race/ethnicity and the contribution of foods requiring cooking and/or preparation, ready-to-heat or requiring minimal preparation, and ready-to-eat to total calories in all CPG food purchases in 2000 (A) and 2012 (B) among US households in the Homescan Panel. Values are adjusted means (95% CIs) from longitudinal random-effects linear regression models that regress percentage of kilocalories (% kcal) from each convenience category on year (dummy variables), household race/ethnicity, and the interaction of year and race/ethnicity with adjustment for educational level, household income, household composition, the number of household members in each age and sex group, geographic market, and market-level unemployment rate; n = 656,172 household year-level observations from n = 127,871 NH white, n = 14,539 NH black, and n = 11,133 Hispanic households (results for “other races/ethnicities” not shown). *Significant within-group change in % kcal from convenience foods between 2000 and 2012, P < 0.001 (Wald test). CPG, consumer packaged goods; NH, non-Hispanic.
FIGURE 3
FIGURE 3
Multivariable-adjusted associations between race/ethnicity and the contribution of minimally processed, basic processed, moderately processed, and highly processed beverages to total calories in all CPG beverage purchases in 2000 (A) and 2012 (B) among US households in the Homescan Panel. Values are adjusted means (95% CIs) from longitudinal random-effects linear regression models that regress percentage of kilocalories (% kcal) from each processing category on year (dummy variables), household race/ethnicity, and the interaction of year and race/ethnicity with adjustment for educational level, household income, household composition, the number of household members in each age and sex group, geographic market, and market-level unemployment rate; n = 655,833 household year-level observations from n = 127,845 NH white, n = 14,537 NH black, and n = 11,133 Hispanic households (results for “other races/ethnicities” not shown). *Significant within-group change in % kcal from processed beverages between 2000 and 2012, P < 0.001 (Wald test). CPG, consumer packaged goods; NH, non-Hispanic.
FIGURE 4
FIGURE 4
Multivariable-adjusted differences in saturated fat (A), total sugar (B), and energy density (C) of total CPG food and beverage purchases at the 50th and 90th percentiles across racial/ethnic groups among US households in the 2000–2012 Homescan Panel; n = 655,821 household year-level observations from n = 127,843 NH white, n = 14,537 NH black, and n = 11,133 Hispanic households (results for “other races/ethnicities” not shown). Values are β-coefficients (95% CIs) from quantile regression models that regress nutrient content on year (dummy variables), household race/ethnicity, educational level, income, household composition, number of household members in each age and sex group, geographic market, and market-level unemployment rate. *Different from NH white households, P < 0.001 (Wald test). CPG, consumer packaged goods; NH, non-Hispanic; p50, 50th percentile; p90, 90th percentile; Ref, reference group.

References

    1. Flegal KM, Carroll MD, Kit BK, Ogden CL. Prevalence of obesity and trends in the distribution of body mass index among US adults, 1999–2010. JAMA 2012;307:491–7. - PubMed
    1. Ogden CL, Carroll MD, Fryar CD, Flegal KM. Prevalence of obesity among adults and youth: United States, 2011–2014. NCHS Data Brief 2015;219:1–8. - PubMed
    1. Centers for Disease Control Prevention. CDC health disparities and inequalities report—United States, 2013. MMWR Morb Mortal Wkly Rep 2013;62:1–4. - PubMed
    1. Satia JA. Diet-related disparities: understanding the problem and accelerating solutions. J Am Diet Assoc 2009;109:610–5. - PMC - PubMed
    1. Kant AK, Graubard BI. Ethnicity is an independent correlate of biomarkers of micronutrient intake and status in American adults. J Nutr 2007;137:2456–63. - PubMed

MeSH terms