. 2016 Jul 28;11(7):e0160284.
doi: 10.1371/journal.pone.0160284. eCollection 2016.

Immune Recognition of Citrullinated Proteoglycan Aggrecan Epitopes in Mice with Proteoglycan-Induced Arthritis and in Patients with Rheumatoid Arthritis

Affiliations

Immune Recognition of Citrullinated Proteoglycan Aggrecan Epitopes in Mice with Proteoglycan-Induced Arthritis and in Patients with Rheumatoid Arthritis

Adrienn Markovics et al. PLoS One. .

Abstract

Background: Rheumatoid arthritis (RA) is an autoimmune inflammatory disease affecting the joints. Anti-citrullinated protein antibodies (ACPA) are frequently found in RA. Previous studies identified a citrullinated epitope in cartilage proteoglycan (PG) aggrecan that elicited pro-inflammatory cytokine production by RA T cells. We recently reported the presence of ACPA-reactive (citrullinated) PG in RA cartilage. Herein, we sought to identify additional citrullinated epitopes in human PG that are recognized by T cells or antibodies from RA patients.

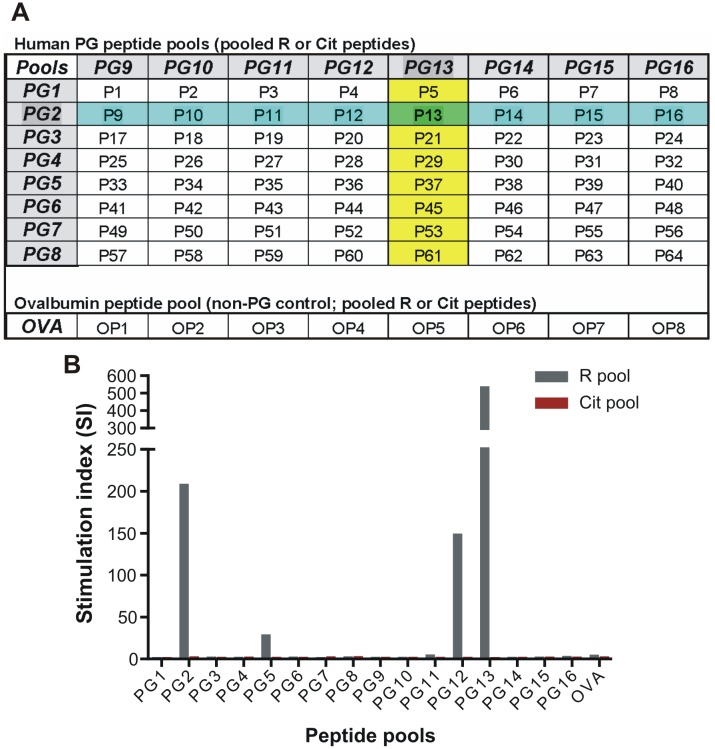
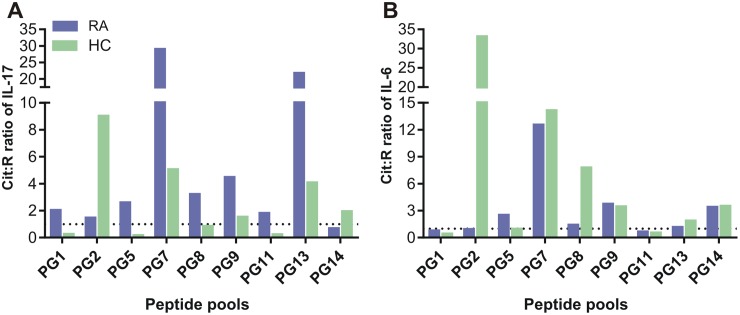
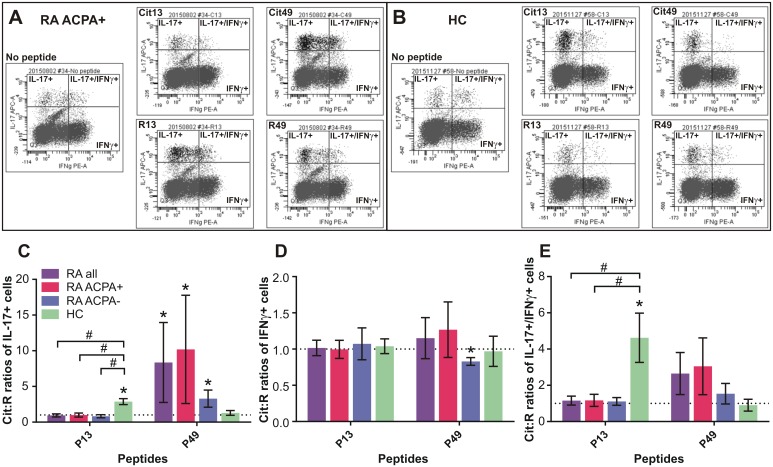
Methods: We used mice with PG-induced arthritis (PGIA) as a screening tool to select citrulline (Cit)-containing PG peptides that were more immunogenic than the arginine (R)-containing counterparts. The selected peptide pairs were tested for induction of pro-inflammatory T-cell cytokine production in RA and healthy control peripheral blood mononuclear cell (PBMC) cultures using ELISA and flow cytometry. Anti-Cit and anti-R peptide antibodies were detected by ELISA.

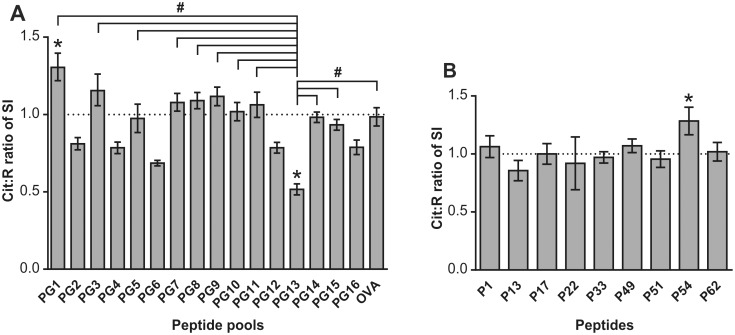
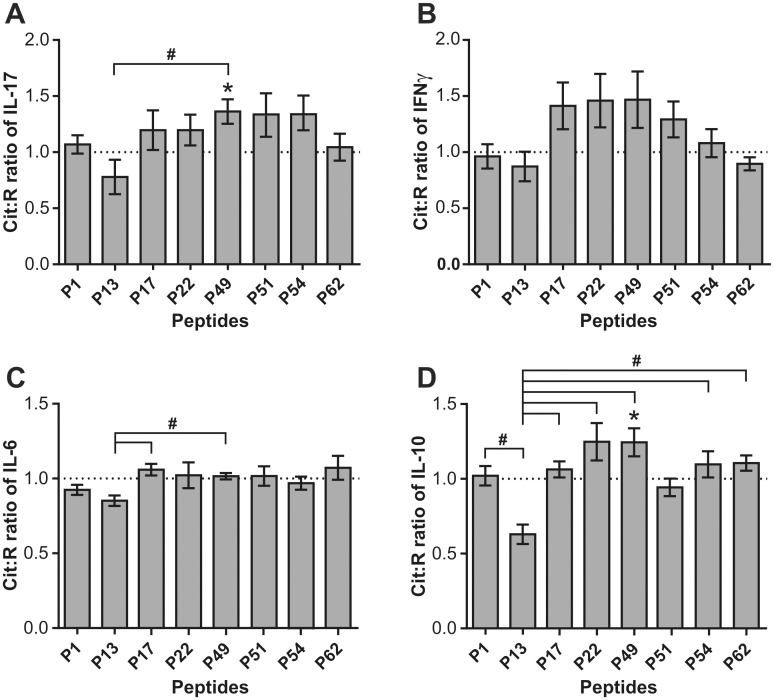
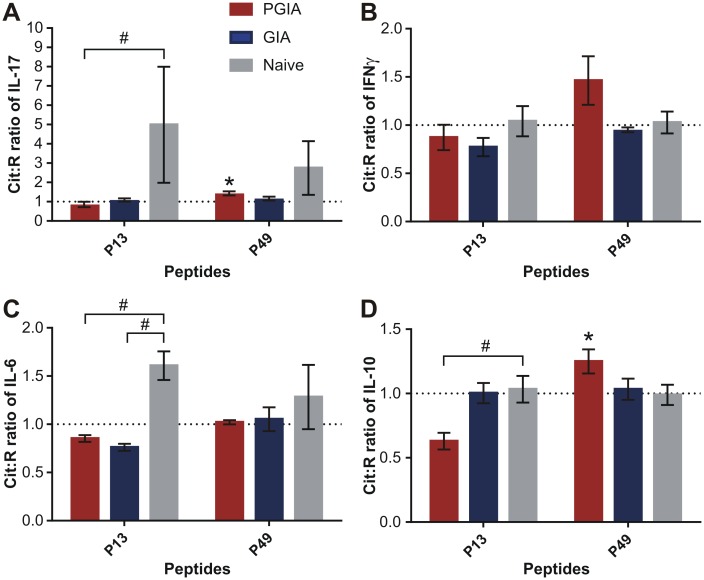
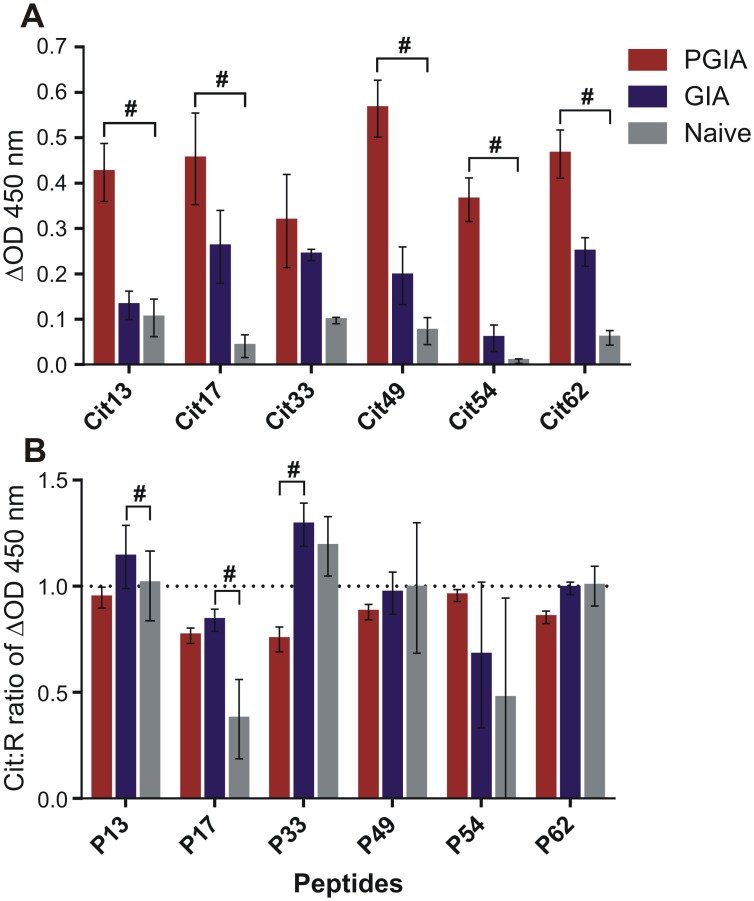
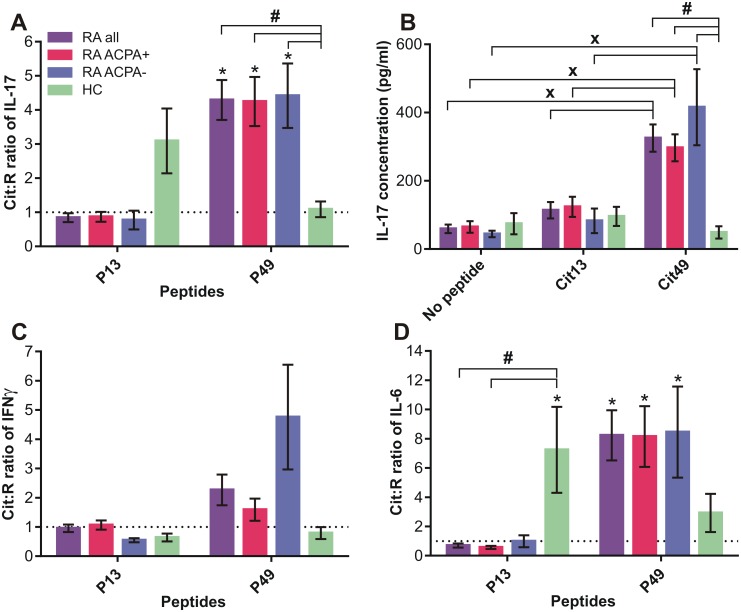
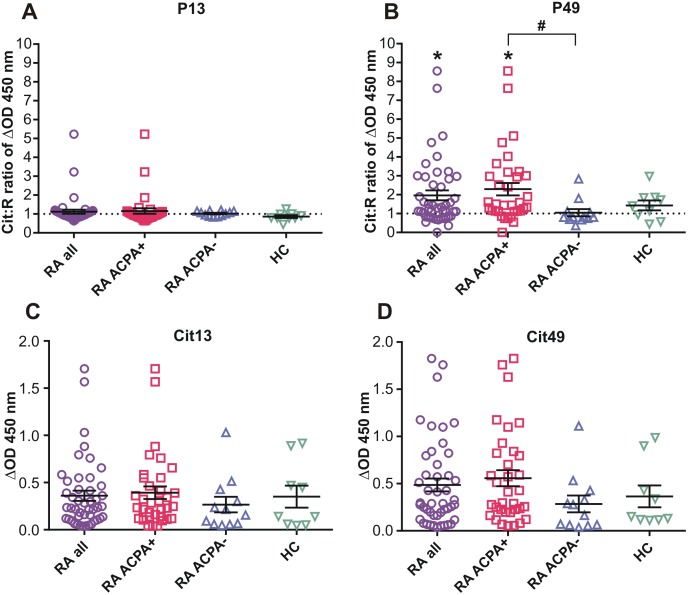
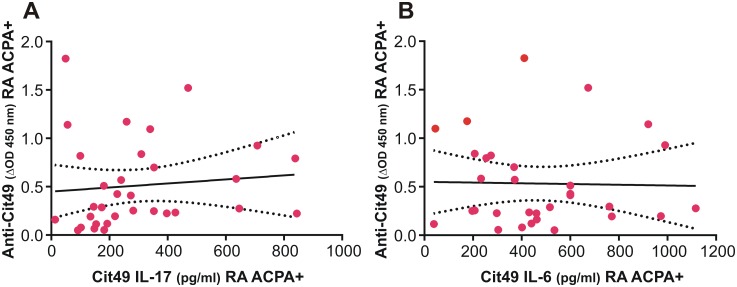
Results: Splenocytes from mice with PGIA exhibited greater T-cell cytokine secretion in response to the Cit than the R version of PG peptide 49 (P49) and anti-P49 antibodies were found in PGIA serum. PBMC from ACPA+ and ACPA- RA patients, but not from healthy controls, responded to Cit49 with robust cytokine production. High levels of anti-Cit49 antibodies were found in the plasma of a subset of ACPA+ RA patients. Another PG peptide (Cit13) similar to the previously described T-cell epitope induced greater cytokine responses than R13 by control (but not RA) PBMC, however, anti-Cit13 antibodies were rarely detected in human plasma.

Conclusions: We identified a novel citrullinated PG epitope (Cit49) that is highly immunogenic in mice with PGIA and in RA patients. We also describe T-cell and antibody reactivity with Cit49 in ACPA+ RA. As citrullinated PG might be present in RA articular cartilage, Cit PG epitope-induced T-cell activation or antibody deposition may occur in the joints of RA patients.


Conflict of interest statement

Competing Interests: The authors have declared that no competing interests exist.

Figures

Fig 1
Fig 1. Illustration and validation of the peptide pooling strategy.
(A) Arginine (R) and citrulline (Cit)-containing peptide pairs representing human proteoglycan (PG) sequences (S1 Table) were sorted into 16 pairs of PG peptide pools (PG1-16), with each pair containing 8 individual R or Cit peptides. Each individual R or Cit peptide was represented in 2 different R or Cit pools. For example, R-Cit peptide pair 13 (P13, highlighted in green) is represented in both the PG2 R-Cit pools (highlighted in blue) and the PG13 R-Cit pools (highlighted in yellow). Eight R- and 8 corresponding Cit peptide pairs (OP1-8) representing chicken egg ovalbumin were used as non-PG peptide controls and were pooled in an R and a corresponding Cit pool (OVA). (B) The PG peptide pooling strategy was validated using spleen cells from PG-specific T-cell receptor transgenic (PG-TCR tg) mice. T cells of PG-TCR tg mice recognize the R version of the P13 peptide. As shown by the stimulation index (SI) of cell proliferation, PG-TCR tg cells (mixed from 2 spleens) proliferated vigorously in the presence of R pools of PG2 and PG13 and to a lesser extent, in the presence of the R pool of PG12 containing the R version of peptide P12 (having 80% overlap with the R version of peptide P13). The cells did not recognize the Cit pools of PG2 and PG13 or any other peptide pool not containing the R version of P13 or P12. SI was calculated as described in the Methods. Data shown are the mean SI of cells in triplicate wells.
Fig 2
Fig 2. Proliferation of spleen cells from mice with PG-induced arthritis (PGIA) in response to stimulation with peptide pools and individual peptides.
Spleen cells from mice with PGIA were cultured with (A) Cit and R pairs of PG or OVA peptide pools or (B) Cit and R pairs of selected individual peptides (P) in triplicate wells. The Cit:R ratio of SI was calculated as described in the Methods. Data are expressed as the mean of Cit:R ratio of SI±SEM (n = 12 mice). Equal response to the Cit and R version of a peptide pool or peptide (theoretical Cit:R ratio of 1.0, at which no preference for the Cit or R version is assumed) is indicated with a dotted line. Statistical analysis was performed using Wilcoxon signed rank test (*p<0.05: Cit:R ratio vs 1.0) and Kruskal-Wallis test followed by Dunn’s multiple comparison test (#p<0.05: Cit:R ratio of PG13 vs Cit:R ratio of any other peptide pool).
Fig 3
Fig 3. Cit:R ratios of cytokine concentrations in culture supernatants of peptide-stimulated spleen cells from mice with PGIA.
Concentrations of cytokines IL-17, IFNγ, IL-6, and IL-10 in 4-day culture supernatants were measured by ELISA. Data are shown as the mean of Cit:R ratios±SEM for the concentrations of (A) IL-17, (B) IFNγ, (C) IL-6, and (D) IL-10. Cit:R ratio of 1.0 is indicated with a dotted line. Wilcoxon signed rank test was used to identify Cit:R ratios significantly higher than 1.0 (preference for a Cit pool or peptide) (*p<0.05; n = 10 mice). Cit:R ratio of the P13 pair-induced vs Cit:R ratio of any other peptide pair-induced production of cytokines in the same cultures was compared using Kruskal-Wallis test followed by Dunn’s multiple comparison test (#p<0.05).
Fig 4
Fig 4. Cit:R ratios of IL-17, IFNγ, IL-6, and IL-10 concentrations in peptide-stimulated culture supernatants of spleen cells from mice with PGIA or G1 domain-induced arthritis (GIA) or from naïve mice.
Data are shown as the mean of Cit:R ratios±SEM for the concentrations of (A) IL-17, (B), IFNγ, (C) IL-6, and (D) IL-10 in peptide-treated spleen cell cultures from mice with PGIA (red bars) or GIA (blue bars) or from non-arthritic naïve mice (gray bars) (PGIA n = 10 mice; GIA n = 5 mice; Naïve n = 3 mice). Cit:R ratio of 1.0 is indicated by a dotted line in each graph. Wilcoxon signed rank test was used to identify Cit:R ratios significantly higher than 1.0 (*p = <0.05: Cit:R ratio vs 1.0). Cit:R ratios of cytokines induced by the P13 and P49 pairs of peptides in cells from the 3 groups of mice were compared using Kruskal-Wallis test followed by Dunn’s multiple comparison test (#p<0.05: PGIA or GIA vs naïve mice). Average net concentrations of IL-17 in the cell cultures stimulated with the Cit version of P13 (Cit13) were as follows: 86.4 pg/ml in the PGIA group, 70.5 pg/ml in the GIA group, and 76.8 pg/ml in the naïve group (graphs not shown). In the Cit49-stimulated cultures, the average net amounts of IL-17 were: 136.9 pg/ml in the PGIA group, 60.8 pg/ml in the GIA group, and 29.8 pg/ml in the naïve group (graphs not shown).
Fig 5
Fig 5. Anti-PG peptide antibodies in serum samples from mice with PGIA or GIA, or from naïve mice.
IgG antibodies reacting with Cit or R versions of 6 PG peptides were measured by ELISA using biotinylated Cit-R peptide pairs. Delta optical density at 450 nm (ΔOD 450 nm) was determined as described in the Methods. (A) Serum antibodies against the Cit versions of six PG peptides in mice with PGIA (red bars) or GIA (blue bars) or naïve mice (gray bars). Data are shown as the mean ΔOD 450 nm±SEM (PGIA n = 10 mice/peptide; GIA n = 3–5 mice/peptide; Naïve n = 3 mice/peptide). Inter-group comparisons were made using Kruskal-Wallis test followed by Dunn’s multiple comparison test (#p<0.05: PGIA vs naïve mice). (B) Cit:R ratios of peptide-specific serum antibodies from mice with PGIA or GIA and from naïve mice. Data are expressed as Cit:R ratios of ΔOD 450 nm (mean±SEM) of serum antibodies specific for the peptide pairs in the groups of mice described above. Inter-group comparisons were made as described for graph A above (#p<0.05: GIA vs naïve or PGIA vs GIA mice). A Cit:R ratio of 1.0 is indicated by a dotted line. None of the Cit:R ratios were significantly different from 1.0 as determined by Wilcoxon signed rank test.
Fig 6
Fig 6. Cit:R ratios of PG peptide pool-induced IL-17 and IL-6 concentrations in supernatans of human peripheral blood mononuclear cell (PBMC) cultures.
(A) IL-17 and (B) IL-6 concentrations in PG peptide pool-stimulated PBMC cultures of a patient with rheumatoid arthritis (RA, blue bars) and a healthy control (HC, green bars) subject were measured by ELISA as described in the Methods. Data are expressed as the mean Cit:R ratios of the indicated cytokines induced in RA and HC PBMC by Cit and corresponding R versions of 9 PG peptide pools. Cit:R ratio of 1.0 is depicted by a dotted line.
Fig 7
Fig 7. Cit:R ratios of IL-17, IFNγ, and IL-6, induced in human PBMC cultures by Cit and R pairs of P13 and P49.
(A) Cit:R ratios of IL-17 induced by the P13 and P49 peptide pairs in PBMC cultures of anti-citrullinated protein antibody positive (ACPA+) and ACPA negative (ACPA-) RA patients and HC subjects. Data are expressed as the mean±SEM of Cit:R ratios of peptide-induced IL-17 in PBMC of RA all (purple bars), RA ACPA+ (red bars), RA ACPA- (blue bars) and HC (green bars) groups. (B) Net concentrations of IL-17 in the same PBMC cultures produced in the absence of a peptide (no peptide) or in the presence of peptide Cit13 or Cit49. Data shown are the mean±SEM of IL-17 (pg/ml). Cit:R ratios of (C) IFNγ and (D) IL-6 in the P13 and P49 peptide pair-stimulated PBMC cultures were determined as described for IL-17 in panel A above. Sample numbers for IL-17 (RA all n = 42; RA ACPA+ n = 32; RA ACPA- n = 10; HC n = 8), for IFNγ (RA all n = 28; RA ACPA+ n = 22; RA ACPA- n = 6; HC n = 8), and for IL-6 (RA all n = 41; RA ACPA+ n = 31; RA ACPA- n = 10; HC n = 7). Cit:R ratio of 1.0 (in panels A, C and D) is indicated by a dotted line. Cit:R ratios of cytokines (in A, C and D) were analyzed using Wilcoxon signed rank test (*p<0.05: Cit:R ratio vs 1.0) and Kruskal-Wallis test followed by Dunn’s multiple comparison test (#p<0.05: RA groups vs HC group). For the data in panel B, inter-group and inter-peptide comparisons were made using two-way ANOVA followed by Tukey’s test (#p<0.05: RA groups vs HC group) and Shidak’s test (Xp<0.05: Cit49 vs Cit13 or no peptide).
Fig 8
Fig 8. Intracellular cytokines in CD4 cells from non-stimulated or peptide-stimulated PBMC cultures of RA patients and HC subjects.
Representative flow cytometry panels of intracellular cytokines in CD4+ cells from non-stimulated or peptide-stimulated PBMC cultures of (A) an ACPA+ RA patient and (B) a HC subject. PBMC were cultured in the absence of peptide (no peptide) or in the presence of Cit or R versions of P13 (Cit13, R13) or P49 (Cit49, R49). Cells were labeled for cell-surface CD4 and intracellular IL-17 (IL-17A) and IFNγ with fluorochrome-tagged antibodies and subjected to flow cytometry as described in the Methods. In each case, the gate was set at CD4+ cells (gate not shown) and fluorescence signals were collected in 2-dimensional dot plots. Dots in the upper left quadrants of flow panels represent CD4 cells containing IL-17, dots in the lower right quadrants are cells containing IFNγ, the upper right quadrants show cells containing both IL-17 and IFNγ, and the cells in the lower left quadrants do not contain either of these cytokines. Cit:R ratios of (C) IL-17+ cells (D) IFNγ+ cells, and (E) double IL-17/IFNγ+ cells in P13 or P49-stimulated PBMC cultures of RA and HC groups. Data are expressed as mean±SEM of Cit:R ratios of cytokine-containing cells. Sample numbers for intracellular IL-17A, IFNγ, and IL-17/IFNγ (RA all n = 34; RA ACPA+ n = 23; RA ACPA- n = 9; HC n = 8). Cit:R ratio of 1.0 is indicated by a dotted line. Cit:R ratios significantly higher or lower than 1.0 were identified by Wilcoxon signed rank test (*p<0.05: Cit:R ratio vs 1.0) and Cit:R ratios of the groups were compared using Kruskal-Wallis test followed by Dunn’s multiple comparison test (#p<0.05: RA groups vs HC group).
Fig 9
Fig 9. Antibodies reacting with P13 and P49 peptides in plasma samples from RA patients and HC subjects.
IgG antibodies reacting with Cit or R versions of P13 and P49 in the human plasma samples were detected by ELISA as described in the Methods. Cit:R ratios of (A) anti-P13 and (B) anti-P49 antibodies in plasma samples from RA and HC subjects. ΔOD 450 nm values representing plasma levels of (C) anti-Cit13 and (D) anti-Cit49 antibodies. Data shown are the mean±SEM. Sample numbers for both peptide pairs (RA all n = 46; RA ACPA+ n = 34; RA ACPA- n = 12; HC n = 9). Cit:R ratio of 1.0 is indicated by a dotted line. Statistical analysis was performed using Wilcoxon signed rank test (*p<0.05: Cit:R ratio vs 1.0) and Kruskal-Wallis test followed by Dunn’s multiple comparison test (#p<0.05: ACPA+ group vs ACPA- group).
Fig 10
Fig 10. Correlation analysis of plasma anti-Cit49 Ab levels and in vitro Cit49-specific cytokine production in ACPA+ RA patients.
(A) Analysis of correlation between anti-Cit Ab levels (ΔOD 450 nm) and Cit49-induced IL-17 (pg/ml) in PBMC culture supernatants of the RA ACPA+ group. No significant correlation was found between these parameters (r = 0.1022, R2 = 0.0105, p = 0.5777; n = 32). (B) Analysis of correlation between anti-Cit Ab levels (ΔOD 450 nm) and Cit49-induced IL-6 (pg/ml) in PBMC culture supernatants of the RA ACPA+ group revealed no significant correlation (r = -0.0225, R2 = 0.0005, p = 0.9043; n = 31). Analyses were carried out using Pearson’s correlation test and best-fit curves (black solid lines) were obtained through linear regression. Sample values are shown as red dots. The black dotted lines represent 95% confidence intervals.

References

    1. Firestein GS. Rheumatoid arthritis: Etiology and pathogeneis of rheumatoid arthritis In: Ruddy S, Harris ED, Sledge CB, Kelley WN, editors. Kelley's Textbook of Rheumatology. Philadelphia, PA: W.B.Saunders Co; 2005; pp. 996–1045
    1. Firestein GS. Evolving concepts of rheumatoid arthritis. Nature 2003; 423: 356–361. - PubMed
    1. Demoruelle MK, Deane K. Antibodies to citrullinated protein antigens (ACPAs): clinical and pathophysiologic significance. Curr Rheumatol Rep 2011; 13: 421–430 10.1007/s11926-011-0193-7 - DOI - PMC - PubMed
    1. Anzilotti C, Pratesi F, Tommasi C, Migliorini P. Peptidylarginine deiminase 4 and citrullination in health and disease. Autoimmun Rev 2010; 9: 158–160 10.1016/j.autrev.2009.06.002 - DOI - PubMed
    1. Wegner N, Lundberg K, Kinloch A, Fisher B, Malmstrom V, Feldmann M, et al. Autoimmunity to specific citrullinated proteins gives the first clues to the etiology of rheumatoid arthritis. Immunol Rev 2010; 233: 34–54 10.1111/j.0105-2896.2009.00850.x - DOI - PubMed

Publication types

MeSH terms