Comparative Study
. 2017 Apr;101(4):754-763.
doi: 10.1097/TP.0000000000001343.

Continuous Normothermic Ex Vivo Kidney Perfusion Improves Graft Function in Donation After Circulatory Death Pig Kidney Transplantation

Affiliations
Comparative Study

Continuous Normothermic Ex Vivo Kidney Perfusion Improves Graft Function in Donation After Circulatory Death Pig Kidney Transplantation

J Moritz Kaths et al. Transplantation. 2017 Apr.

Abstract

Background: Donation after circulatory death (DCD) is current clinical practice to increase the donor pool. Deleterious effects on renal graft function are described for hypothermic preservation. Therefore, current research focuses on investigating alternative preservation techniques, such as normothermic perfusion.

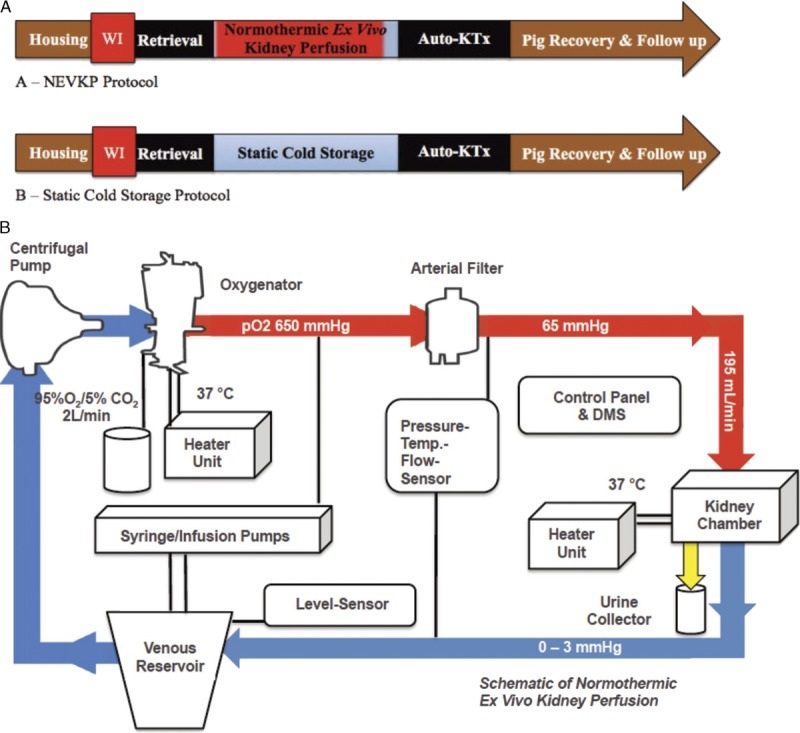
Methods: We compared continuous pressure-controlled normothermic ex vivo kidney perfusion (NEVKP) with static cold storage (SCS) in a porcine model of DCD autotransplantation. After 30 minutes of warm ischemia, right kidneys were removed from 30-kg Yorkshire pigs and preserved with 8-hour NEVKP or in 4°C histidine-tryptophan-ketoglutarate solution (SCS), followed by kidney autotransplantation.

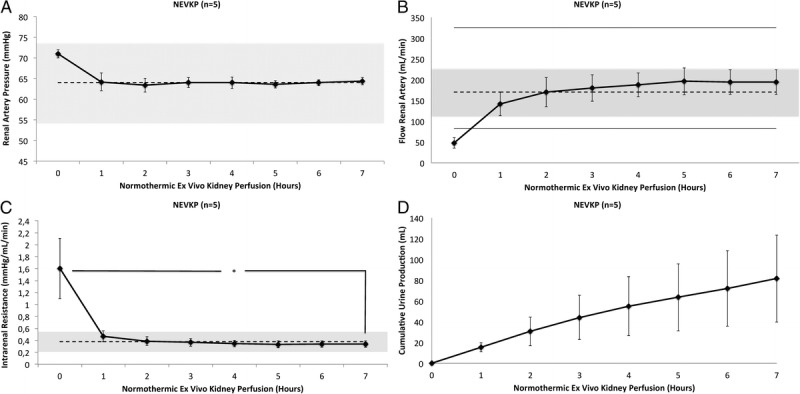
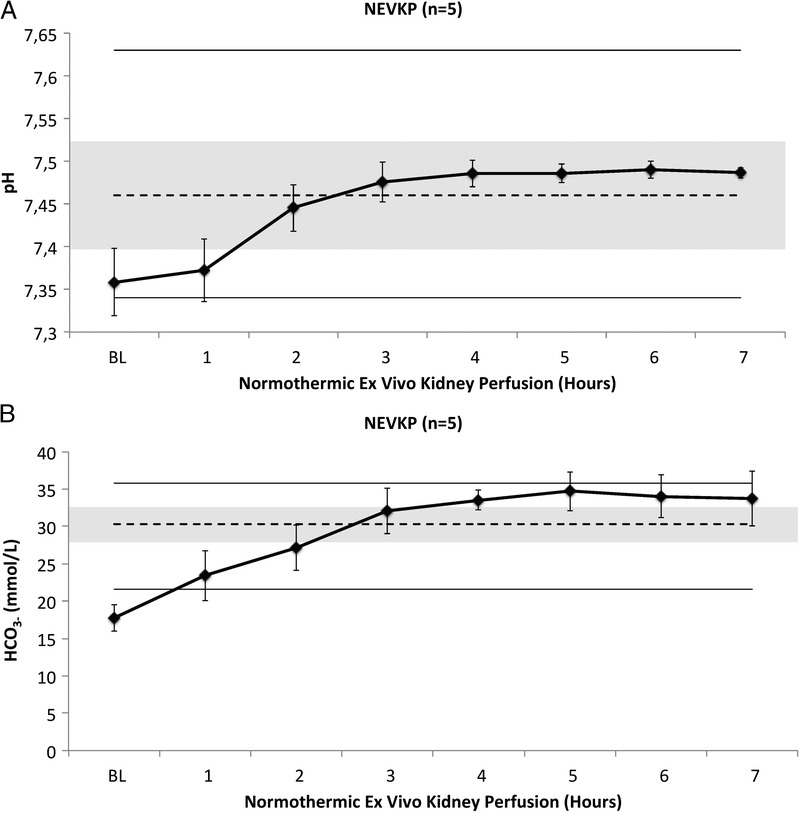
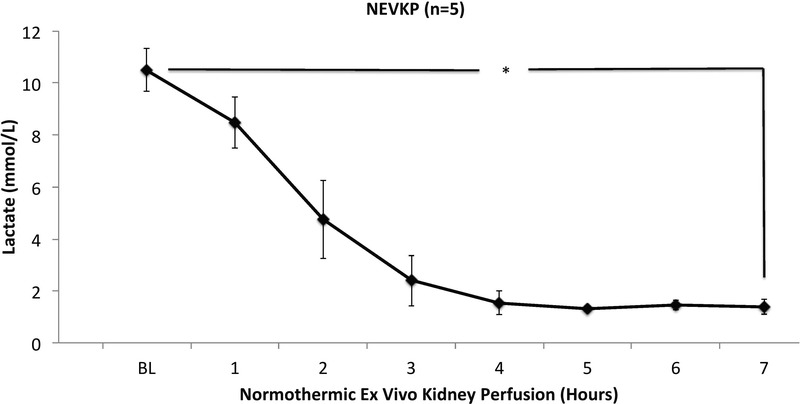
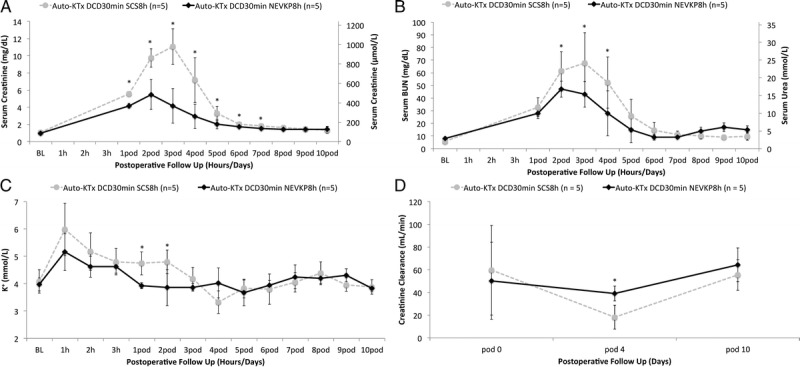
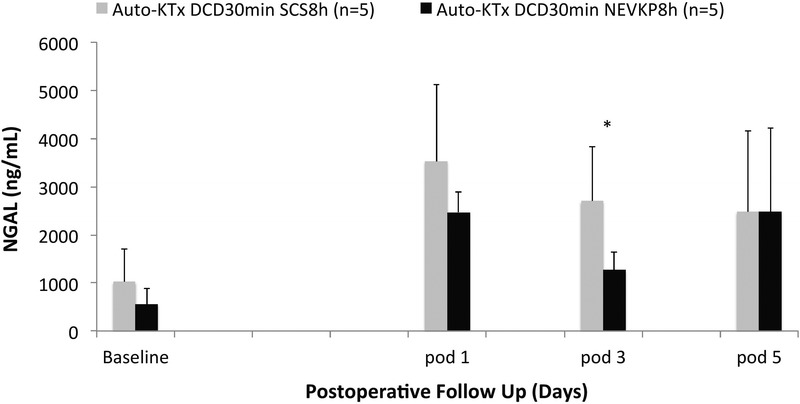
Results: Throughout NEVKP, electrolytes and pH values were maintained. Intrarenal resistance decreased over the course of perfusion (0 hour, 1.6 ± 0.51 mm per minute vs 7 hours, 0.34 ± 0.05 mm Hg/mL per minute, P = 0.005). Perfusate lactate concentration also decreased (0 hour, 10.5 ± 0.8 vs 7 hours, 1.4 ± 0.3 mmol/L, P < 0.001). Cellular injury markers lactate dehydrogenase and aspartate aminotransferase were persistently low (lactate dehydrogenase < 100 U/L, below analyzer range; aspartate aminotransferase 0 hour, 15.6 ± 9.3 U/L vs 7 hours, 24.8 ± 14.6 U/L, P = 0.298). After autotransplantation, renal grafts preserved with NEVKP demonstrated lower serum creatinine on days 1 to 7 (P < 0.05) and lower peak values (NEVKP, 5.5 ± 1.7 mg/dL vs SCS, 11.1 ± 2.1 mg/dL, P = 0.002). The creatinine clearance on day 4 was increased in NEVKP-preserved kidneys (NEVKP, 39 ± 6.4 vs SCS, 18 ± 10.6 mL/min; P = 0.012). Serum neutrophil gelatinase-associated lipocalin at day 3 was lower in the NEVKP group (1267 ± 372 vs 2697 ± 1145 ng/mL, P = 0.029).

Conclusions: Continuous pressure-controlled NEVKP improves renal function in DCD kidney transplantation. Normothermic ex vivo kidney perfusion might help to decrease posttransplant delayed graft function rates and to increase the donor pool.


Conflict of interest statement

The authors declare no funding or conflicts of interest.

Figures

FIGURE 1.
FIGURE 1.
A, Study design. Animals were housed before planned procedures. Prior to kidney recovery, a WI time of 30 minutes was applied. Renal grafts were either preserved with NEVKP (A) or SCS (B). After preservation and graft transplantation, pigs were recovered and followed up for 10 days. B, Schematic of the NEVKP circuit. The circuit consists of neonatal cardiopulmonary bypass technology. The perfusion solution is collected in the venous reservoir. A centrifugal pump propels the solution into the oxygenator, where it is enriched with oxygen and warmed to 37°C. After passing the arterial filter, the perfusate is driven with a pressure of 65 mm Hg through the renal artery into the graft located in the customized double-walled kidney chamber. The venous outflow (0-3 mm Hg) leads the perfusate back into the venous reservoir. Syringe and infusion pumps secure the supply with additional compounds. The urine is collected throughout the perfusion. Control panel and DMS indicate and record perfusion parameters continuously. DMS, Data Management System.
FIGURE 2.
FIGURE 2.
A, Renal artery blood pressure during normothermic ex vivo kidney perfusion. Values are presented as mean ± SD in mm Hg. Dashed line and grey area represent mean systemic blood pressure and SD measured invasively in situ in 30 anesthetized pigs by placing a catheter into the carotid artery. B, Renal artery flow during normothermic ex vivo kidney perfusion. Values presented as mean ± SD in mL/min Dashed line and grey area represent mean flow rate with SD measured in situ in 30 anesthetized pigs; upper and lower lines represent maximal and minimal renal artery flow rates in these pigs. The measurements were performed in control pigs following laparotomy and minimal dissection of the right renal artery with a flow probe. C, Intrarenal resistance during normothermic ex vivo kidney perfusion. Values presented as mean ± SD in mm Hg/mL per minute. Dashed line and grey area represent mean IRR with SD based on measurements performed in situ in 30 anesthetized pigs. The IRR decreased significantly over the course of perfusion (0 hour, 1.6 ± 0.51 mm Hg/mL per hour vs 7 hour, 0.34 ± 0.05 mm Hg/mL per hour, P = 0.005). D, Cumulative urine output during normothermic ex vivo kidney perfusion. Values presented as mean ± SD in mL.
FIGURE 3.
FIGURE 3.
A, pH of the perfusate during normothermic ex vivo kidney perfusion. Values presented as mean ± SD. Dashed line and grey area represent mean serum pH with SD measured in situ in 20 anesthetized pigs; upper and lower lines represent maximal and minimal pH values in these pigs. B, HCO3 concentration in the perfusate during Normothermic Ex Vivo Kidney Perfusion. Values presented as mean ± SD in mmol/L. Dashed line and grey area represent mean serum HCO3− with SD measured in situ in 20 anesthetized pigs; upper and lower lines represent maximal and minimal HCO3 values in these pigs.
FIGURE 4.
FIGURE 4.
Lactate levels in renal perfusate during normothermic ex vivo kidney perfusion. Values presented as mean ± SD in mmol/L. Perfusate lactate concentration decreased over time (0 hour, 10.5 ± 0.8 mmol/L vs 7 hour, 1.4 ± 0.3 mmol/L, P < 0.001).
FIGURE 5.
FIGURE 5.
A, Serum creatinine of the transplanted animals during 10-day postoperative follow-up for autologous kidney transplantation after SCS and NEVKP. Values presented as mean ± SD in mg/dL and μmol/L. NEVKP demonstrated significantly lower serum creatinine on postoperative days 1 to 7 (P < 0.05) and lower peak values when compared to grafts preserved at 4°C (NEVKP 5.5 ± 1.7 mg/dL vs SCS 11.1 ± 2.1 mg/dL, P = 0.002). B, Serum BUN/urea during 10-day postoperative follow-up for autologous kidney transplantation after SCS and NEVKP. Values presented as mean ± SD in mg/dL and μmol/L. Serum BUN was significantly lower in the normothermic perfused kidneys on day 2 till 4 after transplant (P < 0.05, respectively) with a significantly lower peak value of 47 ± 6.2 mg/dL versus 68 ± 24.2 mg/dL (P = 0.007). C, Serum potassium during 10-day postoperative follow-up for autologous kidney transplantation following SCS and NEVKP. Values presented as mean ± SD in mmol/L. Serum potassium levels were significantly lower on day 1 and 2 after transplant in the NEVKP versus SCS group (3.9 ± 0.1 vs 4.7 ± 0.4 mmol/L, P = 0.003, and 3.9 ± 0.7 vs 4.8 ± 0.4 mmol/L, P = 0.029). D, 24-hour creatinine clearance during 10-day postoperative follow-up. Values presented as mean ± SD in mL/min. The creatinine clearance on postoperative day 4 was increased in NEVKP versus SCS preserved kidneys (NEVKP 39 ± 6.4 mL/min vs SCS 18 ± 10.6 mL/min, P = 0.012).
FIGURE 6.
FIGURE 6.
Serum NGAL during 5-day postoperative follow-up for autologous kidney transplantation after SCS and NEVKP. Values presented in mean ± SD in ng/mL. NGAL was significantly lower at postoperative day 3 in the NEVKP versus SCS group (1267 ± 372 ng/mL vs 2697 ± 1145 ng/mL, P = 0.029).
FIGURE 7.
FIGURE 7.
A, Wedge biopsy of a normothermic preserved kidney taken 10 days after transplantation (PAS). Corticomedullary junction showing minimal to mild tubular injury (100×). B, Wedge biopsy of a hypothermic preserved kidney taken ten days after transplantation (PAS staining). Corticomedullary junction showing minimal to mild tubular injury (100×). PAS, Periodic acid-Schiff.

Comment in

References

    1. Wolfe RA, Ashby VB, Milford EL. Comparison of mortality in all patients on dialysis, patients on dialysis awaiting transplantation, and recipients of a first cadaveric transplant N Engl J Med 1999. 3411725–1730 - PubMed
    1. Tonelli M, Wiebe N, Knoll G. Systematic review: kidney transplantation compared with dialysis in clinically relevant outcomes Am J Transplant 2011. 112093–2109 - PubMed
    1. Ingsathit A, Kamanamool N, Thakkinstian A. Survival advantage of kidney transplantation over dialysis in patients with hepatitis C: a systematic review and meta-analysis Transplantation 2013. 95943–948 - PubMed
    1. Meier-Kriesche HU, Port FK, Ojo AO. Effect of waiting time on renal transplant outcome Kidney Int 2000. 581311–1317 - PubMed
    1. Rana A, Gruessner A, Agopian VG. Survival benefit of solid-organ transplant in the United States JAMA Surg 2015. 150252–259 - PubMed

Publication types

MeSH terms