. 2016 Jul 28;12(7):e1005039.
doi: 10.1371/journal.pcbi.1005039. eCollection 2016 Jul.

A Multi-scale Computational Platform to Mechanistically Assess the Effect of Genetic Variation on Drug Responses in Human Erythrocyte Metabolism

Affiliations

A Multi-scale Computational Platform to Mechanistically Assess the Effect of Genetic Variation on Drug Responses in Human Erythrocyte Metabolism

Nathan Mih et al. PLoS Comput Biol. .

Abstract

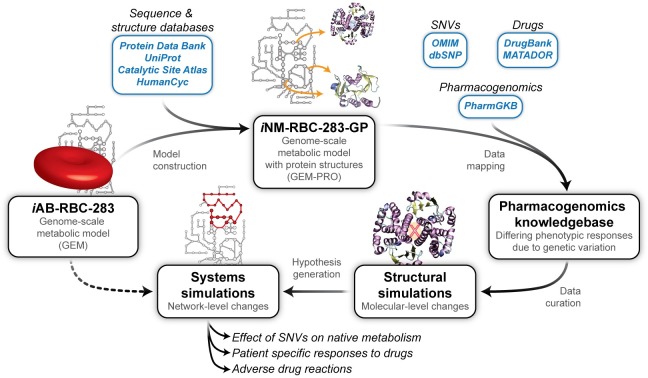
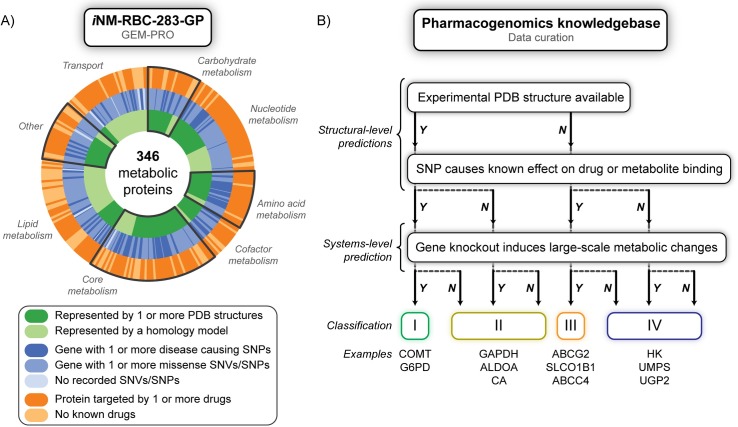
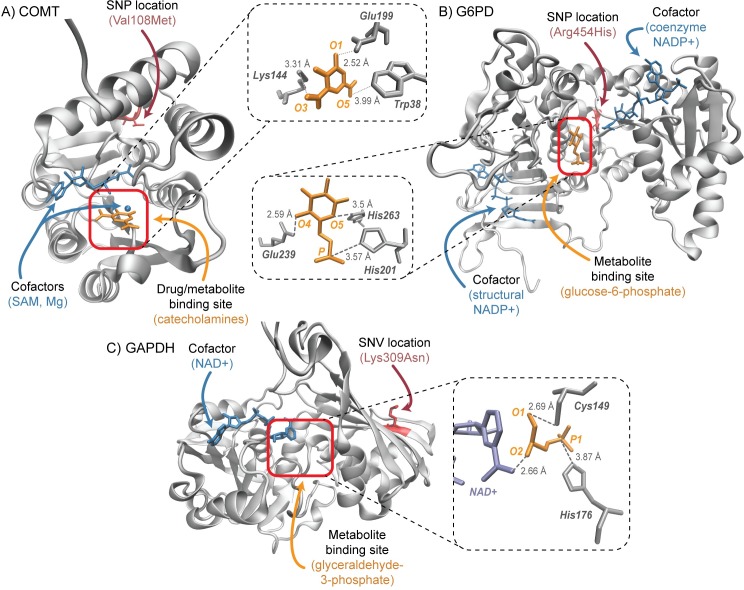
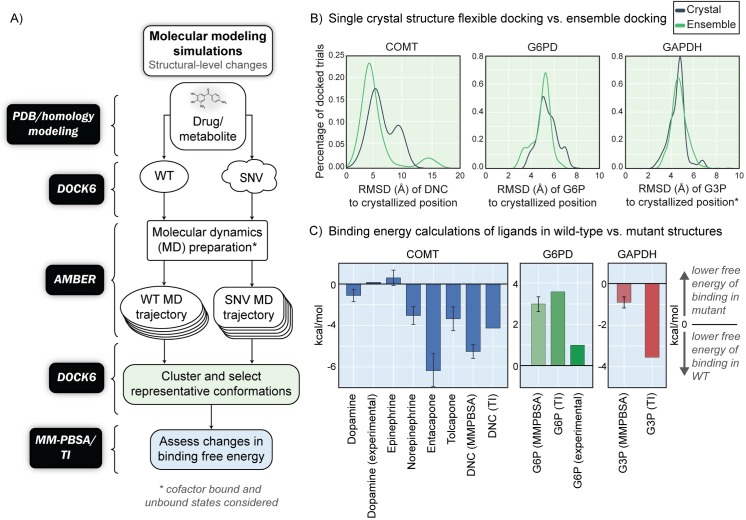
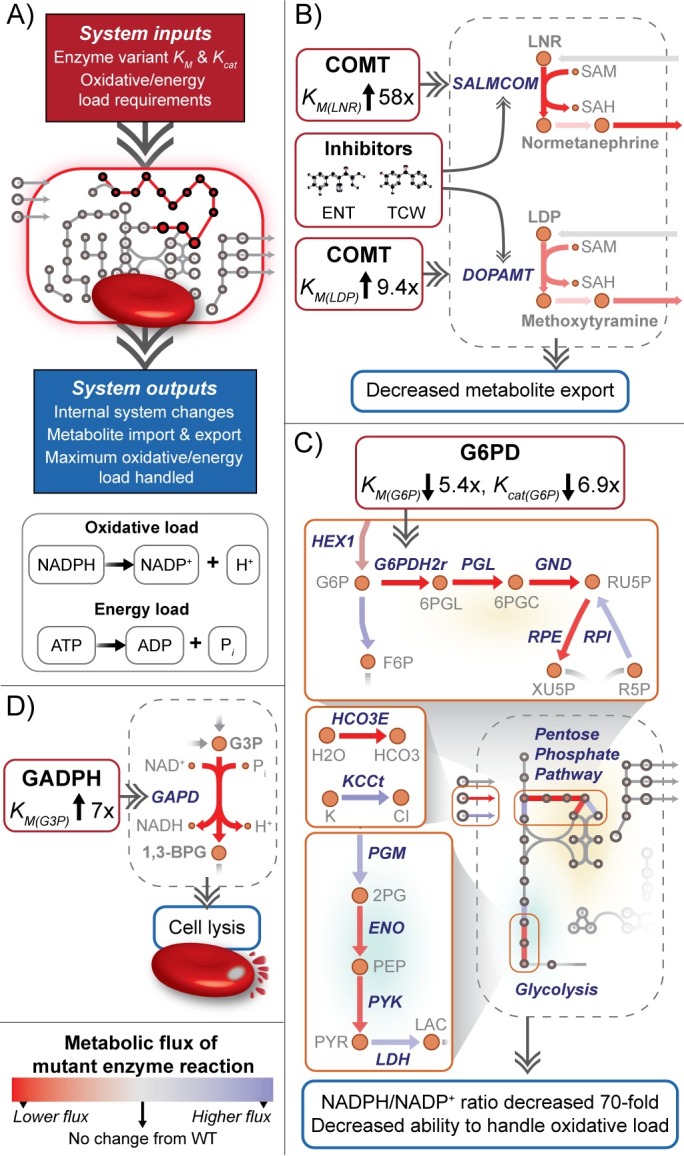
Progress in systems medicine brings promise to addressing patient heterogeneity and individualized therapies. Recently, genome-scale models of metabolism have been shown to provide insight into the mechanistic link between drug therapies and systems-level off-target effects while being expanded to explicitly include the three-dimensional structure of proteins. The integration of these molecular-level details, such as the physical, structural, and dynamical properties of proteins, notably expands the computational description of biochemical network-level properties and the possibility of understanding and predicting whole cell phenotypes. In this study, we present a multi-scale modeling framework that describes biological processes which range in scale from atomistic details to an entire metabolic network. Using this approach, we can understand how genetic variation, which impacts the structure and reactivity of a protein, influences both native and drug-induced metabolic states. As a proof-of-concept, we study three enzymes (catechol-O-methyltransferase, glucose-6-phosphate dehydrogenase, and glyceraldehyde-3-phosphate dehydrogenase) and their respective genetic variants which have clinically relevant associations. Using all-atom molecular dynamic simulations enables the sampling of long timescale conformational dynamics of the proteins (and their mutant variants) in complex with their respective native metabolites or drug molecules. We find that changes in a protein's structure due to a mutation influences protein binding affinity to metabolites and/or drug molecules, and inflicts large-scale changes in metabolism.


Conflict of interest statement

The authors have declared that no competing interests exist.

Figures

Fig 1
Fig 1. A novel workflow for advancing systems pharmacology.
Starting from the genome-scale model of human erythrocyte metabolism (iAB-RBC-283 [8]), we integrate information from sequence and structure databases, such as UniProt [40] and the Protein Data Bank (PDB) [30]. Using information from the PDB, experimental protein structures are linked to their respective encoding genes and interacting partners in the metabolic networks. Using homology modeling, representative templates are used to build structural models of target proteins when existing experimental structural information is sparse or missing. The resulting GEnome-scale model of Metabolism with PROtein structures, GEM-PRO, (referred to as iNM-RBC-283-GP), presents all of this information in a single database and can be used to generate hypotheses related to cell function in the presence of environmental perturbations. Using other external databases such as the PharmGKB [29], information about known SNPs, drug-related effects, and pharmacogenomic data is used to find promising protein targets that are characterized at the molecular level. Finally, the information gained from structural simulations (e.g. substrate docking and molecular dynamics simulations) can be used as input to guide systems modeling and test hypotheses related to drug-induced effects on metabolism.
Fig 2
Fig 2
In a), coverage of structural and pharmacogenomics information for the human erythrocyte. The metabolic network is based on 346 proteins, and each narrow slice of the pie chart represents one protein. The innermost circle represents structural coverage by an experimental structure (dark green) or by a homology model (light green). The middle circle indicates if the gene is known to contain at least one disease causing SNP (dark blue), at least one missense SNV or SNP (blue), or no recorded SNVs/SNPs (light blue). The outermost circle includes information from various drug databases, and indicates if that protein is known to be a drug or drug metabolite target (dark orange) or if no drugs target that protein (light orange). Basic subsystems of erythrocyte metabolism are highlighted as regions of the chart. For a full chart of numeric counts for each category and subsystem division see Fig C in S1 Text. In b), pharmacogenomics knowledge base generation. Our knowledge base includes information on: drugs or metabolites that are predicted to bind to/are metabolized by a protein; known associations between a drug and variation within a population; all variation sites that alter the sequence of the protein target. Targets are filtered into four classes based on if there is a protein structure available, if a SNP causes known effects on drug or metabolite catalysis or binding, and finally if the protein itself is important within the context of the import and export of metabolites in the erythrocyte from gene knockout simulations and flux variability analysis (FVA). Included at the bottom are examples of genes that match these classes of information.
Fig 3
Fig 3
a) Protein structure of COMT (WT) from PDB entry 3BWM. In orange—crystallized position of an inhibitor analog, dinitrocatechol (DNC). In blue, cofactors needed for catalysis, S-adenosyl-methionine (SAM) and magnesium (Mg). In red, the position of the SNP (contained in PDB entry 3BWY). Zoom in—shows the active site of the enzyme with the crystallized DNC bound. b) Protein structure of G6PD (WT) from PDB entry 2BH9. In orange—crystallized position of the metabolite glucose-6-phosphate (G6P). In blue, the cofactor NADP+. In red, the position of the SNP. Zoom in—shows the active site of the enzyme with G6P bound. c) Protein structure of GAPDH (WT) from PDB entry 1U8F. The orange arrow indicates the known binding site of the metabolite glyceraldehyde-3-phosphate (G3P), which was not crystallized in the experimental structure. In blue, the cofactor NAD+. In red, the position of the SNV. Zoom in—binding site interactions of G3P in E. coli PDB entry 1DC4.
Fig 4
Fig 4
a) Molecular modeling frameworks used for molecular simulations of metabolite and drug binding differences between wild-type and mutant (SNV/SNP) proteins. In the first step, docking is first carried out on experimental or modeled protein structures. From molecular dynamics simulations, an ensemble of structures is generated from the long-time sampling of conformations that cannot be studied from a single, static structure (e.g. crystallographic structure). These ensemble structures provide multiple thermodynamic states of the protein that enable docking and analysis of binding free energy estimates. The overall goal of using these molecular modeling frameworks is to quantify the relative differences in the binding affinity of metabolites and drugs to wild-type and mutant proteins. Once these differences are computed, the ratios will be used to guide systems-level simulations. b) RMSD of predicted ligand poses of DNC to the original crystallized position based on docking trials to only the crystal structure (blue) versus utilizing an ensemble of structures (green). c) Differences in binding free energies from MM-PBSA calculations in wild-type vs. mutant proteins. A negative value indicates a lower predicted binding free energy to the wild-type protein, which corresponds to a higher binding affinity.
Fig 5
Fig 5
a) Systems modeling framework used in this study. Inputs used for constraint-based and kinetic modeling are derived from molecular modeling calculations and experimental data when available. In order to understand how small-scale changes from enzyme variants affect the entire system, we look at the internal system changes (in reaction flux and metabolite concentration), differences in metabolite import & export, and how the cell handles an increase in oxidative or energy loads. Oxidative load is defined as the conversion of NADPH to NADP+, whose rate of reaction is increased under states of oxidative stress. Energy load is defined as the use of ATP. For all panels, the change in metabolic flux is colored by a difference from the wild-type flux state, red being a decreased flux in the mutant state and blue being an increased flux. b) Constraint-based modeling for the mutant COMT enzyme. The SNP is predicted to decrease the binding affinity of the enzyme in norepinephrine and dopamine metabolism. Increasing the Km (predicted) of COMT for the respective reactions leads to decreased flux and as a result decreased export of their methylated counterparts. Inhibitors tolcapone (TCW) and entacapone (ENT) are also predicted to have a lowered binding affinity to COMT, leading to similar effects. c) Kinetic modeling for the mutant G6PD enzyme. Decreases of the Km (predicted and experimental) and of the Kcat (experimental) lead to major systemic changes of the pentose phosphate pathway and glycolysis. The ratio of NADPH to NADP+ greatly decreases and subsequently the oxidative load able to be handled also decreases. d) Kinetic modeling for the mutant GAPDH enzyme. The cell is unable to handle the predicted increase in Km (predicted) and results in an infeasible state of the model, corresponding to cell lysis.

Similar articles

Cited by

References

    1. Ingelman-Sundberg M. Pharmacogenetics: an opportunity for a safer and more efficient pharmacotherapy. J Intern Med. 2001;250: 186–200. - PubMed
    1. Frueh FW, Amur S, Mummaneni P, Epstein RS, Aubert RE, DeLuca TM, et al. Pharmacogenomic biomarker information in drug labels approved by the United States food and drug administration: prevalence of related drug use. Pharmacotherapy. 2008;28: 992–998. 10.1592/phco.28.8.992 - DOI - PubMed
    1. Wedlund PJ, de Leon J. Pharmacogenomic testing: the cost factor. Pharmacogenomics J. 2001;1: 171–174. - PubMed
    1. Zielinski DC, Filipp FV, Bordbar A, Jensen K, Smith JW, Herrgard MJ, et al. Pharmacogenomic and clinical data link non-pharmacokinetic metabolic dysregulation to drug side effect pathogenesis. Nat Commun. 2015;6: 7101 10.1038/ncomms8101 - DOI - PMC - PubMed
    1. Jamshidi N, Wiback SJ, Palsson B BØ. In silico model-driven assessment of the effects of single nucleotide polymorphisms (SNPs) on human red blood cell metabolism. Genome Res. 2002;12: 1687–1692. - PMC - PubMed

Publication types