Review
. 2016 Jul 28;13(8):627-38.
doi: 10.1038/nmeth.3925.

A practical guide to photoacoustic tomography in the life sciences

Affiliations
Review

A practical guide to photoacoustic tomography in the life sciences

Lihong V Wang et al. Nat Methods. .

Abstract

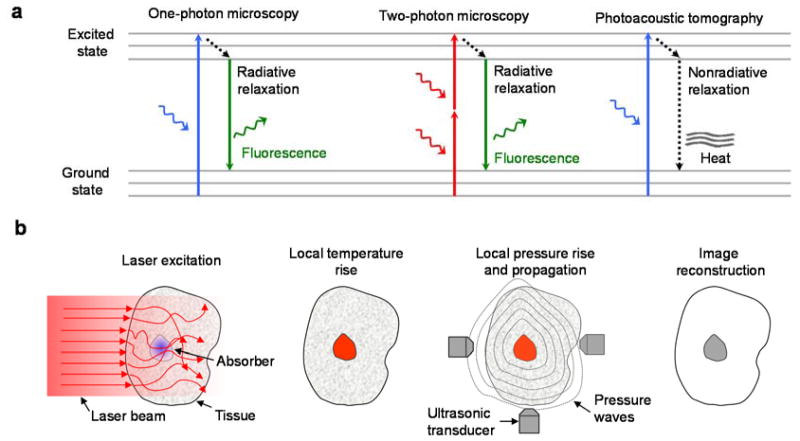
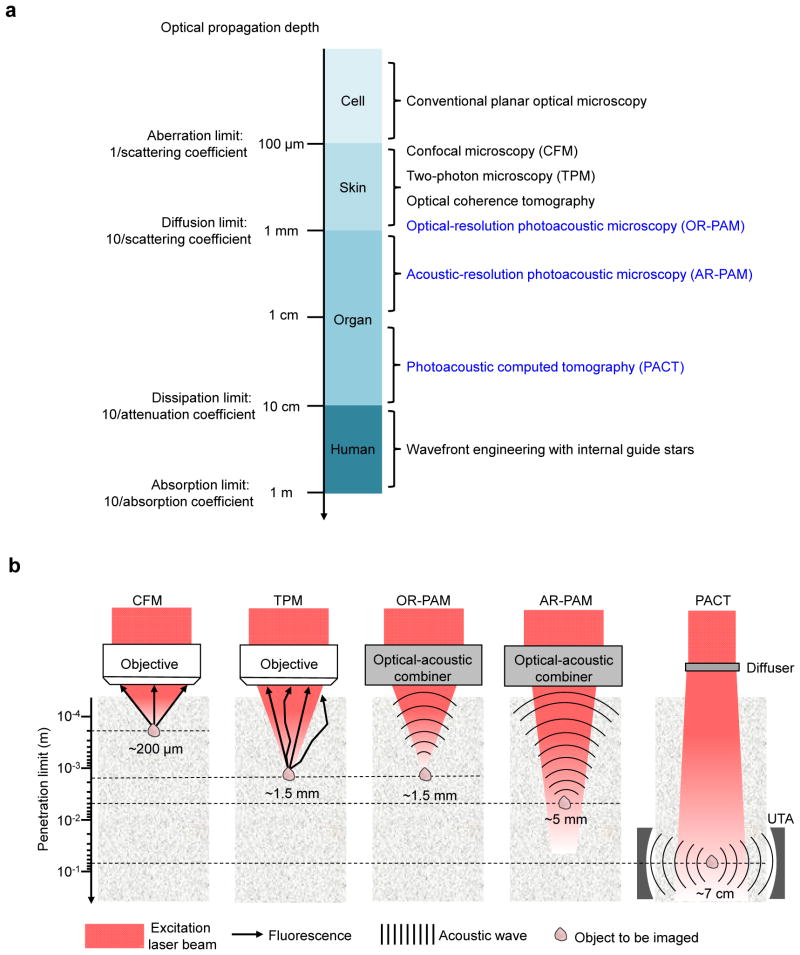
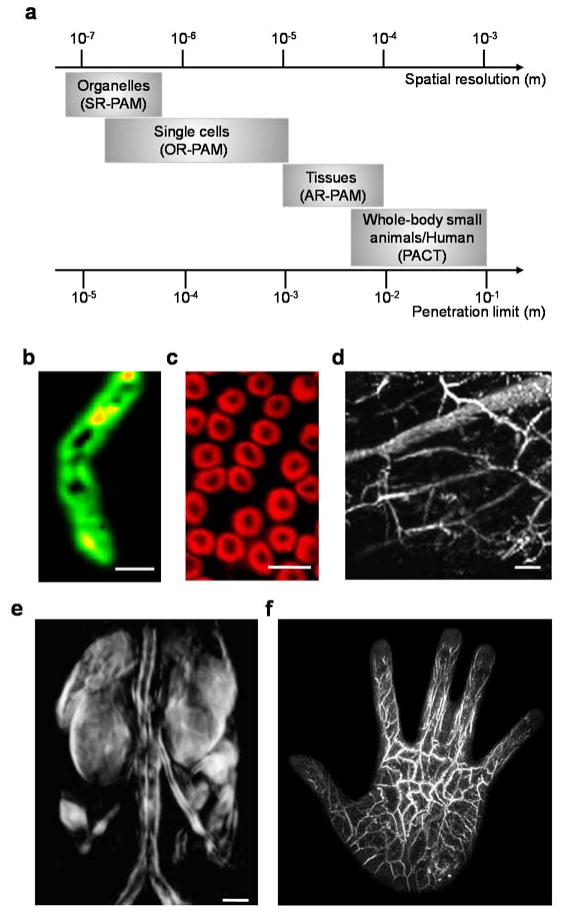
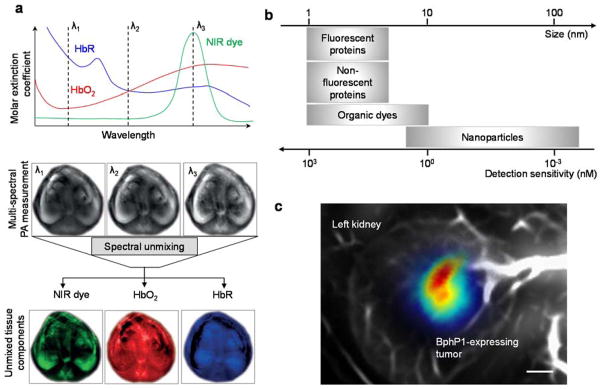
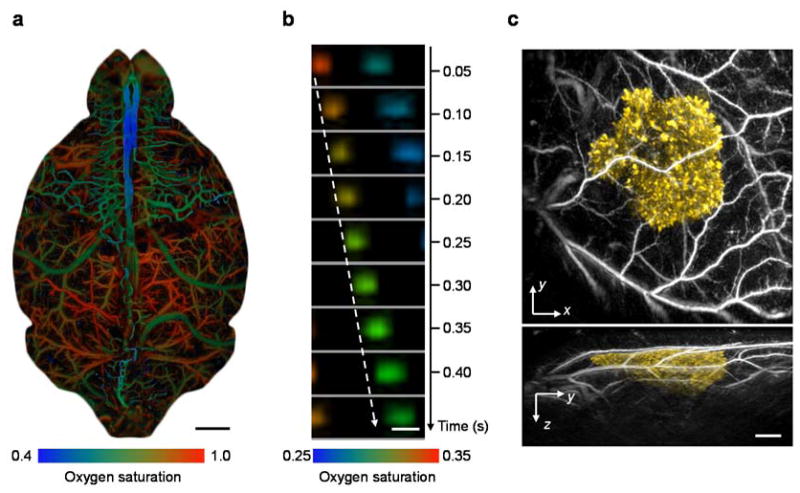
The life sciences can benefit greatly from imaging technologies that connect microscopic discoveries with macroscopic observations. One technology uniquely positioned to provide such benefits is photoacoustic tomography (PAT), a sensitive modality for imaging optical absorption contrast over a range of spatial scales at high speed. In PAT, endogenous contrast reveals a tissue's anatomical, functional, metabolic, and histologic properties, and exogenous contrast provides molecular and cellular specificity. The spatial scale of PAT covers organelles, cells, tissues, organs, and small animals. Consequently, PAT is complementary to other imaging modalities in contrast mechanism, penetration, spatial resolution, and temporal resolution. We review the fundamentals of PAT and provide practical guidelines for matching PAT systems with research needs. We also summarize the most promising biomedical applications of PAT, discuss related challenges, and envision PAT's potential to lead to further breakthroughs.


Conflict of interest statement

COMPETING FINANCIAL INTERESTS

L.V.W. has a financial interest in Microphotoacoustics, Inc., which, however, did not support this work. J.Y. declares no competing financial interests.

Figures

Figure 1
Figure 1. Principles of photoacoustic tomography (PAT)
(a) Jablonski diagram, illustrating the photon energy transfer in one-photon fluorescence microscopy, two-photon fluorescence microscopy, and PAT. The most common electronic absorption in the visible and ultraviolet spectral region is shown. (b) Imaging principle of PAT.
Figure 2
Figure 2. Representative implementations of PAT
(a) Transmission-mode OR-PAM system, where the ultrasonic transducer (UT) and the water-immersion focusing lens are on opposite sides of the object . Note that the focusing lens has a numerical aperture (NA) of 1.2 and a working distance of only ~200 μm. (b) Reflection-mode OR-PAM system with an optical-acoustic combiner that transmits light but reflects sound . SOL, silicone oil layer sandwiched between two prisms. (c) AR-PAM system with a dark-field illumination . The laser light is only weakly focused, with the UT in the dark cone. (d) PACT system with a ring-shaped ultrasonic transducer array (UTA) . The laser beam is expanded and homogenized by a diffuser to provide wide-field illumination. (e) PACT system with a linear UTA . The excitation light is delivered through a fused-end, bifurcated fiber bundle that flanks both sides of the UTA. (f) PACT system with a hemispherically shaped UTA . The UTA is rotated around the object to be imaged to provide dense spatial sampling for 3D imaging. (g) PACT system with a 2D Fabry-Perot interferometer as the acoustic sensor . The PA waves are recorded by raster scanning a probing laser beam over the surface of the interferometer. (h) Side-viewing intravascular PA catheter with an outer diameter of 1.25 mm, including the protective sheath in which the catheter rotates . Note that the acoustic coupling medium (typically water or ultrasound gel) is not shown in the schematics.
Figure 3
Figure 3. Practical guide to mapping the desired imaging depth, speed and contrast to the optimal PAT implementation
For a specific biological problem, the most suitable category of PAT implementations depends primarily on the desired imaging depth. The representative reference for each PAT implementation is indicated in the square brackets.
Figure 4
Figure 4. Photon propagation regimes in soft tissue and the penetration limits of representative high-resolution optical imaging modalities
(a) Photon propagation regimes in soft tissue and association with the penetration limits of high-resolution optical imaging modalities . The four regimes are divided approximately at photon propagation depths of 0.1 mm (aberration limit), 1 mm (diffusion limit), 10 cm (dissipation limit), and 1 m (absorption limit), with an optical absorption coefficient of 0.1 cm−1, optical scattering coefficient of 100 cm−1 and anisotropy of 0.9. The classification holds in optical scattering dominant media. Note that the penetration limits shown here are order-of-magnitude approximations. (b) Signal generation and detection in confocal microscopy (CFM), two-photon microscopy (TPM) and PAT, with different penetration limits in scattering tissue. The colors of the excitation light do not represent the true optical wavelengths.
Figure 5
Figure 5. Multiscale PAT of single cells, whole-body small animals, and humans
(a) PAT implementations with approximate spatial resolutions and penetration limits suitable for structures ranging from organelles to whole-body small animals and humans. SR-PAM, super-resolution PAM. Note that the penetration limits and spatial resolutions shown here are order-of-magnitude approximations. (b) SR-PAM image of a single mitochondrion,. Scale bar: 300 nm. (c) OR-PAM image of individual red blood cells . Scale bar: 7 μm. (d) In vivo AR-PAM image of subcutaneous vasculature of the palm of a human hand . Scale bar: 1 mm. (e) In vivo whole-body PACT image of a mouse, showing blood-rich internal organs . Scale bar: 5 mm. (f) In vivo PACT image of a human hand, showing its comprehensive vasculature. Image courtesy of Canon (Japan) (http://www.canon.com/technology/future/index.html).
Figure 6
Figure 6. In vivo PA molecular imaging
(a) PA images acquired at multiple wavelengths are combined with spectral unmixing algorithms to separate different types of optical absorbers . This example shows an NIR organic dye (shown in green) taken up by the kidneys in a mouse model, with the strong background signals from oxy-hemoglobin (HbO2, shown in red) and deoxy-hemoglobin (HbR, shown in blue). (b) Detection sensitivity of molecular probes. The detection sensitivities shown here are derived from reported results of representative contrast agents by adjusting them for both ANSI limited light fluences and 3 mm depth. (c) PACT image of a kidney tumor expressing reversibly switchable non-fluorescent bacterial phytochrome BphP1 . The tumor is shown in color, and the background blood-rich organs are shown in gray. Scale bar: 1 mm.
Figure 7
Figure 7. Representative in vivo PAT applications in life sciences
(a) Whole-cortex OR-PAM image of the oxygen saturation of hemoglobin in a mouse brain . The arteries (shown in red) and veins (shown in green) are clearly differentiated by their oxygenation levels. Scale bar: 1 mm. (b) Sequential label-free OR-PAM images of oxygen releasing in single red blood cells (RBCs) flowing in a capillary in a mouse brain . Scale bar: 10 μm. Blood flows from left to right. The dashed arrow follows the trajectory of a single flowing RBC. (c) PACT images of tyrosinase-expressing K562 tumor (shown in yellow) after subcutaneous injection into the flank of a nude mouse . The surrounding blood vessels are shown in gray. Top, x-y projection image; bottom, y-z projection image. Scale bar: 1 mm.

Similar articles

Cited by

References

    1. Bell AG. Upon the production and reproduction of sound by light. American Journal of Science. 1880;20:305–324.
    1. Bowen T. Radiation-induced thermoacoustic imaging. 4,385,634. University of Arizona Foundation; US Patent. 1983
    1. Oraevsky AA, Jacques SL, Tittel FK. In: Laser-Tissue Interaction IV. Jacques SL, Katzir A, editors. Vol. 1882. SPIE; San Jose, CA: 1993. pp. 86–101.
    1. Kruger RA, Liu PY. Photoacoustic Ultrasound - Pulse Production and Detection in 0.5-Percent Liposyn. Med Phys. 1994;21:1179–1184. - PubMed
    1. Kruger RA. Photoacoustic Ultrasound. Med Phys. 1994;21:127–131. - PubMed

Publication types