. 2016 Jul 28;12(7):e1006197.
doi: 10.1371/journal.pgen.1006197. eCollection 2016 Jul.

Temporal Shift of Circadian-Mediated Gene Expression and Carbon Fixation Contributes to Biomass Heterosis in Maize Hybrids

Affiliations

Temporal Shift of Circadian-Mediated Gene Expression and Carbon Fixation Contributes to Biomass Heterosis in Maize Hybrids

Dae Kwan Ko et al. PLoS Genet. .

Abstract

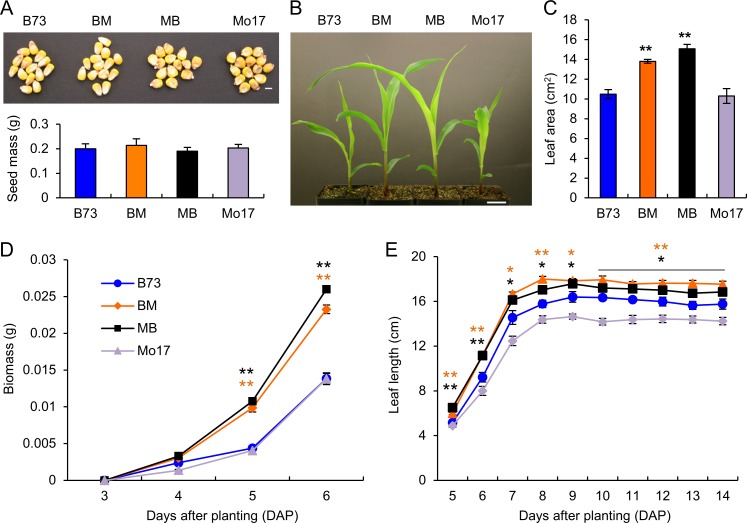
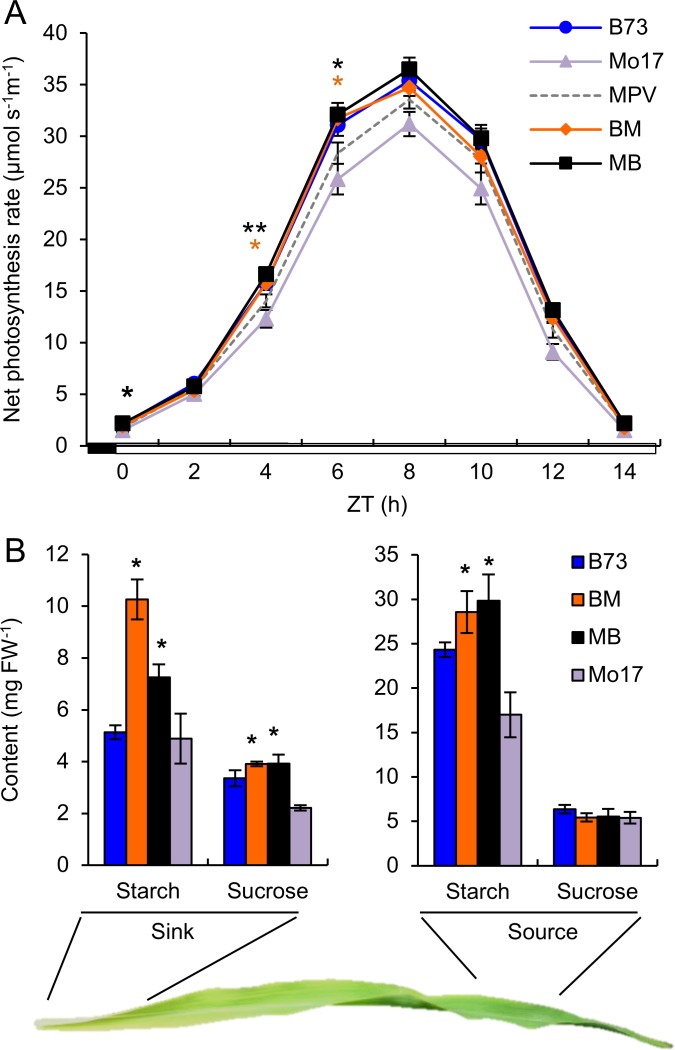
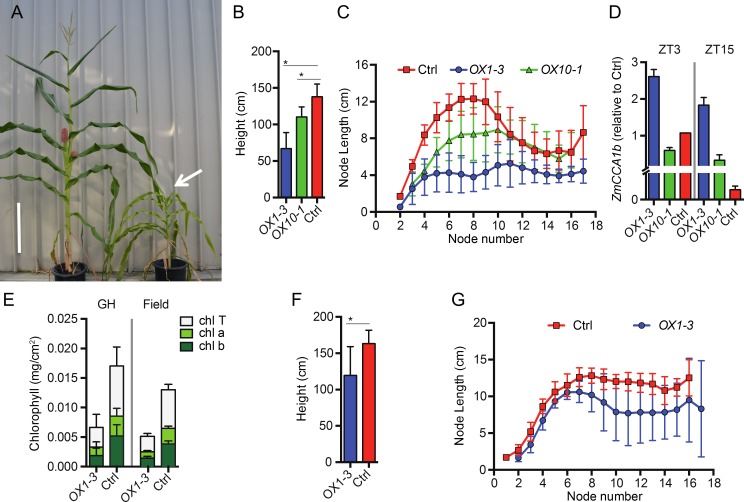
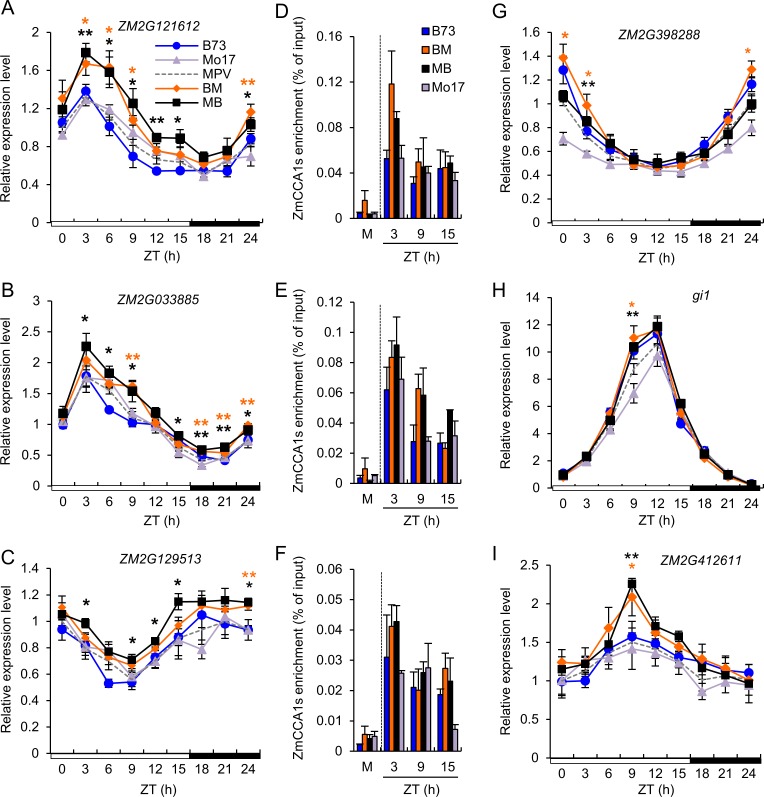
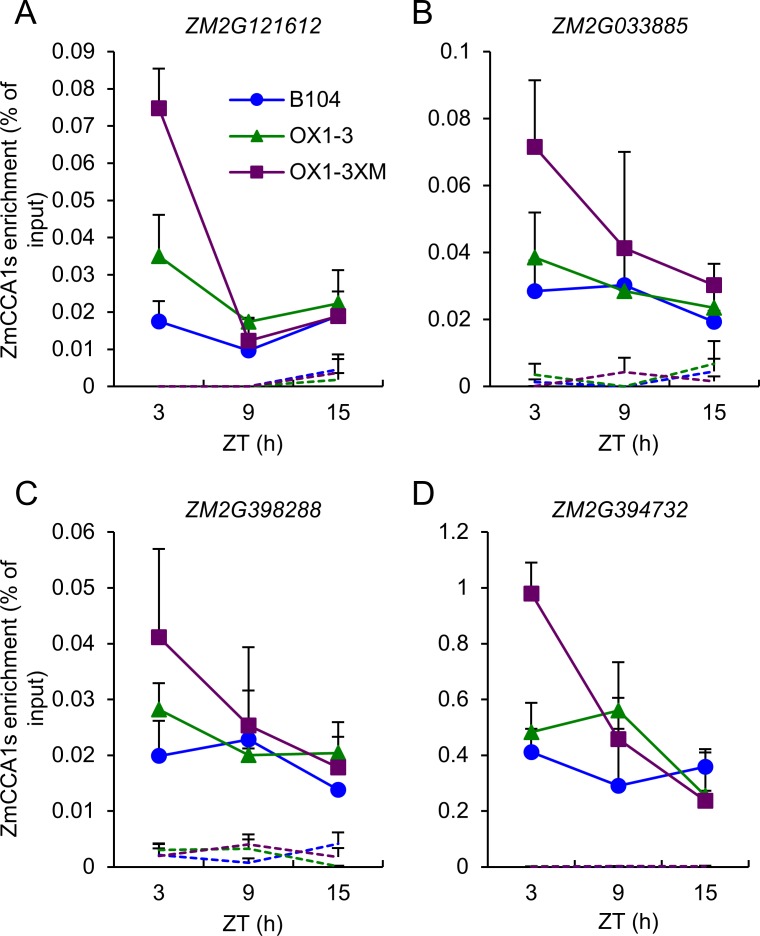
Heterosis has been widely used in agriculture, but the molecular mechanism for this remains largely elusive. In Arabidopsis hybrids and allopolyploids, increased photosynthetic and metabolic activities are linked to altered expression of circadian clock regulators, including CIRCADIAN CLOCK ASSOCIATED1 (CCA1). It is unknown whether a similar mechanism mediates heterosis in maize hybrids. Here we report that higher levels of carbon fixation and starch accumulation in the maize hybrids are associated with altered temporal gene expression. Two maize CCA1 homologs, ZmCCA1a and ZmCCA1b, are diurnally up-regulated in the hybrids. Expressing ZmCCA1 complements the cca1 mutant phenotype in Arabidopsis, and overexpressing ZmCCA1b disrupts circadian rhythms and biomass heterosis. Furthermore, overexpressing ZmCCA1b in maize reduced chlorophyll content and plant height. Reduced height stems from reduced node elongation but not total node number in both greenhouse and field conditions. Phenotypes are less severe in the field than in the greenhouse, suggesting that enhanced light and/or metabolic activities in the field can compensate for altered circadian regulation in growth vigor. Chromatin immunoprecipitation-sequencing (ChIP-seq) analysis reveals a temporal shift of ZmCCA1-binding targets to the early morning in the hybrids, suggesting that activation of morning-phased genes in the hybrids promotes photosynthesis and growth vigor. This temporal shift of ZmCCA1-binding targets correlated with nonadditive and additive gene expression in early and late stages of seedling development. These results could guide breeding better hybrid crops to meet the growing demand in food and bioenergy.


Conflict of interest statement

The authors have declared that no competing interests exist.

Figures

Fig 1
Fig 1. Growth heterosis starts at the early seedling stage.
(A) Seed morphology (upper panel) and weight (lower panel, means ± SEM) in maize inbred lines (B73 and Mo17) and their reciprocal F1 hybrids (B73XMo17, BM and Mo17XB73, MB). Scale bar = 10 mm. (B) Seedling phenotypes showing growth vigor in maize F1 hybrids. Scale bar = 10 mm. (C) Leaf area of F1 hybrids relative to the inbreds (means ± SEM, n = 10). (D) Growth curve of biomass in the maize inbreds and F1 hybrids (means ± SEM, n = 6). (E) Growth curves of leaf length in the maize inbreds and F1 hybrids (means ± SEM, n = 5). Heterosis for biomass and leaf length was observed at 5 DAP in the hybrids. Note that the earliest time to measure biomass was 3 DAP when young leaves emerged. Significant difference between hybrids and the best parent was calculated using Student’s t-test, *p-value < 0.05 and **p-value < 0.01.
Fig 2
Fig 2. Increased capacity of carbon fixation in the F1 hybrids relative to the inbreds.
(A) Diurnal rhythms of net photosynthesis rate in the maize inbreds and hybrids (means ± SEM, n = 9). (B) Starch and sucrose accumulation in sink and source regions of a mature leaf (means ± SEM, n = 3) at ZT14. FW, fresh weight. Significant difference between hybrids and MPV was calculated using Student’s t-test, *p-value < 0.05 and **p-value < 0.01.
Fig 3
Fig 3. Molecular characterization of maize CCA1 homologs.
(A and B) Relative expression levels (means ± SEM, n = 3) of ZmCCA1a (A) and ZmCCA1b (B) every 3 hours in a 24-hour period (light/dark cycle is shown below the histogram). Significant difference between hybrids and MPV was calculated using Student’s t-test, *p-value < 0.05. The relative expression level in MPV at ZT0 was set to 1. (C) Binding of recombinant ZmCCA1b (rZmCCA1b) to promoters of putative maize clock genes in vitro. Radioisotope-labeled DNA probes (endogenous promoter fragments) were incubated in the presence of MBP (1 pmol), rZmCCA1a (1 pmol), and rZmCCA1b (0.5, 1 and 2 pmol). Shifted protein-DNA complexes are indicated by the arrow. Competitors: 25X, 50X and 100X molar excess of unlabeled prompter DNA. M: DNA in which EE or CBS site was mutated; N: no EE or CBS site in the DNA fragment. Location of probes for each gene is shown below the gel image. Arrowheads represent EE or CBS site. Numbers are relative to the transcription start site (+1) and 5” UTR (grey box). (D) CAB2:LUC activity rhythms in wild-type (Col-0), Vec-1, ZmCCA1a-OX7, ZmCCA1b-OX2 and CCA1-OX2 under constant light (means ± SEM, n = 12–16). White and grey bars represent the subjective day and night, respectively. T2 plants were used in the analysis. (E) Dry aerial biomass of wild-type (Col-0), Vec-1, ZmCCA1a-OX7, ZmCCA1b-OX2 and CCA1-OX2. Dry biomass (grams) was measured 35 DAP in the diurnal conditions (means ± SEM, n = 10).
Fig 4
Fig 4. Maize transgenic plants that overexpressed ZmCCA1b (OX1-3 and OX10-1).
(A) Phenotypes of OX1-3 and control lines grown in a greenhouse (an arrow indicates the reduced height in OX1-3). Scale bar = 40 cm. (B) Height at maturity for OX1-3, OX10-1, and control plants grown in the greenhouse. (C) Measurement of node elongation for OX1-3, OX10-1, and control plants grown in the greenhouse (n = 10, ± SD). (D) Relative expression levels (to the control, Ctrl, at ZT3) of ZmCCA1b in the leaves of OX1-3 and OX1-10 transgenic plants at ZT3 and ZT15 (n = 2, ± SD). Significant difference was calculated using Student’s t-test, *p-value < 0.001. (E) Chlorophyll a (chl a), chlorophyll b (chl b), and total chlorophyll (chl T) content in leaves of OX1-3 and control plants grown in the greenhouse (GH) or field as indicted. Chlorophyll measurements for greenhouse grown and field-grown plants should not be compared since different developmental stages were tested between the two growth conditions. Greenhouse-grown plants were at stage V9 and field-grown plants were at maturity. (F) Height at maturity for OX1-3 and control plants grown in the field. Significant difference was calculated using Student’s t-test, *p-value < 0.001. (G) Measurement of node elongation for OX1-3 and control plants grown in the field (n = 10, ± SD).
Fig 5
Fig 5. ChIP-seq analysis of ZmCCA1s in the maize inbreds and F1 hybrids.
(A) De novo motif analysis of ZmCCA1-binding sites using MEME suites showed enrichment of EE, CBS, and no CBS or EE motifs. In the latter, Dof-binding motif was significantly matched in TOMTOM analysis. Percentage (p-value) is shown below each motif. (B and C) Proportion of ZmCCA1-binding peaks (B) and binding targets (C) shared in all genotypes at each time-point. Asterisks indicate statistical significance of ZT3 or ZT9 frequencies between the F1 hybrids and their parents were calculated by Fisher’s exact test. The number of peaks or genes is shown above each bar. (D) Gene Ontology (GO) classification of ZmCCA1-binding targets in each genotype at each time point by GO analysis (false-discovery rate adjusted p-value < 0.05, Hypergeometric test). GO terms associated with carbon fixation are marked by a dashed box. (E) Examples of altered temporal bindings of ZmCCA1s in F1 hybrids compared to the inbred lines. The Y-axis indicates input-subtracted read density on a same-scale for all genotypes and time-points. Arrows indicate gene orientation.
Fig 6
Fig 6. Diurnal expression of ZmCCA1-binding target (carbon fixation) genes in response to the phase-shift of ZmCCA1-binding in the hybrids.
(A-C and G) Relative expression levels (means ± SEM, n = 3) of the morning-phased carbon fixation genes, including ZM2G121612 (A), ZM2G033885 (B), ZM2G129513 (C) and ZM2G398288 (G), every 3 hours in a 24-hour period (light/dark cycle is shown below the histogram). The relative expression level in MPV at ZT0 was set to 1. Significant difference between hybrids and MPV was calculated using Student’s t-test, *p-value < 0.05 and **p-value < 0.01 (D-F) ChIP-qPCR validation of ZmCCA1s ChIP enrichments on ZM2G121612 (D), ZM2G033885 (E) and ZM2G129513 (F). M indicates the enrichment in mock samples at ZT3. The EMSA analysis confirmed ZmCCA1b-bining to the promoter of ZM2G121612, ZM2G033885 and ZM2G129513 in vitro (S9 Fig). (H-I) Relative expression levels (means ± SEM, n = 3) of the afternoon-phased genes, gi1 (H) and ZM2G412611 (I), every 3 hours in a 24-hour period (light/dark cycle is shown below the histogram). The relative expression level in MPV at ZT0 was set to 1. Significant difference between hybrids and MPV was calculated using Student’s t-test, *p-value < 0.05 and **p-value < 0.01.
Fig 7
Fig 7. Temporal shift of ZmCCA1-binding to target (carbon fixation) genes in ZmCCA1b overexpression line (OX1-3) and F1 hybrids.
(A-D) ChIP-qPCR assays were performed on ZmCCA1-binding target genes in B104, OX1-3 and F1 hybrid (OX1-3XMo17) lines in four target genes, ZM2G121612 (A), ZM2G033885 (B), ZM2G398288 (C), and ZM2G394732 (D). ChIP-qPCR values are represented relative to the corresponding input values (means ± SEM, n = 2–3). Dash lines represent ChIP-qPCR data from control (mock) samples.
Fig 8
Fig 8. A phase-shift model for heterosis.
ZmCCA1-regulatory networks orchestrate multiple biological pathways for growth heterosis, which is established at early stage and subsequently maintained during the seedling development. The altered temporal binding of ZmCCA1s to carbon fixation genes in F1 hybrids, which causes nonadditive gene expression, increasing carbon fixation capacity and leading to heterosis. At the stage of maintenance, additive gene expression of the carbon fixation genes is predominant in the hybrids, suggesting a developmental coordination of additive and nonadditive gene expression for growth heterosis. Phase distributions of ZmCCA1-bindings are shown in orange for F1 hybrids and in blue for the inbreds.

Similar articles

Cited by

References

    1. Schnable PS, Springer NM. Progress toward understanding heterosis in crop plants. Annu Rev Plant Biol. 2013;64:71–88. Epub 2013/02/12. 10.1146/annurev-arplant-042110-103827 . - DOI - PubMed
    1. Duvick DN. Biotechnology in the 1930s: the development of hybrid maize. Nat Rev Genet. 2001;2(1):69–74. . - PubMed
    1. Birchler JA, Yao H, Chudalayandi S, Vaiman D, Veitia RA. Heterosis. Plant Cell. 2010;22(7):2105–12. Epub 2010/07/14. tpc.110.076133 [pii] 10.1105/tpc.110.076133 - DOI - PMC - PubMed
    1. Goff SA. A unifying theory for general multigenic heterosis: energy efficiency, protein metabolism, and implications for molecular breeding. New Phytol. 2011;189(4):923–37. Epub 2010/12/21. 10.1111/j.1469-8137.2010.03574.x . - DOI - PubMed
    1. Chen ZJ. Genomic and epigenetic insights into the molecular bases of heterosis. Nat Rev Genet. 2013;14(7):471–82. Epub 2013/06/12. 10.1038/nrg3503 . - DOI - PubMed

Publication types