. 2016 Jul 28;11(7):e0160022.
doi: 10.1371/journal.pone.0160022. eCollection 2016.

Influence of Repressive Histone and DNA Methylation upon D4Z4 Transcription in Non-Myogenic Cells

Affiliations

Influence of Repressive Histone and DNA Methylation upon D4Z4 Transcription in Non-Myogenic Cells

Sunny Das et al. PLoS One. .

Abstract

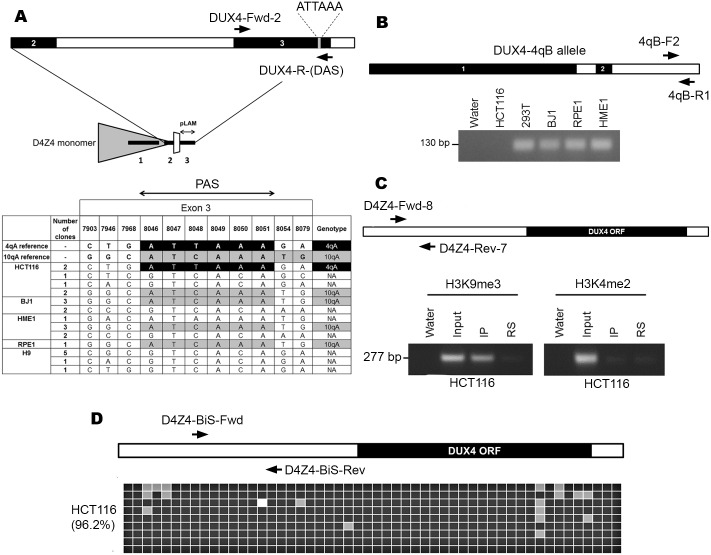
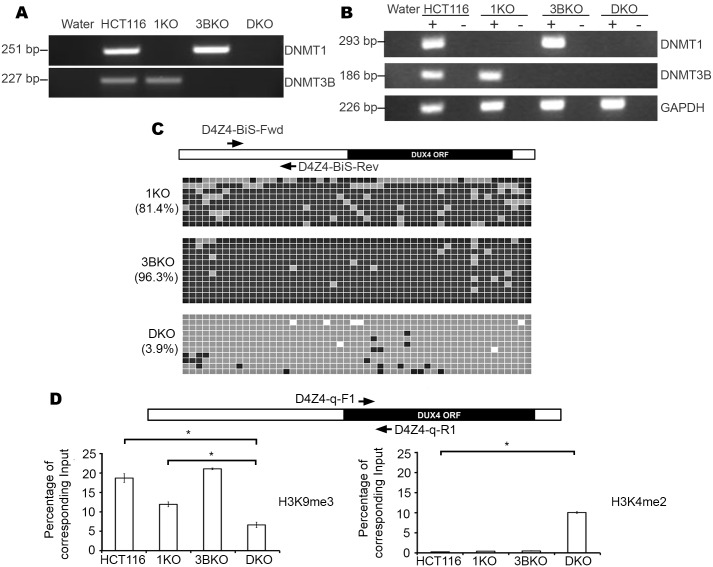
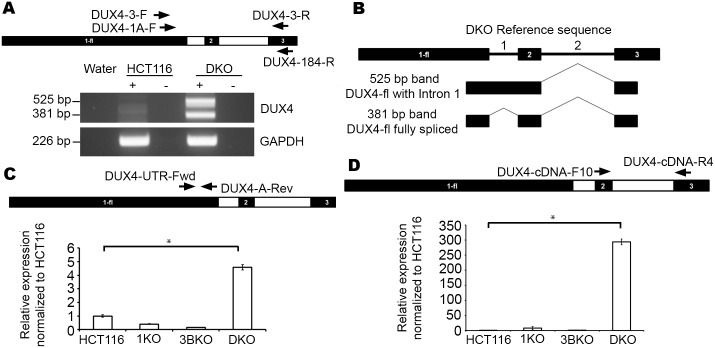
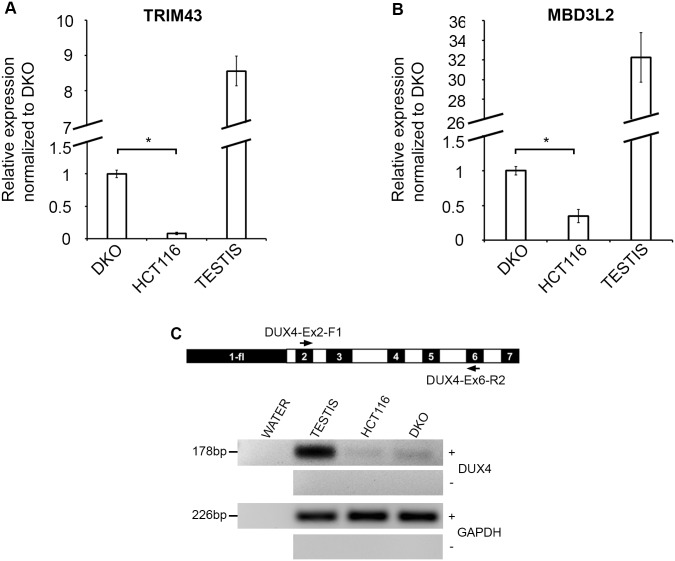
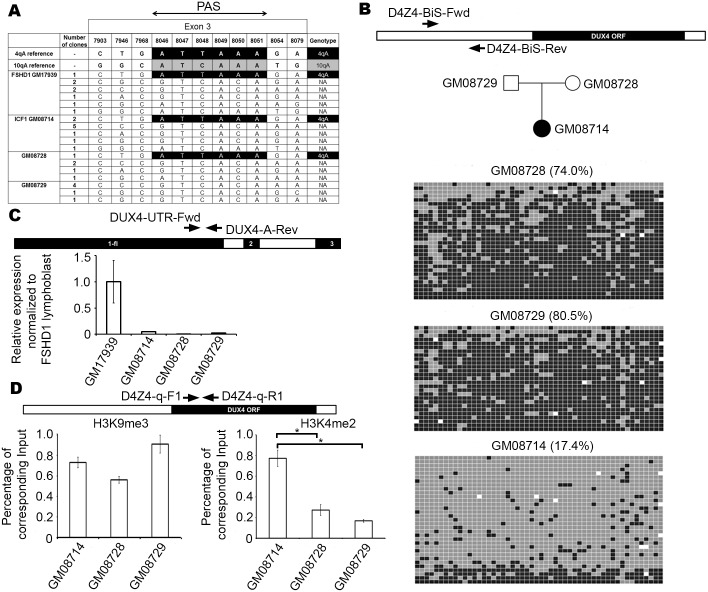
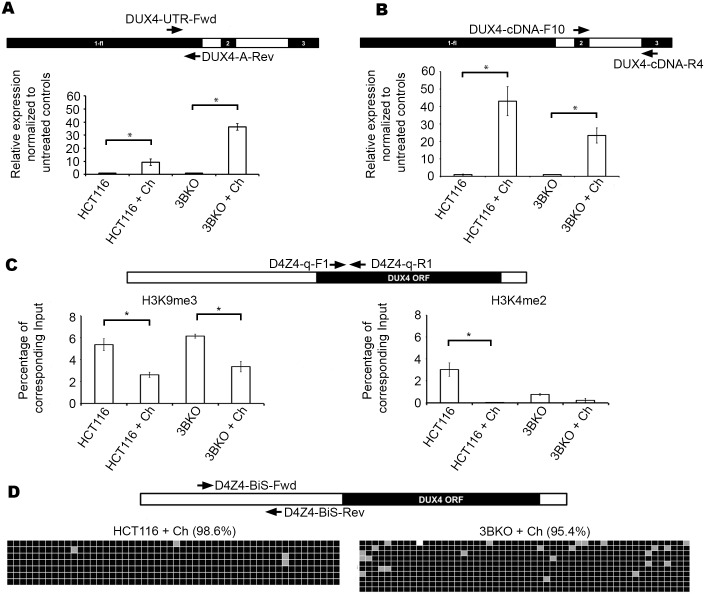
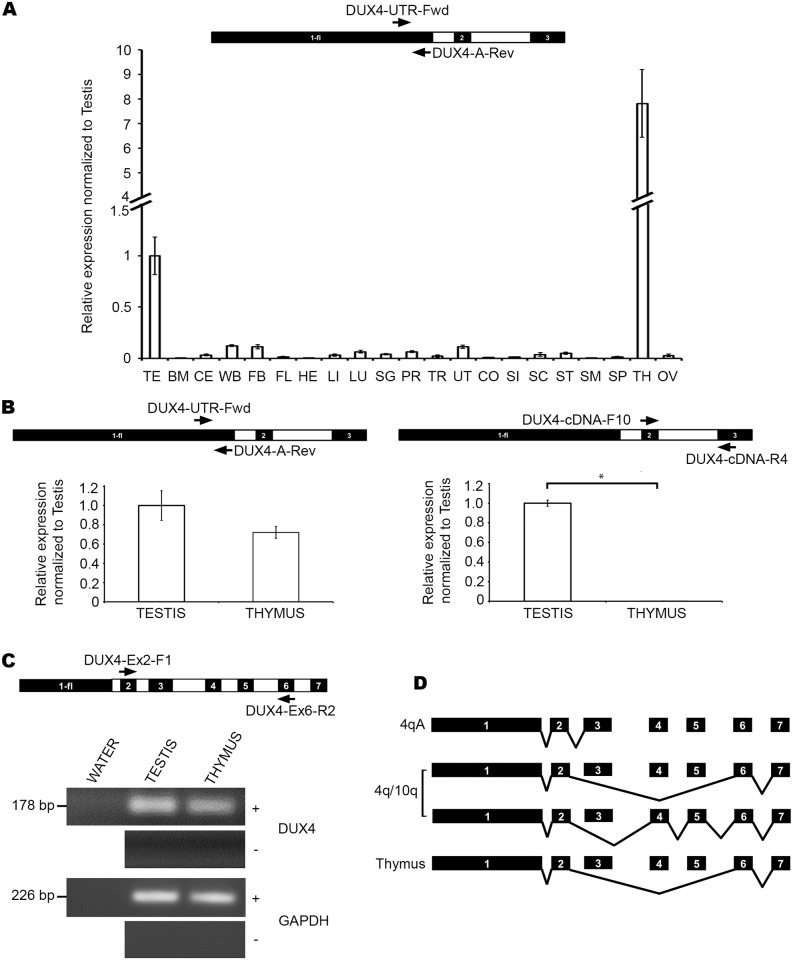
We looked at a disease-associated macrosatellite array D4Z4 and focused on epigenetic factors influencing its chromatin state outside of the disease-context. We used the HCT116 cell line that contains the non-canonical polyadenylation (poly-A) signal required to stabilize somatic transcripts of the human double homeobox gene DUX4, encoded from D4Z4. In HCT116, D4Z4 is packaged into constitutive heterochromatin, characterized by DNA methylation and histone H3 tri-methylation at lysine 9 (H3K9me3), resulting in low basal levels of D4Z4-derived transcripts. However, a double knockout (DKO) of DNA methyltransferase genes, DNMT1 and DNMT3B, but not either alone, results in significant loss of DNA and H3K9 methylation. This is coupled with upregulation of transcript levels from the array, including DUX4 isoforms (DUX4-fl) that are abnormally expressed in somatic muscle in the disease Facioscapulohumeral muscular dystrophy (FSHD) along with DUX4 protein, as indicated indirectly by upregulation of bondafide targets of DUX4 in DKO but not HCT116 cells. Results from treatment with a chemical inhibitor of histone methylation in HCT116 suggest that in the absence of DNA hypomethylation, H3K9me3 loss alone is sufficient to facilitate DUX4-fl transcription. Additionally, characterization of a cell line from a patient with Immunodeficiency, Centromeric instability and Facial anomalies syndrome 1 (ICF1) possessing a non-canonical poly-A signal and DNA hypomethylation at D4Z4 showed DUX4 target gene upregulation in the patient when compared to controls in spite of retention of H3K9me3. Taken together, these data suggest that both DNA methylation and H3K9me3 are determinants of D4Z4 silencing. Moreover, we show that in addition to testis, there is appreciable expression of spliced and polyadenylated D4Z4 derived transcripts that contain the complete DUX4 open reading frame (ORF) along with DUX4 target gene expression in the thymus, suggesting that DUX4 may provide normal function in this somatic tissue.


Conflict of interest statement

Competing Interests: The authors have declared that no competing interests exist.

Figures

Fig 1
Fig 1. Genotyping and characterization of HCT116 at D4Z4.
(A) Top panel depicts the primer map for genotyping the poly-A signal that stabilizes DUX4 transcripts. A single D4Z4 monomer (grey triangle) containing exons 1, 2 and 3 (thick black lines) of DUX4, along with the pLAM region is shown below, with the region spanning exons 2 and 3 (interrupted by Intron 2 in white) expanded on top. Arrows indicate location of primers for genotyping PCR. Genotyping results in the bottom panel indicate cell lines surveyed and number of clones observed for each haplotype. The numbers on top indicate the positions in base pairs that correspond to single nucleotide polymorphisms (SNPs) characteristic of 10qA and permissive 4qA alleles in this region based on Accession Numbers AL732375 and FJ439133, respectively. The reference permissive 4qA allele containing poly-A signal ATTAAA (black) and 10qA (grey) are indicated (first two rows) and matches are represented likewise for the samples. Non-matching sequences are annotated as not assigned (NA). (B) Labeled arrows show location of primers at the distal edge of D4Z4 that were used to detect 4qB alleles. A representative image of an ethidium bromide–stained agarose gel showing PCR results is depicted below with cell lines indicated above. Product size indicated on the left. (C) Labeled arrows show location of primers, relative to the DUX4 ORF (black rectangle) within each D4Z4 monomer (open rectangle) for PCR of ChIP samples. Immediately below is a representative image of ethidium bromide–stained agarose gels showing PCR results for HCT116 ChIP with anti-H3K9me3 (left) and anti-H3K4me2 (right). Product size is indicated on the left. Samples include water, input, ChIP elution (IP), and a rabbit serum (RS) control. (D) Labeled arrows show location of primers, relative to the DUX4 ORF (black rectangle) within each D4Z4 monomer (open rectangle). Result of bisulfite analysis for 52 CpG sites in HCT116 (average percentage methylation value shown on the left within brackets) within D4Z4 is shown below. Methylated cytosines are represented by black squares whereas unmethylated ones are colored grey. DNA variants that result in a sequence that is no longer a CpG are colored white. Each row of squares represents DNA sequence obtained from an independent single clone.
Fig 2
Fig 2. Identification and characterization of DNMT knockouts of HCT116.
(A) Ethidium bromide–stained agarose gel images showing genomic PCR validation of parental HCT116 and its DNMT KO cell lines based on presence or absence of products for DNMT1 and DNMT3B. (B) Ethidium bromide–stained agarose gels showing RT-PCR results from cDNA samples with (+) and without (-) reverse transcriptase for detecting DNMT1 and DNMT3B. Respective GAPDH controls are shown at the bottom. (C) Primer map and results of bisulfite analysis for 1KO, 3BKO and DKO cell lines displayed in the same manner as described in Fig 1D. (D) Results of qPCR on HCT116, 1KO, 3BKO and DKO ChIP at D4Z4 for H3K9me3 and H3K4me2. Labeled arrows show location of primers, relative to the DUX4 ORF (black rectangle) within each D4Z4 monomer (open rectangle) for qPCR of ChIP samples. Sample names are indicated on the X-axis while enrichment values on the Y-axis are expressed as percentage of corresponding input samples, after normalization with respect to corresponding RS samples. All values are obtained by averaging results from triplicates for each sample. Error bars represent standard error (n = 3). Statistical significance is indicated (* indicates p = < 0.001).
Fig 3
Fig 3. D4Z4/DUX4-fl transcription in HCT116 DNMT knockouts.
(A) Labeled arrows show location of nested primer sets, relative to the most distal D4Z4 monomer (exons 1 and 2 in black rectangles) and the immediately downstream pLAM region containing exon 3 (black rectangle) for detection of DUX4-fl transcripts. Representative image of ethidium bromide–stained agarose gels showing PCR results are depicted below with cell lines indicated on top treated with (+) and without (-) reverse transcriptase along with water control. Expected product sizes are indicated on the left. A GAPDH amplification positive control for all samples is shown at the bottom. The two bands in DUX4 panel correspond to amplified full length isoforms with (525 bp) and without (381 bp) intron 1. (B) Schematic representation of DUX4-fl isoforms transcribed in DKO. Also refer to S1 Fig (C) Labeled arrows show location of primers at 3’ end of exon 1, relative to the most distal D4Z4 monomer for detection of transcripts with the full DUX4 ORF by qRT-PCR with cDNA samples made with random hexamers. Below it are results of qRT-PCR for D4Z4 transcription in HCT116 and its DNMT knockouts (X-axis) and expression levels with respect to HCT116 (arbitrarily set at 1; Y-axis). All values are obtained by averaging results from triplicates for each sample. Error bars represent standard error (n = 3). Statistical significance is indicated (* p = < 0.05). (D) Labeled arrows show location of primers, relative to the most distal D4Z4 monomer for detection of spliced and polyadenylated DUX4 transcripts by qRT-PCR with cDNA samples made with oligo-dT primers. Below it are results of qRT-PCR for DUX4-fl in HCT116 and its DNMT knockouts (X-axis) and expression levels with respect to HCT116 (arbitrarily set at 1; Y-axis). All values are obtained by averaging results from triplicates for each sample. Error bars represent standard error (n = 3). Statistical significance is indicated (* p = < 0.001).
Fig 4
Fig 4. DUX4 target gene expression in HCT116 and DKO.
(A) Results of qRT-PCR for DUX4 target genes TRIM43 in the HCT116, DKO and Testis (X-axis) expressed as fold change relative to expression in DKO (arbitrarily set at 1; Y-axis), normalized with respect to GAPDH expression. All values are obtained by averaging results from triplicates for each sample. Error bars represent standard error (n = 3). Statistical significance is indicated (* p = < 0.001). (B) Results of qRT-PCR for DUX4 target genes MBD3L2 in the HCT116, DKO and Testis (X-axis) expressed as fold change relative to expression in DKO (arbitrarily set at 1; Y-axis), normalized with respect to GAPDH expression. All values are obtained by averaging results from triplicates for each sample. Error bars represent standard error (n = 3). Statistical significance is indicated (* p = < 0.05). (C) Primer map and representative image of ethidium bromide–stained agarose gels showing RT-PCR results showing expression of non-pathogenic polyadenylated mRNA transcripts. Cell lines indicated on top treated with (+) and without (-) reverse transcriptase along with water control and testis as a positive control. Expected product sizes are indicated on the left. A GAPDH amplification positive control for all samples is shown at the bottom.
Fig 5
Fig 5. Characterization of D4Z4 in an ICF1 patient and unaffected parents.
(A) Results of genotyping for ICF1 patient (GM08714) and unaffected parents (GM08728; GM08729) lymphoblastoid cell lines displayed in the same manner as described in Fig 1A. One FSHD1 patient (GM17939) lymphoblastoid cell line was genotyped as control. (B) Primer map and results of bisulfite analysis for the ICF1 patient and parent cell lines displayed in the same manner as described in Fig 1D. The family pedigree is depicted immediately below the primer map. (C) Primer map and results of qRT-PCR for D4Z4 transcription in ICF1 patient and unaffected parents, displayed in the same manner as in Fig 3C (with respect to FSHD1 lymphoblast GM17939, set arbitrarily at 1). (D) Primer map and results of qPCR for ICF1 patient and unaffected parents with ChIP using anti-H3K9me3 (left) or anti-H3K4me2 (right), displayed in the same manner as in Fig 2D. Statistical significance is indicated (* indicates p = < 0.01).
Fig 6
Fig 6. Impact of chaetocin treatment on D4Z4 in HCT116 and 3BKO cells.
(A) Primer map and results of qRT-PCR for D4Z4 transcription in untreated and chaetocin treated HCT116 and 3BKO, displayed in the same manner as in Fig 3C (with respect to untreated HCT116 and 3BKO, set arbitrarily at 1). Statistical significance is indicated (* indicates p = < 0.05 for HCT116 and p = <0.001 for 3BKO). (B) Primer map and results of qRT-PCR for DUX4-fl in untreated and chaetocin treated HCT116 and 3BKO, displayed in the same manner as in Fig 3C (with respect to untreated HCT116 and 3BKO, set arbitrarily at 1). Statistical significance is indicated (* indicates p = < 0.05). (C) Primer map and results of qPCR for untreated and chaetocin treated HCT116 and 3BKO with ChIP using anti-H3K9me3 (left) or anti-H3K4me2 (right), displayed in the same manner as in Fig 2D. Statistical significance is indicated (* indicates p = <0.01 for left panel and p = <0.05 for right panel). (D) Primer map and results of bisulfite analysis for chaetocin treated HCT116 and 3BKO displayed in the same manner as described in Fig 1D.
Fig 7
Fig 7. D4Z4 transcription is a feature of normal tissues other than testis.
(A) Primer map and results of qRT-PCR for D4Z4 transcription for tissue cDNA made with random hexamers, in human somatic tissue panel displayed in the same manner as in Fig 3C (with respect to testis expression, arbitrarily set at 1). Samples are indicated below and include testis (TE), bone marrow (BM), cerebellum (CE), whole brain (WB), fetal brain (FB), fetal liver (FL), heart (HE), liver (LI), lungs (LU), salivary gland (SG), prostate (PR), trachea (TR), uterus (UT), colon (CO), small intestine (SI), spinal cord (SC), stomach (ST), skeletal muscle (SM), spleen (SP), thymus (TH) and ovary (OV). (B) Primer map and results of qRT-PCR for D4Z4 (left) and DUX4-fl (right) transcription for testis and thymus tissue cDNA made with oligo-dT primers displayed in the same manner as in Fig 6A. Statistical significance is indicated (* indicates p = < 0.01). (C) Primer map and results of RT-PCR showing expression of non-pathogenic polyadenylated mRNA transcripts in testis and thymus, displayed in the same manner as in Fig 4C. (D) Schematic diagram showing reported alternatively spliced DUX4 transcripts arising from 4q exclusively (first transcript from top), either 4q or 10q (second and third transcripts) and exon 1-2-6-7 transcript in thymus (last transcript at the bottom).

References

    1. Giacalone J, Friedes J, Francke U. A novel GC-rich human macrosatellite VNTR in Xq24 is differentially methylated on active and inactive X chromosomes. Nat Genet. 1992;1: 137–143. 10.1038/ng0592-137 - DOI - PubMed
    1. Lindgren V, Ares M, Weiner AM, Francke U. Human genes for U2 small nuclear RNA map to a major adenovirus 12 modification site on chromosome 17. Nature. 1985;314: 115–116 - PubMed
    1. Warburton PE, Hasson D, Guillem F, Lescale C, Jin X, Abrusan G. Analysis of the largest tandemly repeated DNA families in the human genome. BMC Genomics. 2008;9: 533 10.1186/1471-2164-9-533 - DOI - PMC - PubMed
    1. Horakova AH, Moseley SC, McLaughlin CR, Tremblay DC, Chadwick BP. The macrosatellite DXZ4 mediates CTCF-dependent long-range intrachromosomal interactions on the human inactive X chromosome. Hum Mol Genet. 2012;21: 4367–4377. 10.1093/hmg/dds270 - DOI - PMC - PubMed
    1. Rao SSP, Huntley MH, Durand NC, Stamenova EK, Bochkov ID, Robinson JT, et al. A 3D map of the human genome at kilobase resolution reveals principles of chromatin looping. Cell. 2014;159: 1665–1680. 10.1016/j.cell.2014.11.021 - DOI - PMC - PubMed