. 2016 Apr 22;5(5):e1138200.
doi: 10.1080/2162402X.2016.1138200. eCollection 2016 May.

Serum anti-MDM2 and anti-c-Myc autoantibodies as biomarkers in the early detection of lung cancer

Affiliations

Serum anti-MDM2 and anti-c-Myc autoantibodies as biomarkers in the early detection of lung cancer

Pei Li et al. Oncoimmunology. .

Abstract

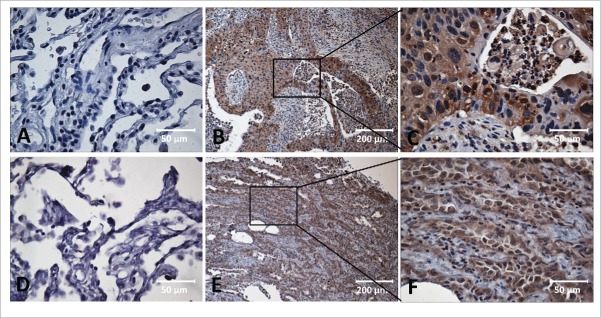
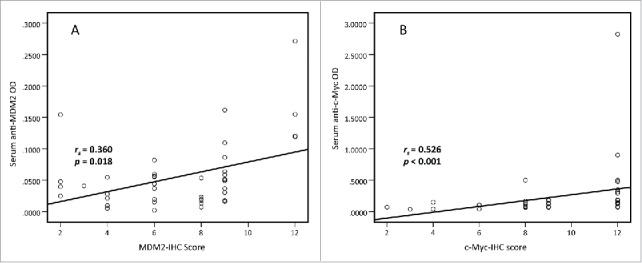
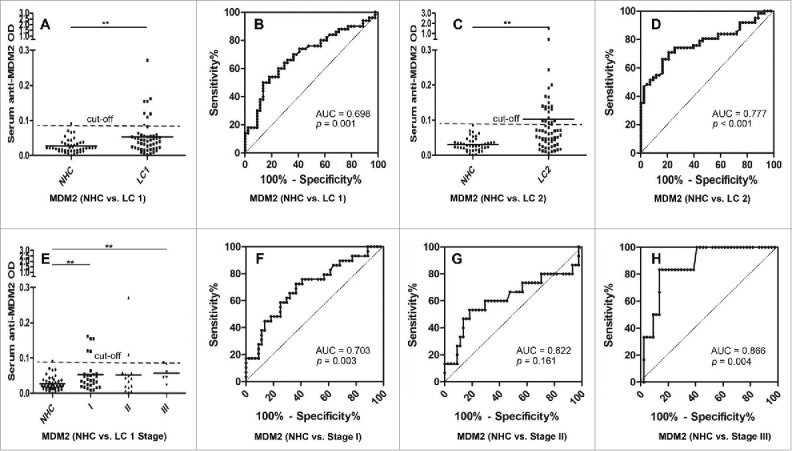
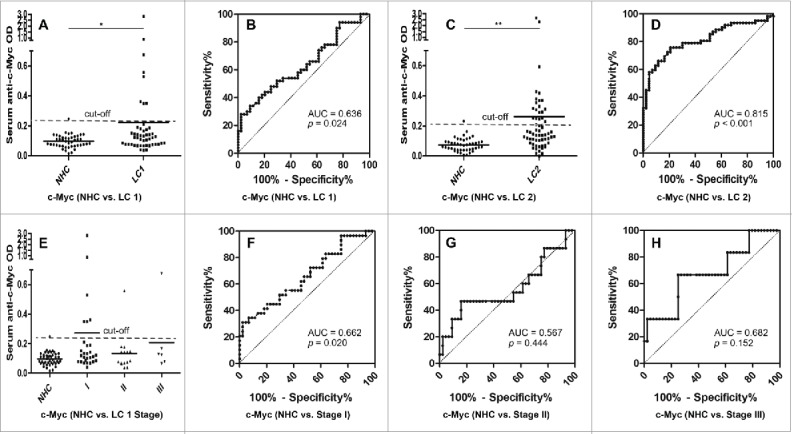
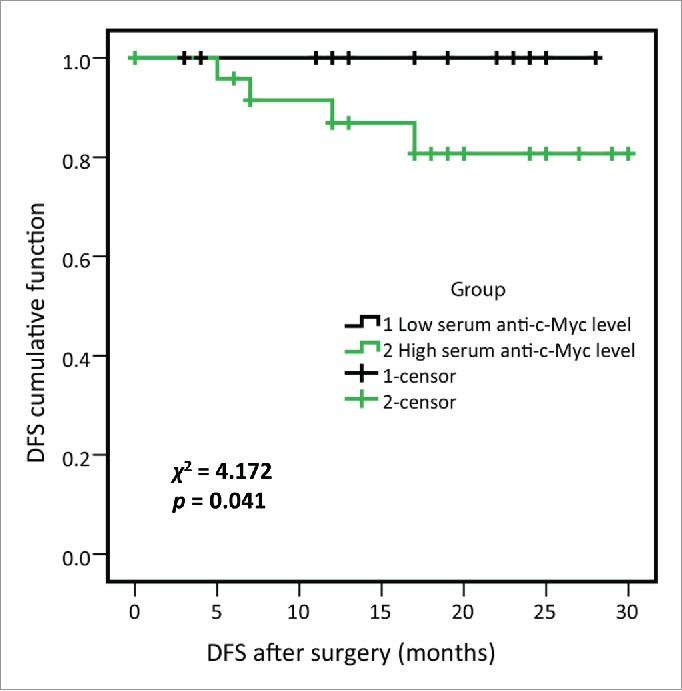
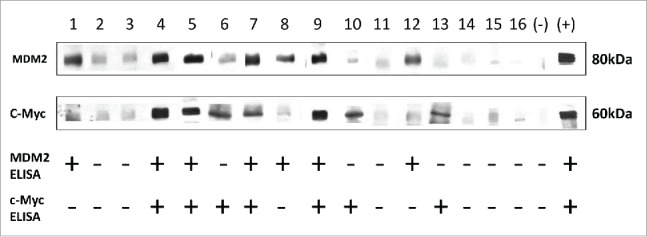
This study aims to investigate the clinical significance of serum autoantibodies against MDM2 and c-Myc and evaluate their feasibility in the immunodiagnosis of lung cancer. 50 sera samples with 43 available paired lung cancer tissue and adjacent normal tissue slides with follow up information and 44 sera from normal human controls (NHC) were used in the research group. Another 62 lung cancer sera and 43 NHC sera were used in the validation group. The results of IHC showed that MDM2 and c-Myc protein were overexpressed in lung cancer tissues compared to adjacent normal tissues (p < 0.001). Likewise, significantly higher levels of serum autoantibodies against MDM2 and c-Myc were found in lung cancer compared to NHC both in research and validation groups. Further analysis on IHC and ELISA results showed that serum level of autoantibodies against these two TAAs were positively associated with tissue staining scores (both p < 0.05). The area under curve (AUC) values of anti-MDM2 and anti-cMyc autoantibodies for discriminating lung cancers from NHC were 0.698 and 0.636 in research group, 0.777 and 0.815 in the validation group, respectively. Both anti-MDM2 and anti-c-Myc autoantibodies can discriminate stage I lung cancer patients from NHC with AUC values of 0.703 and 0.662. Kaplan-Meier analysis showed that higher level of serum anti-c-Myc autoantibodies was significantly related to shortened disease-free survival (DFS) (p = 0.041). In conclusion, our finding suggested that serum MDM2 and c-Myc autoantibodies may have the potential to serve as non-invasive diagnostic biomarkers in patients with lung cancer.

Keywords: Autoantibody; MDM2; biomarker; c-Myc; immunodiagnosis; lung cancer; tumor-associated antigen.


Figures

Figure 1.
Figure 1.
Immunohistochemical staining of MDM2, c-Myc in Lung cancer tissue and adjacent normal tissue slides. Tissue slides were stained with monoclonal anti-MDM2 antibody (A, B, C) and anti-c-Myc antibody (D, E, F), respectively. (A) Negative stain pattern of MDM2 in representative adjacent normal tissue (×400 magnification). (B and C) Positive stain pattern of MDM2 in representative lung cancer tissue (×100 and ×400 magnification). (D) Negative stain pattern of c-Myc in representative adjacent normal tissue (×400 magnification). (E and F) Positive stain pattern of c-Myc in representative lung cancer tissue (×100 and ×400 magnification).
Figure 2.
Figure 2.
Spearman correlation of MDM2 and c-Myc IHC scores and serum levels of autoantibodies against MDM2 and c-Myc. Spearman correlation analysis was used to explore the link between MDM2 and c-Myc IHC scores and serum autoantibodies against these two TAAs in 43 lung cancer cases with paired tissues and sera samples. The results show that MDM2 and c-Myc protein expression in lung cancer tissues are positively associated with serum autoantibodies against these two TAAs respectively. (rs = 0.360, p = 0.018 and rs = 0.526, p < 0.001, respectively).
Figure 3.
Figure 3.
Serum anti-MDM2 autoantibodies in lung cancer and NHC. In Fig. 3A, 3C and 3E, Y-axis represents OD value and X-axis represents serum samples (*p < 0.05; **p < 0.01). (A) Serum anti-MDM2 autoantibodies distribution in NHC (n = 44) and lung cancer patients (n = 50) (p = 0.001). (B) ROC curve analysis using serum anti-MDM2 autoantibodies for discriminating lung cancer patients from NHC in research group (AUC: 0.698, 95% CI: 0.592–0.805, p = 0.001). (C) Serum anti-MDM2 autoantibodies distribution in the validation group including NHC (n = 43) and lung cancer patients (n = 62) (p = 0.005). (D) ROC curve yielded by OD values of serum anti-MDM2 autoantibodies for discriminating lung cancer patients from NHC in the validation group (AUC: 0.777, 95% CI: 0.689–0.865, p < 0.001). (E) Serum anti-MDM2 autoantibodies distribution and in NHC and lung cancer patients with different TNM stage. (F) ROC curve yielded by OD values of anti-MDM2 autoantibodies in discriminating stage I lung cancer patients from NHC (AUC: 0.703; 95% CI: 0.5800–0.827, p = 0.003). (G) ROC curve yielded by OD values of anti-MDM2 autoantibodies in discriminating stage II lung cancer patients from NHC (AUC: 0.622; 95% CI: 0.432–0.812, p = 0.161). (H) ROC curve yielded by OD values of anti-MDM2 autoantibodies in discriminating stage I lung cancer patients from NHC (AUC: 0.866; 95% CI: 0.741–0.991, p = 0.004). Note: LC1: 50 lung cancer patients from research group. LC2: 62 lung cancer patients from validation group.
Figure 4.
Figure 4.
Serum anti-c-Myc autoantibodies in lung cancer patients and NHC. In Fig 4A, 4C and 4E, Y-axis represents OD value and X-axis represents serum samples (*p < 0.05; **p < 0.01). (A) Serum anti-c-Myc autoantibodies distribution in NHC (n = 44) and lung cancer patients (n = 50) (p = 0.049). (B) ROC curve analysis using serum anti-c-Myc autoantibodies for discriminating lung cancer patients from NHC in research group (AUC: 0.636, 95% CI: 0.524–0.747, p = 0.024). (C) Serum anti-c-Myc autoantibodies distribution in the validation group including NHC (n = 43) and lung cancer patients (n = 62) (p = 0.001). (D) ROC curve yielded by OD values of serum anti-c-Myc autoantibodies for discriminating lung cancer patients from NHC in the validation group (AUC: 0.815, 95% CI: 0.733–0.896, p < 0.001). (E) Serum anti-c-Myc autoantibodies distribution and in NHC and lung cancer patients with different TNM stage. (F) ROC curve yielded by OD values of anti-c-Myc autoantibodies in discriminating stage I lung cancer patients from NHC (AUC: 0.662; 95% CI: 0.532–0.791, p = 0.020). (G) ROC curve yielded by OD values of anti-c-Myc autoantibodies in discriminating stage II lung cancer patients from NHC (AUC: 0.567; 95% CI: 0.377–0.756, p = 0.444). (H) ROC curve yielded by OD values of anti-c-Myc autoantibodies in discriminating stage I lung cancer patients from NHC (AUC: 0.682; 95% CI: 0.439–0.924, p = 0.152). Note: LC1: 50 lung cancer patients from research group. LC2: 62 lung cancer patients from validation group.
Figure 5.
Figure 5.
Disease-free survival (DFS) of high- and low-serum anti-c-Myc autoantibodies levels in lung cancer patients from research group. 50 lung cancer patients from research group were divided into two subgroups by using the median OD value of serum anti-c-Myc autoantibodies, as were high- and low-serum anti-c-Myc autoantibodies expression subgroups respectively, and 25 lung cancer patients were included in each subgroup. Log-rank test showed that lung cancer patients with higher anti-c-Myc autoantibodies were associated with shortened DFS (χ2 = 4.172, p = 0.041).
Figure 6.
Figure 6.
Western Blot results validated the results from ELISA. Western Blot analysis with representative sera from lung cancer patients and NHC. Lanes 1–10 (research group), Lanes 11, 12 (validation group), sera from lung cancer patients; Lanes 13–16, sera from NHC. Lanes 4, 5, 7 and 9 show immunoreactivity with both MDM2 and c-Myc recombinant proteins; Lanes 6, 10 and 13 show strong reactivity with c-Myc recombinant protein, while they show weak reactivity with MDM2; Lanes 1, 8 and 12 show strong reactivity with MDM2 recombinant protein, while they show weak reactivity with c-Myc; Lanes 2, 3, 11, 14, 15 and 16 show no reactions with MDM2 or c-Myc. The last two lanes are negative control and positive control of MDM2 and c-Myc, respectively. Note: MDM2 and c-Myc proteins transferred to the NC membrane were purified his-tag proteins.

References

    1. Siegel RL, Miller KD, Jemal A. Cancer statistics, 2015. CA Cancer J Clin 2015; 65:5–29; PMID:25559415; http://dx.doi.org/10.3322/caac.21254 - DOI - PubMed
    1. Midthun DE. Early diagnosis of lung cancer. F1000 Prime Rep 2013; 5:12; PMID:23585930; http://dx.doi.org/10.12703/P5-12 - DOI - PMC - PubMed
    1. Arkin DM, Ferlay J, Curado MP, Bray F, Edwards B, Shin HR, Forman D. Fifty years of cancer incidence: CI5 I-IX. Int J Cancer 2010; 127:2918–27; PMID:21351270; http://dx.doi.org/10.1002/ijc.25517 - DOI - PubMed
    1. Goldstraw P, Crowley J, Chansky K, Giroux DJ, Groome PA, Rami-Porta R, Postmus PE, Rusch V, Sobin L, International Association for the Study of Lung Cancer International Staging C et al.. The IASLC Lung Cancer Staging Project: proposals for the revision of the TNM stage groupings in the forthcoming (seventh) edition of the TNM Classification of malignant tumours. J Thorac Oncol 2007; 2:706–14; PMID:17762336; http://dx.doi.org/10.1097/JTO.0b013e31812f3c1a - DOI - PubMed
    1. Howlader N, Noone A, Krapcho M, Garshell J, Miller D, Altekruse S, Kosary C, Yu M, Ruhl J, Tatalovich Z et al.. SEER cancer statistics review, 1975–2012. National Cancer Institute; Bethesda, MD: http://seercancergov/csr/1975_2012/2015

Publication types

LinkOut - more resources