. 2016 Jul 26:7:34.
doi: 10.1186/s13293-016-0087-5. eCollection 2016.

Female rats are not more variable than male rats: a meta-analysis of neuroscience studies

Affiliations

Female rats are not more variable than male rats: a meta-analysis of neuroscience studies

Jill B Becker et al. Biol Sex Differ. .

Abstract

Background: Not including female rats or mice in neuroscience research has been justified due to the variable nature of female data caused by hormonal fluctuations associated with the female reproductive cycle. In this study, we investigated whether female rats are more variable than male rats in scientific reports of neuroscience-related traits.

Methods: PubMed and Web of Science were searched for the period from August 1, 2010, to July 31, 2014, for articles that included both male and female rats and that measured diverse aspects of brain function. Only empirical articles using both male and female gonad-intact adult rats, written in English, and including the number of subjects (or a range) were included. This resulted in 311 articles for analysis. Data were extracted from digital images from article PDFs and from manuscript tables and text. The mean and standard deviation (SD) were determined for each data point and their quotient provided a coefficient of variation (CV) as a measure of trait-specific variability for each sex. Additionally, the results were coded for the type of research being measured (behavior, electrophysiology, histology, neurochemistry, and non-brain measures) and for the strain of rat. Over 6000 data points were extracted for both males and females. Subsets of the data were coded for whether male and female mean values differed significantly and whether animals were grouped or individually housed.

Results: Across all traits, there were no sex differences in trait variability, as indicated by the CV, and there were no sex differences in any of the four neuroscience categories, even in instances in which mean values for males and females were significantly different. Female rats were not more variable at any stage of the estrous cycle than male rats. There were no sex differences in the effect of housing conditions on CV. On one of four measures of non-brain function, females were more variable than males.

Conclusions: We conclude that even when female rats are used in neuroscience experiments without regard to the estrous cycle stage, their data are not more variable than those of male rats. This is true for behavioral, electrophysiological, neurochemical, and histological measures. Thus, when designing neuroscience experiments to include both male and female rats, power analyses based on variance in male measures are sufficient to yield accurate numbers for females as well, even when the estrous cycle is not taken into consideration.

Keywords: Neurobiology; Rattus norvegicus; Sex bias; Sex differences.


Figures
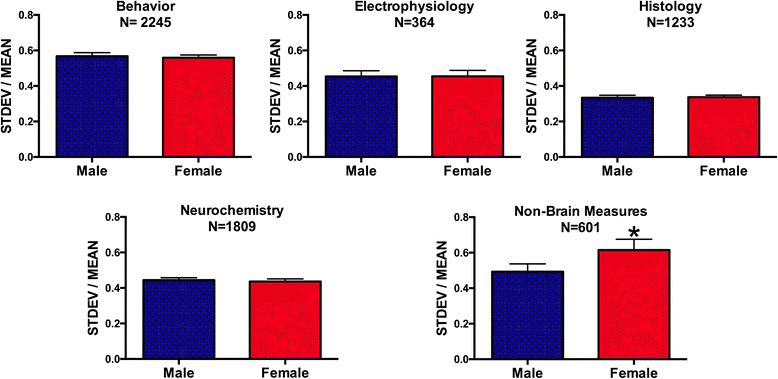
Fig. 1
Fig. 1
Trait variance as indicated by the standard deviation (STDEV) divided by the mean for behavioral measures, electrophysiological measures, histological measures, and neurochemistry and non-brain measures. N = number of data points each for males and females. For “non-brain measures,” there was greater variability for females. *Females > males (p = 0.03 on a Mann-Whitney U test). SEM indicated by the lines above the bars
Fig. 2
Fig. 2
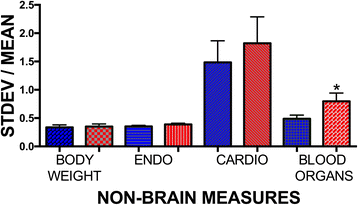
Trait variance as indicated by the standard deviation (STDEV) divided by the mean for non-brain measures further categorized. When sub-categories of non-brain measures were further scrutinized, we found there was greater variability for females only for the blood/organ measures. *Females > males (p = 0.036 on a Mann-Whitney U test). Males—blue bars, females—red bars. SEM indicated by the lines above the bars
Fig. 3
Fig. 3
Histogram of distribution of CV ratios (female CV/(female CV + male CV)). To examine whether the variance from the mean was normally distributed for the different traits, we examined the CV ratios. A value of 0.5 (indicated by the vertical black line) would indicate that males and females are the same. Values to the right of the vertical black line for each trait are values where females are more variable than males. Values to the left of the line indicate males are variable than females. **Males were more variable on the E-Phys trait (p = 0.037) and the neurochemistry trait (p = 0.0196). *Females were more variable than males on the non-brain measures (p < 0.0001)
Fig. 4
Fig. 4
CV values (STDEV/MEAN) for neurochemistry (top) and histology (bottom) examined based on whether there was a sex difference found for the paired male and female values. CV values did not vary based on whether or not there was a sex difference found. There were only 20 values from the histology articles where a comparison between males and females was not made, so those were excluded. SEM indicated by the lines above the bars. NM not measured
Fig. 5
Fig. 5
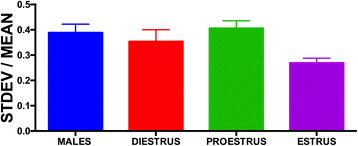
Effect of estrous cycle on sex differences in trait variability. There was no significant effect of estrous cycle or sex differences in trait variability even when phase of the cycle was taken into consideration. SEM indicated by the lines above the bars
Fig. 6
Fig. 6
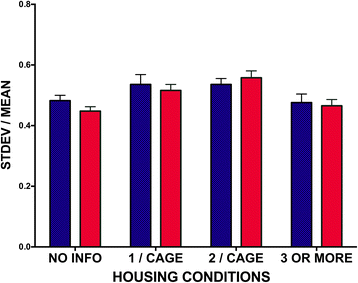
Effect of housing conditions on sex differences in trait variability. There was an overall effect of the number of animals per cage (p < 0.0005), but no effect of sex on CV and no interaction. SEM indicated by the lines above the bars
Fig. 7
Fig. 7
Male Sprague-Dawley rats exhibited greater variance than male Wistar rats *p < 0.05. Sprague-Dawley: N = 2871; Long-Evans: N = 1053; Wistar: N = 2221; Norway Brown: N = 50. SEM indicated by the lines above the bars

References

    1. Mazure CM, Jones DP. Twenty years and still counting: including women as participants and studying sex and gender in biomedical research. BMC Womens Health. 2015;15:94. doi: 10.1186/s12905-015-0251-9. - DOI - PMC - PubMed
    1. Clayton JA, Collins FS. Policy: NIH to balance sex in cell and animal studies. Nature. 2014;509:282–283. doi: 10.1038/509282a. - DOI - PMC - PubMed
    1. Clayton JA. Studying both sexes: a guiding principle for biomedicine. FASEB J. 2016;30:519–524. doi: 10.1096/fj.15-279554. - DOI - PMC - PubMed
    1. Fields RD. NIH policy: mandate goes too far. Nature. 2014;510:340. doi: 10.1038/510340a. - DOI - PubMed
    1. Beery AK, Zucker I. Sex bias in neuroscience and biomedical research. Neurosci Biobehav Rev. 2011;35:565–572. doi: 10.1016/j.neubiorev.2010.07.002. - DOI - PMC - PubMed

LinkOut - more resources