. 2016 Jul 7;1(10):e85832.
doi: 10.1172/jci.insight.85832.

Vaccine-generated lung tissue-resident memory T cells provide heterosubtypic protection to influenza infection

Affiliations

Vaccine-generated lung tissue-resident memory T cells provide heterosubtypic protection to influenza infection

Kyra D Zens et al. JCI Insight. .

Abstract

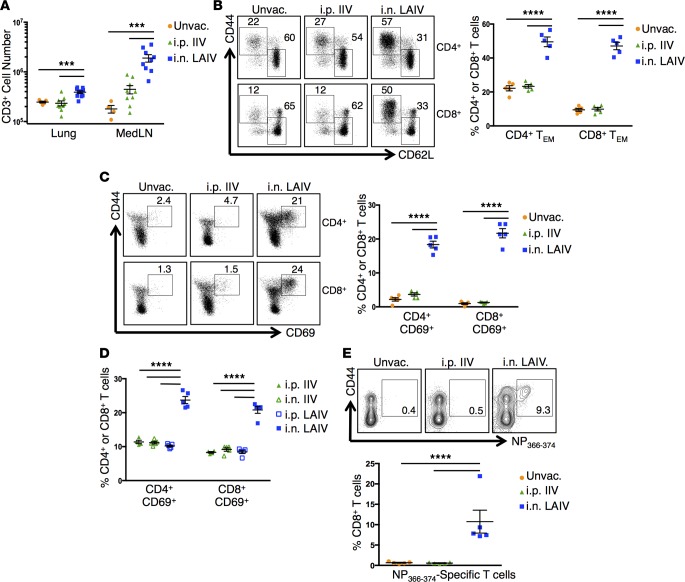
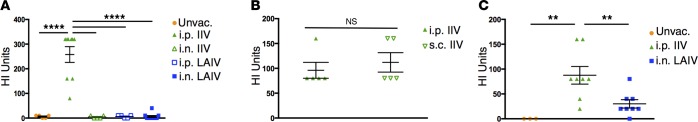
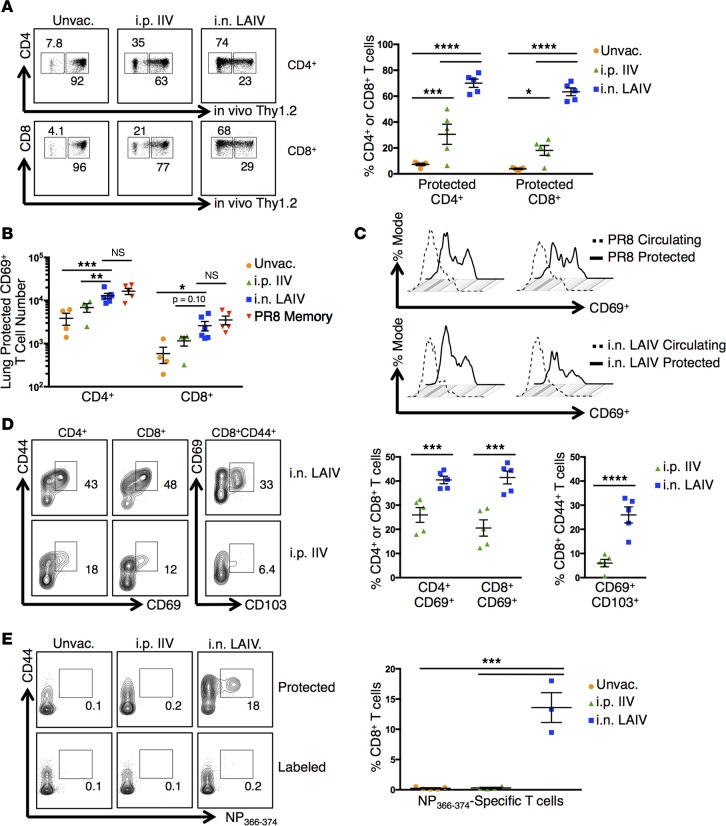
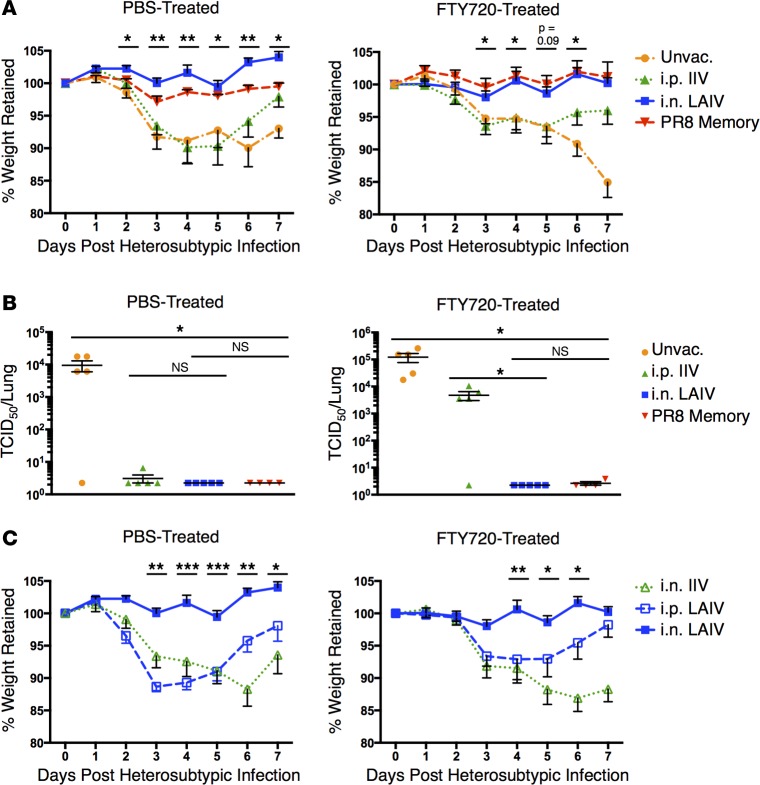
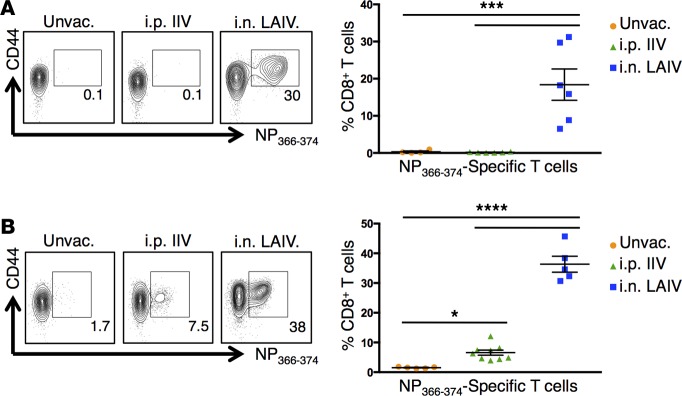
Tissue-resident memory T cells (TRM) are a recently defined, noncirculating subset with the potential for rapid in situ protective responses, although their generation and role in vaccine-mediated immune responses is unclear. Here, we assessed TRM generation and lung-localized protection following administration of currently licensed influenza vaccines, including injectable inactivated influenza virus (IIV, Fluzone) and i.n. administered live-attenuated influenza virus (LAIV, FluMist) vaccines. We found that, while IIV preferentially induced strain-specific neutralizing antibodies, LAIV generated lung-localized, virus-specific T cell responses. Moreover, LAIV but not IIV generated lung CD4+ TRM and virus-specific CD8+ TRM, similar in phenotype to those generated by influenza virus infection. Importantly, these vaccine-generated TRM mediated cross-strain protection, independent of circulating T cells and neutralizing antibodies, which persisted long-term after vaccination. Interestingly, intranasal administration of IIV or injection of LAIV failed to elicit T cell responses or provide protection against viral infection, demonstrating dual requirements for respiratory targeting and a live-attenuated strain to establish TRM. The ability of LAIV to generate lung TRM capable of providing long-term protection against nonvaccine viral strains, as demonstrated here, has important implications for protecting the population against emergent influenza pandemics by direct fortification of lung-specific immunity.


Figures

Figure 1
Figure 1. Distinct localization of primary T cell responses following vaccination with IIV or LAIV.
(A) CD3+ cells in the lung and MedLN of mice 10 days after vaccination with 2014–2015 IIV or LAIV. Graph displays mean absolute CD3+ cell numbers ± SEM (n = 5–10 mice per group compiled from 2 independent experiments; significance determined by multiple Student’s t tests with Welch’s correction, ***P < 0.001). (B) Lung effector/memory T cells 10 days after vaccination with 2014–2015 IIV or LAIV. Left: Representative flow cytometry plots displaying percentages of cells with naive (CD44loCD62Lhi) and effector/memory (CD44hiCD62Llo) phenotypes. Right: Individual percentages of lung CD4+ and CD8+ effector/memory phenotype T cells (TEM) ± SEM (n = 5 mice per group, representative of 3 experiments; significance determined by 2-way ANOVA with Holm-Sidak’s multiple comparisons test, ****P < 0.0001). (C) CD69 expression by lung T cells 10 days after vaccination with 2014–2015 IIV or LAIV. Left: Representative flow cytometry plots showing percentages of cells with CD44hiCD69hi phenotype. Right: Individual percentages of lung CD4+ and CD8+ T cells expressing CD69 ± SEM (n = 5 mice per group, representative of 3 experiments; significance determined by 2-way ANOVA with Holm-Sidak’s multiple comparisons test, ****P < 0.0001). (D) CD69 expression by lung T cells 10 days after vaccination with 2014–2015 IIV (i.n. or i.p.) or LAIV (i.n. or i.p). Graph displays individual percentages of lung CD4+ and CD8+ T cells expressing CD69 ± SEM (n = 4–5 mice/group; significance determined by 2-way ANOVA with Holm-Sidak’s multiple comparisons test, ****P < 0.0001). (E) Influenza-specific CD8+ T cells in the lungs 10 days after vaccination with 2015–2016 IIV or LAIV. Top: Representative flow cytometry plots with percentages of lung NP366-374–specific CD8+ T cells. Bottom: Individual percentages of lung NP366-374–specific CD8+ T cells ± SEM (n = 5 mice per group, representative of 2 experiments; significance determined by 1-way ANOVA with Holm-Sidak’s multiple comparisons test, ***P < 0.001).
Figure 2
Figure 2. Distinct primary serum neutralizing antibody responses following vaccination with IIV or LAIV.
(A) Serum HA–neutralizing antibody titers to vaccine antigen 10 days after vaccination in mice receiving 2014–2015 IIV (i.n. or i.p.) or LAIV (i.n. or i.p.). Graph shows individual HAI titers ± SEM (n = 5–10 mice per group compiled from 2 independent experiments; significance determined by 1-way ANOVA with Holm-Sidak’s multiple comparisons test, ****P < 0.0001). (B) Serum HA-neutralizing antibody titers to vaccine antigen 10 days after vaccination in mice administered 2014–2015 IIV i.p. or s.c. Graph shows individual HAI titers ± SEM (n = 5 mice per group; significance determined by 2-tailed Student’s t test with Welch’s correction, ns P > 0.05). (C) Serum HA–neutralizing antibody titers to vaccine antigen 10 days after vaccination in mice receiving 2015–2016 i.p. IIV or i.n. LAIV. Graph shows individual HAI titers ± SEM (n = 3–8 mice per group compiled from 2 independent experiments; significance determined by 1-way ANOVA with Holm-Sidak’s multiple comparisons test, **P < 0.01).
Figure 3
Figure 3. LAIV-vaccination generates lung TRM.
(A) Lung T cells labeled by i.v. anti-Thy1 antibody in mice 6 weeks after vaccination with 2014–2015 IIV or LAIV. Left: Representative flow cytometry plots displaying CD4+ and CD8+ cells in tissues (“Protected”) or circulating (“Labeled”). Right: Individual percentages of protected T cells ± SEM (n = 5 mice per group, representative of 2 experiments; significance determined by 2-way ANOVA with Holm-Sidak’s multiple comparisons test, ****P < 0.0001, ***P < 0.001, *P < 0.05). (B) Protected lung CD69+ T cells in mice 16 weeks after vaccination with 2014–2015 IIV or LAIV or after infection with PR8 influenza. Graph displays protected CD69+ cell numbers ± SEM (n = 4–5 mice per group, representative of 2 experiments; significance determined by multiple Student’s t tests with Welch’s correction, *P < 0.05). (C) CD69 expression by protected versus circulating lung T cells 16 weeks after 2014–2015 LAIV vaccination or PR8 infection. Top: Representative histogram of CD69 expression by protected/labeled lung T cells after PR8 infection. Bottom: CD69 expression by protected/labeled lung T cells after LAIV vaccination. (D) TRM marker expression in protected lung T cells 6 weeks after vaccination with 2015–2016 IIV or LAIV. Left: Representative flow cytometry plots displaying protected CD4+ and CD8+ T cells with CD44hiCD69+ phenotypes or protected CD8+CD44+ T cells with CD69+CD103hi phenotype. Right: Individual percentages of protected CD4+ or CD8+ T cells expressing CD69 or protected CD8+CD44+ T cells expressing CD103 ± SEM (n = 5 mice per group, representative of 3 experiments; significance determined by multiple Student’s t tests with Holm-Sidak’s correction, ****P < 0.0001, ***P < 0.001). (E) Protected lung influenza–specific CD8+ T cells in mice 5 weeks after vaccination with 2015–2016 IIV or LAIV. Left: Representative flow cytometry plots displaying protected or labeled lung NP366-374–specific CD8+ T cells. Right: Individual percentages of protected lung NP366-374–specific CD8+ T cells ± SEM (n = 3–5 mice per group; significance determined by 1-way ANOVA with Holm-Sidak’s multiple comparisons test, ***P < 0.001).
Figure 4
Figure 4. LAIV generates TRM-mediated heterosubtypic protection.
(A) Morbidity following heterosubtypic X31 (H3N2) infection in unvaccinated mice or mice vaccinated 6 weeks prior with 2014–2015 IIV or LAIV or infected with PR8 (H1N1) influenza. Left: Mean percentage weight retention in infected animals receiving daily PBS treatment ± SEM. Right: Mean percentage weight retention in infected animals receiving daily FTY720 treatment ± SEM (n = 5 mice per group, representative of 2 experiments; significance determined by multiple Student’s t tests comparing i.n. LAIV-vaccinated to i.p. IIV-vaccinated, **P < 0.01, *P < 0.05). (B) Viral clearance 5 days after X31 infection in mice administered 2014–2015 IIV or LAIV or infected with PR8 influenza 6 weeks prior. Left: Individual D5 lung viral titers in infected animals receiving daily PBS treatment ± SEM. Right: Individual D5 lung viral titers in infected animals receiving daily FTY720 treatment ± SEM (n = 5 mice per group, representative of 3 experiments; significance determined by 1-way ANOVA with Holm-Sidak’s multiple comparisons test, *P < 0.05). (C) Morbidity following X31 infection in animals vaccinated with i.n. 2014–2015 IIV or i.n. or i.p. LAIV 6 weeks prior. Left: Mean percentage weight retention in infected animals with daily PBS treatment ± SEM. Right: Mean percentage weight retention in infected animals with daily FTY720 treatment ± SEM (n = 5 mice per group; significance determined by multiple Student’s t tests comparing i.n. LAIV-vaccinated with other recipient groups with the least significant P value reported, ***P < 0.001, **P < 0.01, *P < 0.05). TCID50, 50% tissue culture infective dose.
Figure 5
Figure 5. Heterosubtypic infection induces a significant lung influenza–specific CD8+ T cell recall response in LAIV-vaccinated mice.
(A) Influenza-specific CD8+ T cells in the lungs 5 days after PR8 (H1N1) influenza infection in unvaccinated mice or mice vaccinated with 2014–2015 IIV or LAIV 6 weeks prior. Animals were treated daily throughout infection with FTY720. Left: Representative flow cytometry plots showing percentages of influenza NP366-374–specific CD8+ T cells in the lungs. Right: Individual percentages of lung NP366-374–specific CD8+ T cells ± SEM (n = 5–6 mice per group; significance determined by 1-way ANOVA with Holm-Sidak’s multiple comparisons test, ***P < 0.001). (B) Influenza-specific CD8+ T cells in the lungs 6 days after X31 (H3N2) influenza infection in unvaccinated mice or mice vaccinated with 2015–2016 IIV or LAIV 6 weeks prior. Animals were treated daily throughout infection with FTY720. Left: Representative flow plots showing percentages of NP366-374–specific CD8+ T cells in the lungs. Right: Individual percentages of lung NP366-374–specific CD8+ T cells ± SEM (n = 5–9 mice per group; significance determined by 1-way ANOVA with Holm-Sidak’s multiple comparisons test, ****P < 0.0001, *P < 0.05).

References

    1. Fiore AE, et al. Prevention and control of influenza with vaccines: recommendations of the Advisory Committee on Immunization Practices (ACIP), 2010. MMWR Recomm Rep. 2010;59(RR-8):1–62. - PubMed
    1. McIntyre AF, Gonzalez-Feliciano AG, Bryan LN, Santibanez TA, Williams WW, Singleton JA. Seasonal influenza vaccination coverage - United States, 2009-10 and 2010-11. MMWR Surveill Summ. 2013;62 Suppl 3(3):65–68. - PubMed
    1. Thomas PG, Keating R, Hulse-Post DJ, Doherty PC. Cell-mediated protection in influenza infection. Emerg Infect Dis. 2006;12(1):48–54. doi: 10.3201/eid1201.051237. - DOI - PMC - PubMed
    1. Assarsson E, et al. Immunomic analysis of the repertoire of T-cell specificities for influenza A virus in humans. J Virol. 2008;82(24):12241–12251. doi: 10.1128/JVI.01563-08. - DOI - PMC - PubMed
    1. Belz GT, Xie W, Doherty PC. Diversity of epitope and cytokine profiles for primary and secondary influenza a virus-specific CD8+ T cell responses. J Immunol. 2001;166(7):4627–4633. doi: 10.4049/jimmunol.166.7.4627. - DOI - PubMed

Publication types