. 2016 Jul 28;7(7):e2315.
doi: 10.1038/cddis.2016.228.

Egg antigen p40 of Schistosoma japonicum promotes senescence in activated hepatic stellate cells by activation of the STAT3/p53/p21 pathway

Affiliations

Egg antigen p40 of Schistosoma japonicum promotes senescence in activated hepatic stellate cells by activation of the STAT3/p53/p21 pathway

Jinling Chen et al. Cell Death Dis. .

Abstract

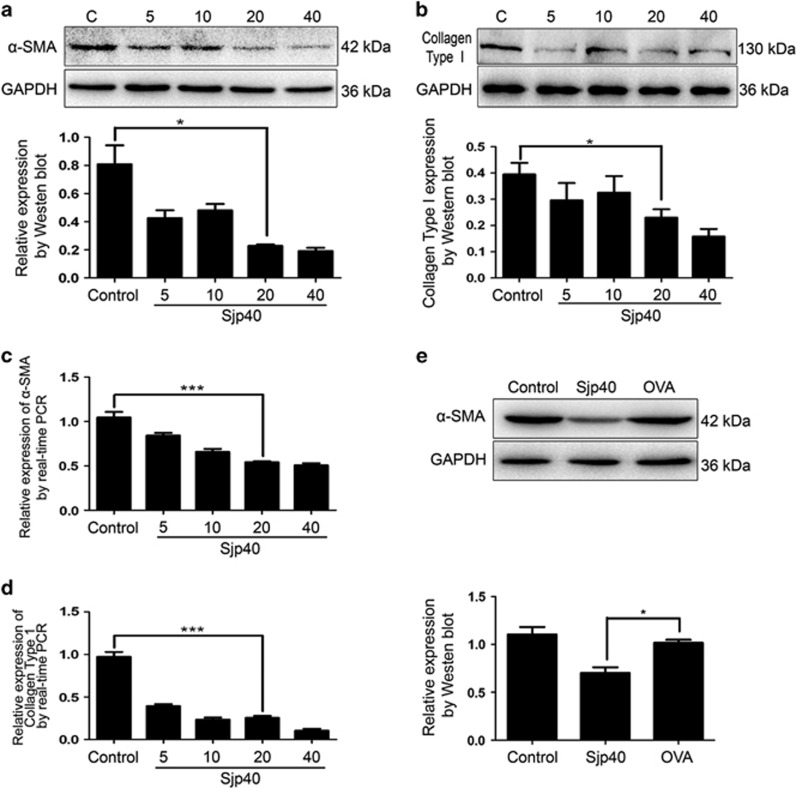
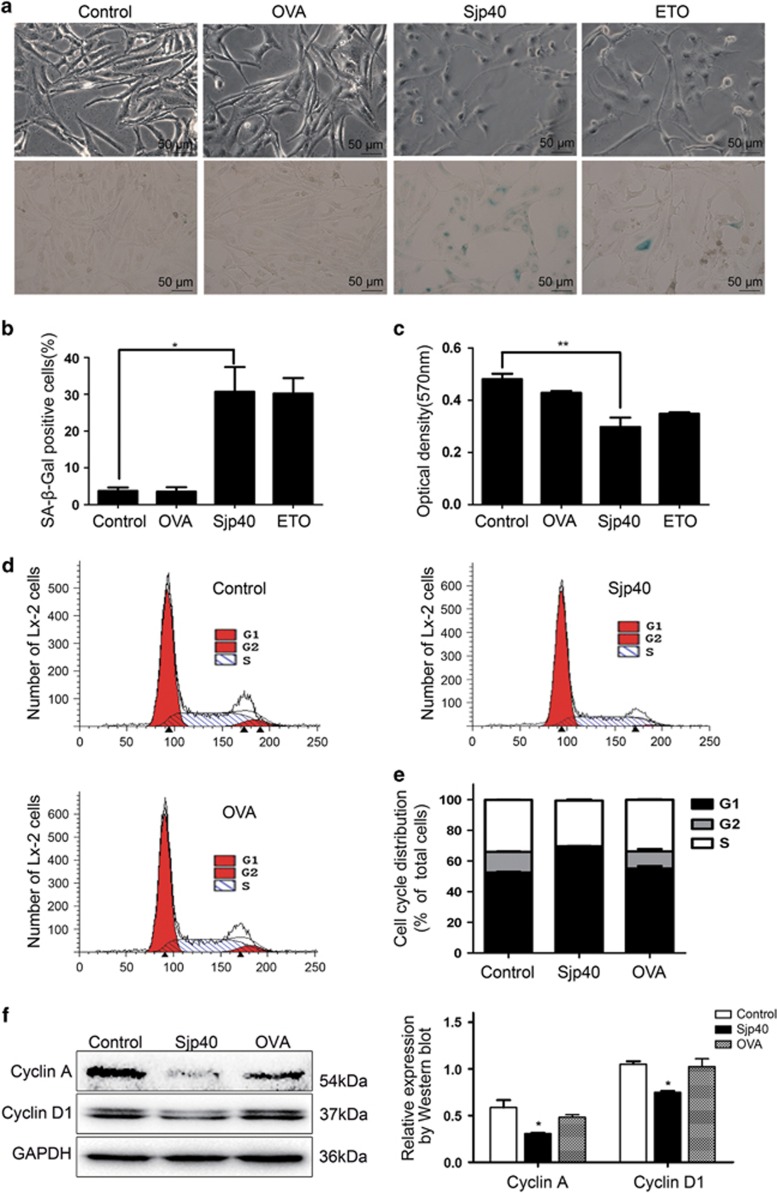
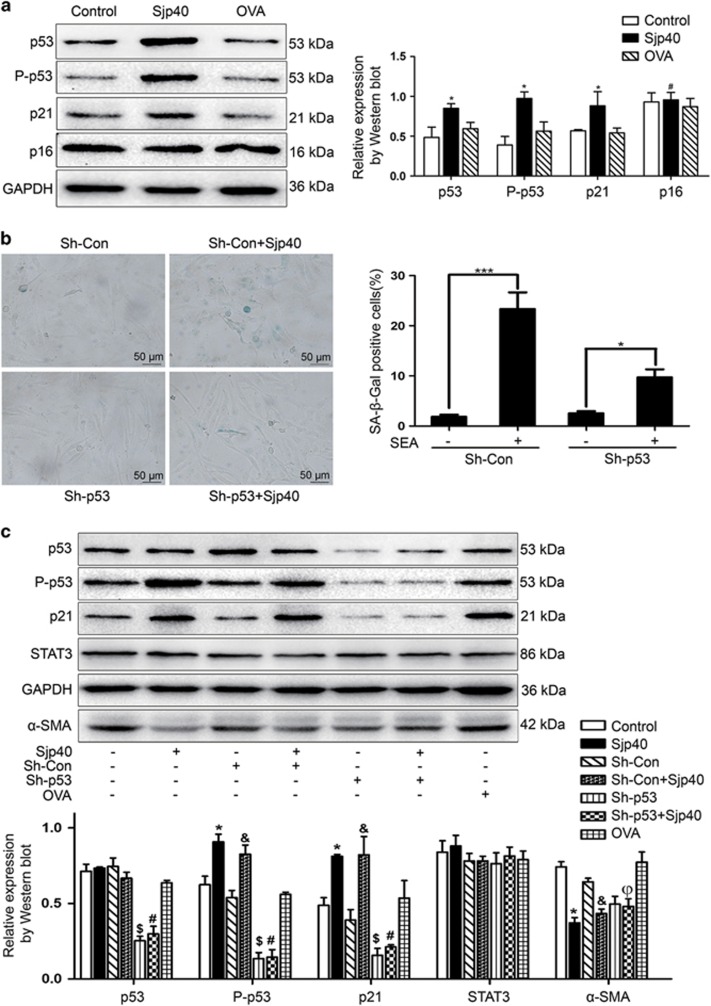
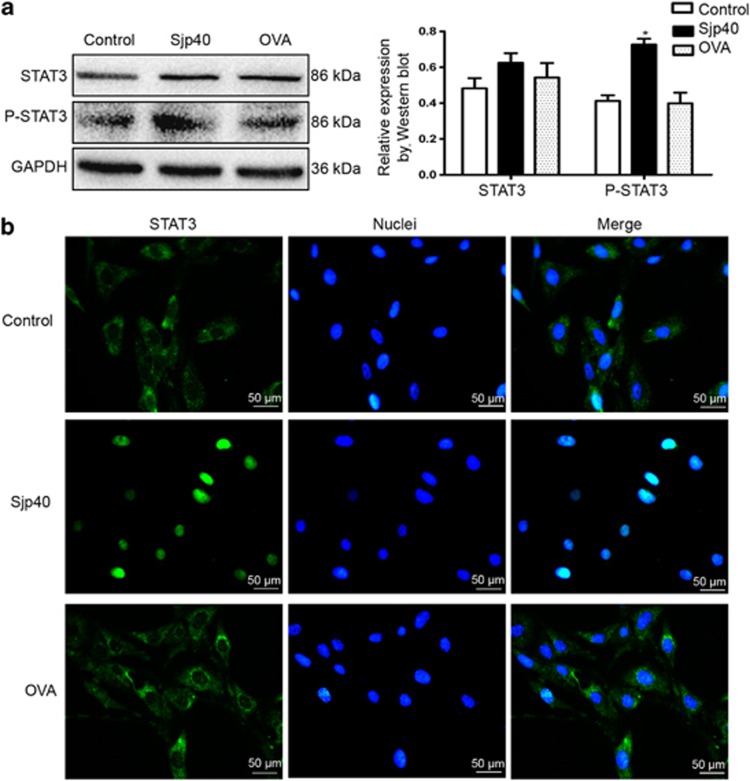
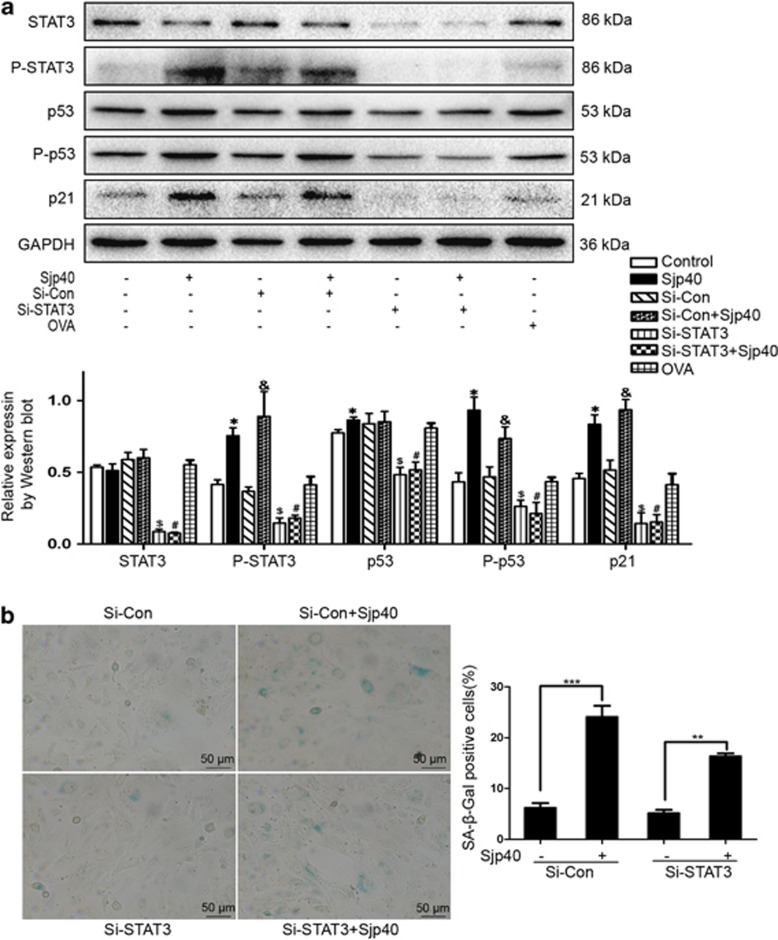
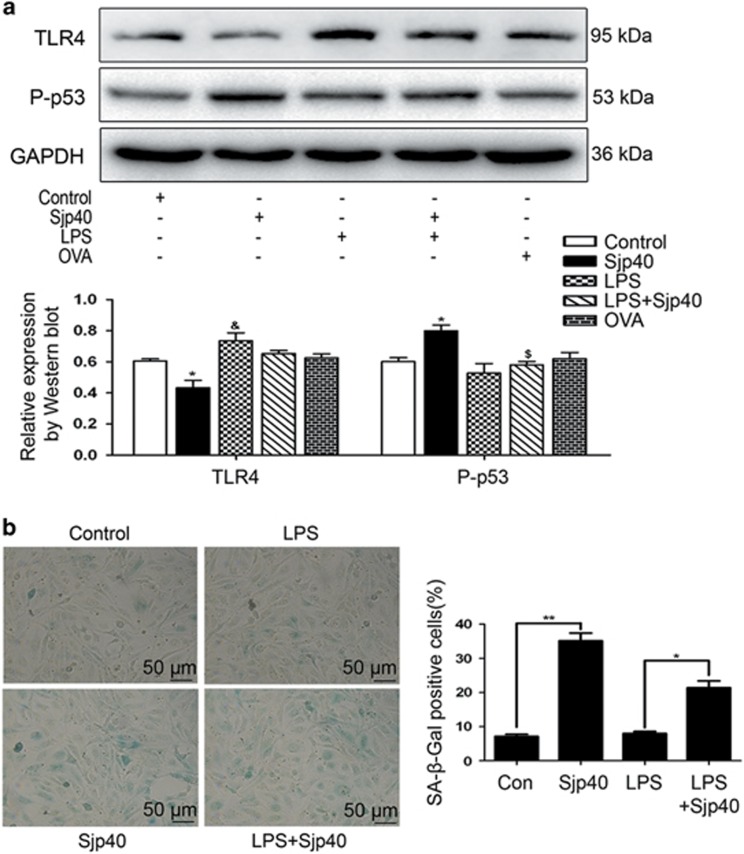
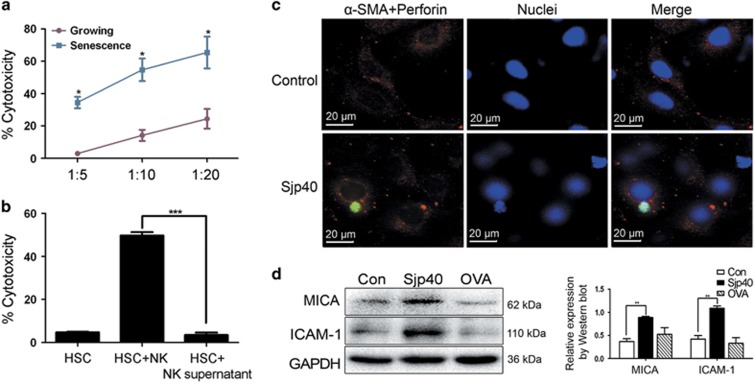
Liver fibrosis is a serious disease that is characterized by the excess deposition of extracellular matrix (ECM) components. Activated hepatic stellate cells (HSCs) are a major source of ECM and serve as a key regulator in liver fibrogenesis. Inactivation of HSCs is essential for liver fibrotic regression. The present study explores the underlying mechanisms of Schistosoma japonicum egg antigen p40 (Sjp40) promoting senescence in HSCs and antifibrosis. For the first time we report that Sjp40 inhibits the activation and proliferation of an immortalized human HSC line (LX-2 cells) and promotes cellular senescence and cell cycle arrest. Sjp40 through action on the STAT3/p53/p21 pathway triggered cellular senescence, while knockdown of p53 or STAT3 partly restored cell senescence. In addition, Sjp40-induced cellular senescence caused LX-2 cells to be more sensitive to a human NK cell line (YT cells). Together these findings provide novel insights into the mechanism of antifibrosis and may have implications for the development of antifibrosis therapies.


Figures

Figure 1
Figure 1
Sjp40 treatment for 48 h suppresses cell activation through the downregulation of α-SMA and collagen type I. (a and b) Protein expression of α-SMA and collagen type I in LX-2 cells treated with different concentrations of Sjp40 (5, 10, 20 and 40 μg/ml) for 48 h were analyzed by western blot. (c) The expression of α-smooth muscle actin mRNA was inhibited by Sjp40 treatment in LX-2 cell. (d) The expression of collagen type I mRNA was inhibited by Sjp40 treatment in LX-2 cell. (e) Protein expression of α-smooth muscle actin in primary activated hepatic stellate cells was diminished by Sjp40 treatment. The graph also shows quantitative analysis of bands by Image J. All values were expressed as the mean±S.E.M. of three or four independent trials. *P<0.05 compared with the normal control group or OVA negative control group. ***P<0.001 compared to control group
Figure 2
Figure 2
Sjp40 induces a senescence-like phenotype and inhibits cell growth in activated HSCs. (a) Effects of Sjp40 (20 μg/ml) on cell senescence in LX-2 cells were determined via senescence-associated β-galactosidase assay (original magnification × 200). Bar: 50 μm. (b) The graph represents quantitative analysis of the percentage of SA-β-Gal-positive cells (%). Data were expressed as the mean±S.E.M. of three or four independent trials. *P<0.05 compared with the control group. (c) Effect of Sjp40 (20 μg/ml) on the proliferation of LX-2 cells. LX-2 cells proliferation was examined using the MTT assay. Data were expressed as the mean±S.E.M. of three or four independent trials. **P<0.01 compared with the control group. (d) Flow cytometric analysis was applied to analyze Sjp40-induced cell cycle arrest of LX-2 cells in the G1 phase. (e) Quantitative analysis of cell cycle distribution graph describing the role of Sjp40 in regulating the G1 phase of cell cycle arrest. Data were expressed as the mean±S.E.M. of three or four independent trials. (f) The expression of Cyclin A and D1 by analysis of western blot. All values were expressed as the mean±S.E.M. of three or four independent trials. *P<0.05 compared with the control group
Figure 3
Figure 3
Sjp40-induced senescence is dependent on the p53 and p21 pathway. (a) Western blot analysis of the expression of p53, P-p53, p21 and p16 in LX-2 cells treated with Sjp40. Data were expressed as the mean±S.E.M. of three or four independent trials. *P<0.05 compared with the control group. #P>0.05 compared with the control group. (b) Knockdown of p53 rescued the Sjp40-induced senescence analyzed by SA-β-Gal assay, and quantitative analysis of the percentage of SA-β-Gal-positive cells (%) was expressed as the mean±S.E.M. of three or four independent trials. *P<0.05 compared with ShRNA-p53 (Sh-p53). ***P<0.001 compared with ShRNA-Control (Sh-Con). Bar: 50  μm. (c) LX-2 cells were transfected with Sh-p53 or Sh-Con and additionally treated with or without Sjp40 for 48 h. The protein expression was investigated by western blot assay and data were expressed as the mean±S.E.M. of three or four independent trials. *P<0.05 compared with the control group; &P<0.05 compared with the Sh-con group. $P<0.05 compared with the control group. #P>0.05 compared with the Sh-p53 group. ϕP<0.05 compared with the Sjp40 group
Figure 4
Figure 4
STAT3 is required for Sjp40-induced senescence in LX-2 cells. (a) Western blot analysis of the expression of STAT3 and P-STAT3 in LX-2 cells treated with the Sjp40. Data were expressed as the mean±S.E.M. of three or four independent trials. *P<0.05 compared with the control group. (b) The Sjp40-induced translocation of STAT3 was detected by immunofluorescence assay. The cells were photographed using a fluorescence microscope. Bar: 50 μm
Figure 5
Figure 5
STAT3 is involved in Sjp40-induced HSC senescence and regulating the senescence-associated signaling pathway. (a) LX-2 cells were transfected with Si-STAT3 (Si-STAT3) or Si-Control (Si-Con) and additionally treated with or without Sjp40. The protein expression was investigated by western blot assay and data were expressed as the mean±S.E.M. of three or four independent trials. *P<0.05 compared with the control group. #P>0.05 compared with the Si-STAT3 group. $P< 0.05 compared with the Si-Con group. &P<0.05 compared with the Si-Con group. (b) Knockdown of STAT3 rescued the Sjp40-induced senescence analyzed by SA-β-Gal assay and quantitative analysis of the percentage of SA-β-Gal-positive cells (%) was expressed as the mean±S.E.M. of three or four independent trials. **P<0.01 compared with the Si-STAT3 group. ***P<0.001 compared with the control group. Bar: 50 μm
Figure 6
Figure 6
The downregulation of TLR-4 in Sjp40-treated LX-2 is associated with cellular senescence. (a) Western blot analysis of the expression levels of P-p53 and TLR-4 in LX-2 cells treated with the Sjp40. Data were expressed as the mean±S.E.M. of three or four independent trials. *P<0.05 compared with the control group; &P<0.05 compared with the control group; $P<0.05 compared with the Sjp40-treated group. (b) Enhanced expression of TLR-4 by LPS restored the Sjp40-induced senescence analyzed by senescence-associated β-galactosidase assay (original magnification × 200) and the graph also reveals quantitative analysis of the percentage of SA-β-Gal-positive cells (%) expressed as the mean±S.E.M. of three or four independent trials. *P<0.05 compared with the LPS-treated group; **P<0.01 compared with control group. Bar: 50 μm
Figure 7
Figure 7
Sjp40-induced senescent LX-2 cells were easily targeted by NK cells. (a) NK cells cytotoxicity measured by crystal violet staining of remaining adherent LX-2 cells was based on crystal violet quantification at OD595. Data were expressed as the mean±S.E.M. of three or four independent trials. *P<0.05 compared with the control group. (b) Senescent LX-2 cells were co-cultured with YT cells or the supernatants from YT cells medium for 12 h. Then, induction of NK cytotoxicity was measured by crystal violet staining of remaining adherent cells. ***P<0.001 compared with the NK supernatant group. (c) The specific NK-HSC adhesion was observed in growing or senescent group by immunofluorescence assay. The cells were photographed using a fluorescence microscope. In these representative images, the α-SMA appears red and the perforin appears green. (d) Western blot analysis of the expression levels of ICAM-1 and MICA in LX-2 cells treated with the Sjp40. Data were expressed as the mean±S.E.M. of three or four independent trials. **P<0.05 compared with the control group

References

    1. Bataller R, Brenner DA. Liver fibrosis. J Clin Invest 2005; 115: 209–218. - PMC - PubMed
    1. Friedman SL. Mechanisms of hepatic fibrogenesis. Gastroenterology 2008; 134: 1655–1669. - PMC - PubMed
    1. Anthony B, Allen JT, Li YS, McManus DP. Hepatic stellate cells and parasite-induced liver fibrosis. Parasit Vectors 2010; 3: 60. - PMC - PubMed
    1. Duval F, Moreno-Cuevas JE, Gonzalez-Garza MT, Rodríguez-Montalvo C, Cruz-Vega DE. Liver fibrosis and protection mechanisms action of medicinal plants targeting apoptosis of hepatocytes and hepatic stellate cells. Adv Pharmacol Sci 2014; 2014: 373295. - PMC - PubMed
    1. Zhang X, Han X, Yin L, Xu L, Qi Y, Xu Y et al. Potent effects of dioscin against liver fibrosis. Sci Rep 2015; 5: 9713. - PMC - PubMed

Publication types

MeSH terms