

Diabetes Stimulates Osteoclastogenesis by Acidosis-Induced Activation of Transient Receptor Potential Cation Channels
- PMID: 27468810
- PMCID: PMC4965751
- DOI: 10.1038/srep30639
Diabetes Stimulates Osteoclastogenesis by Acidosis-Induced Activation of Transient Receptor Potential Cation Channels
Abstract
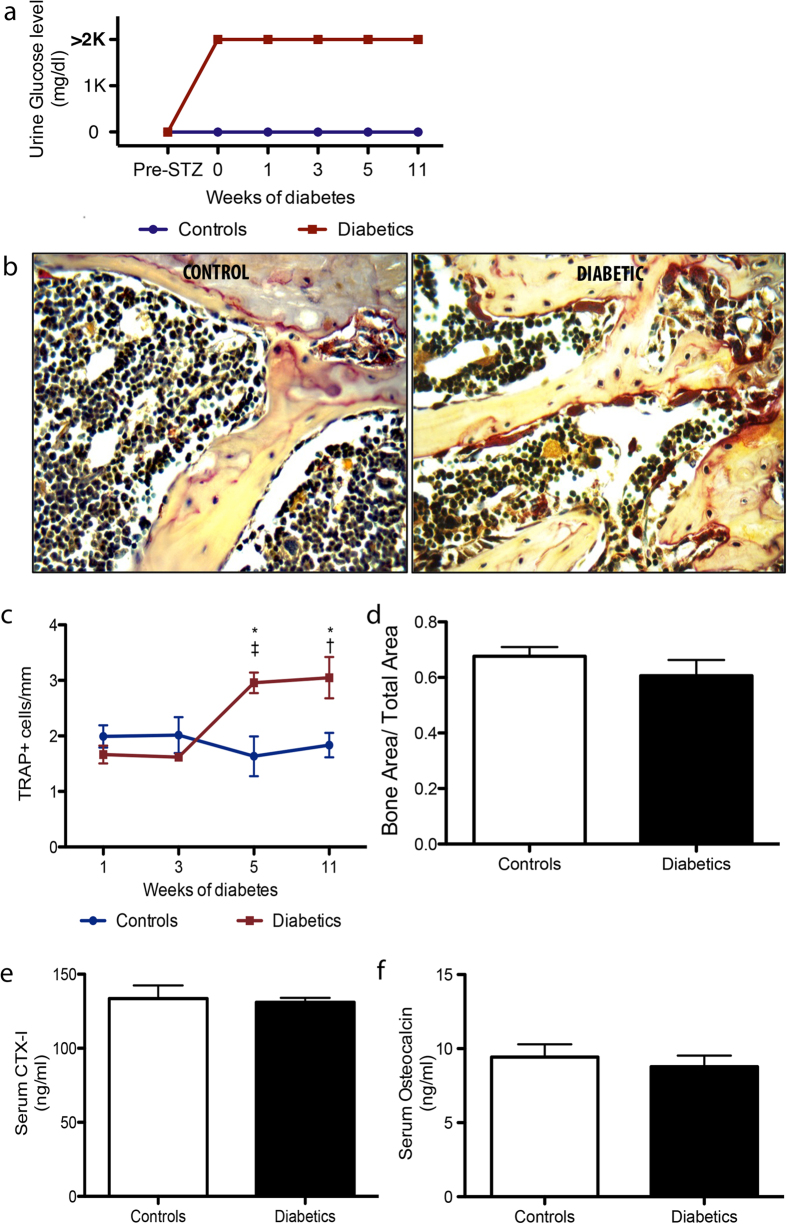
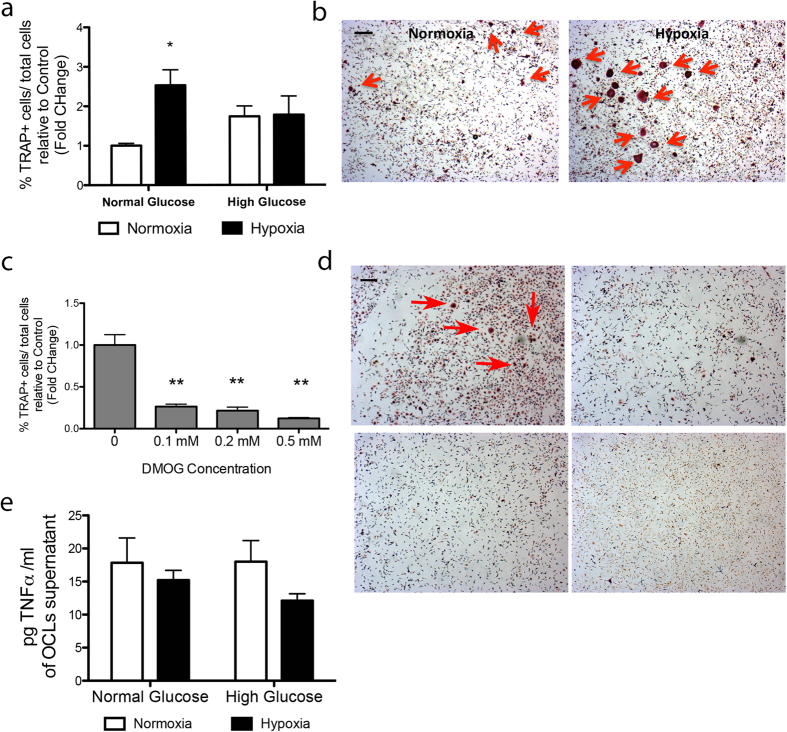
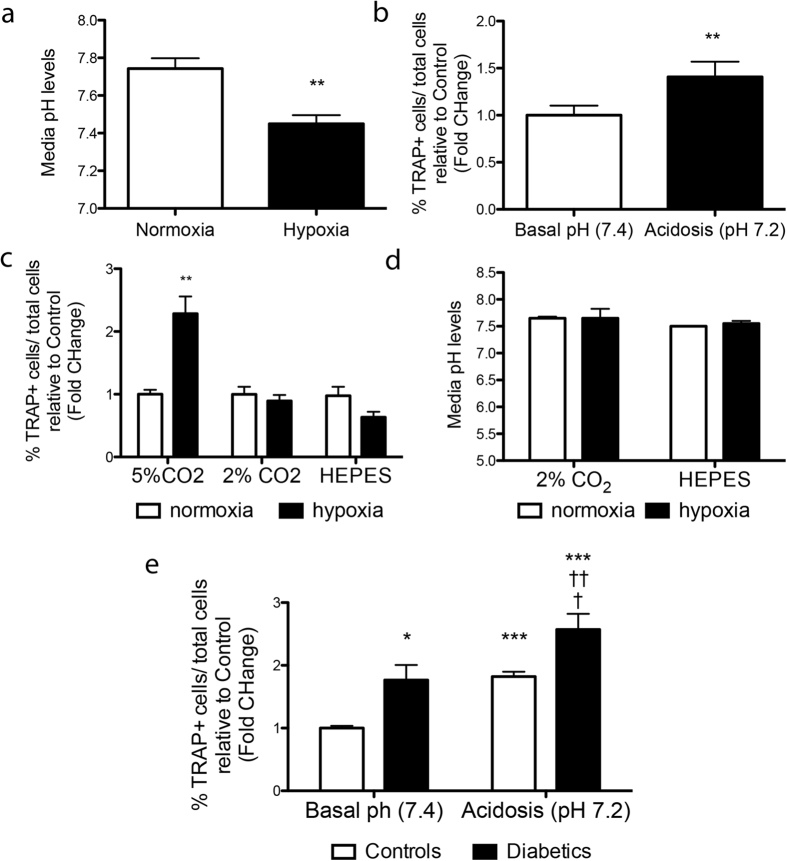
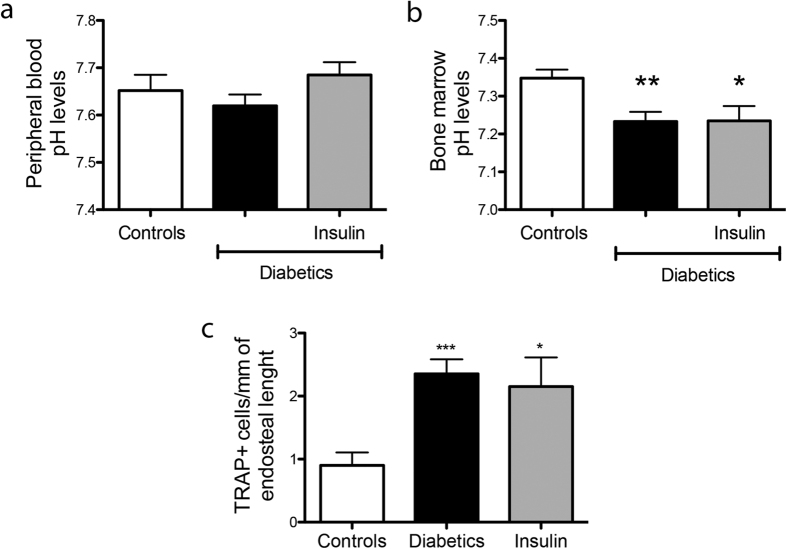
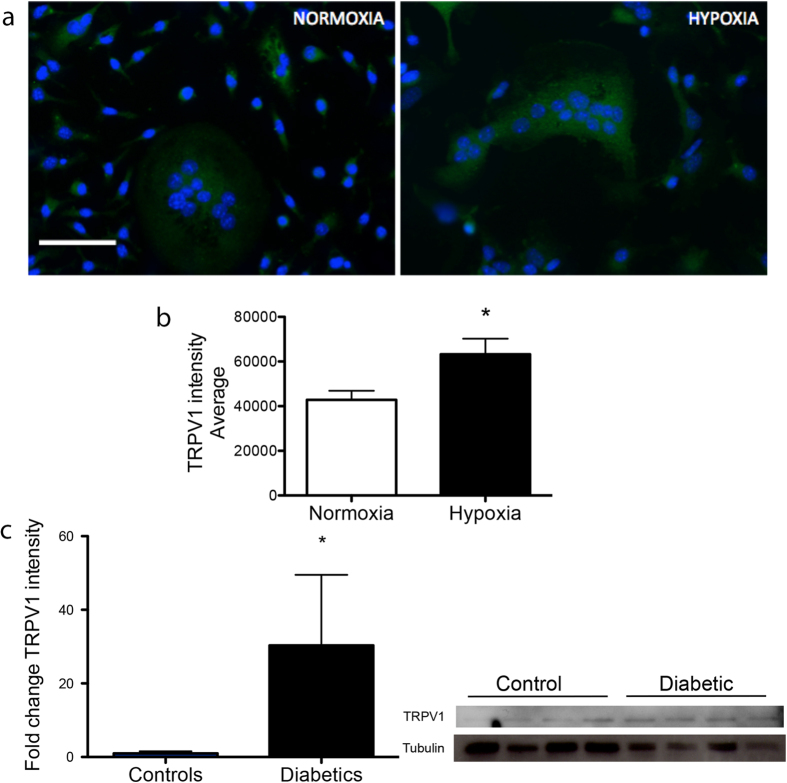
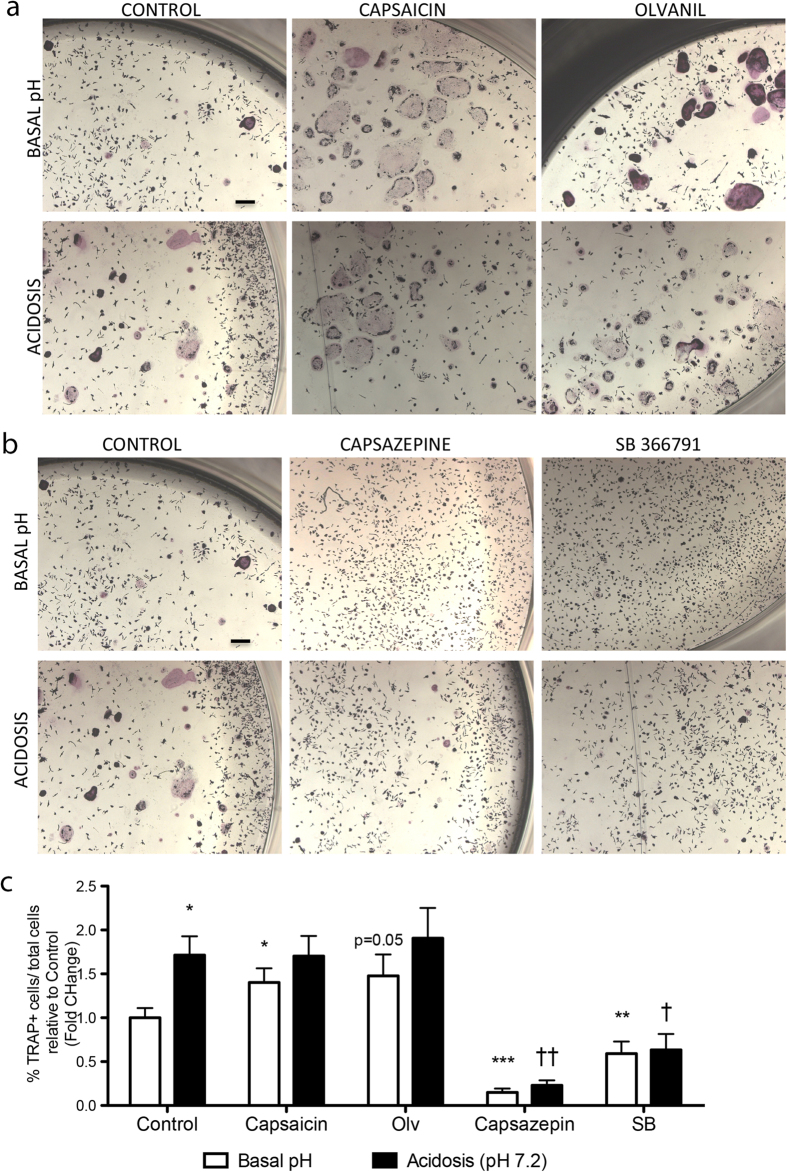
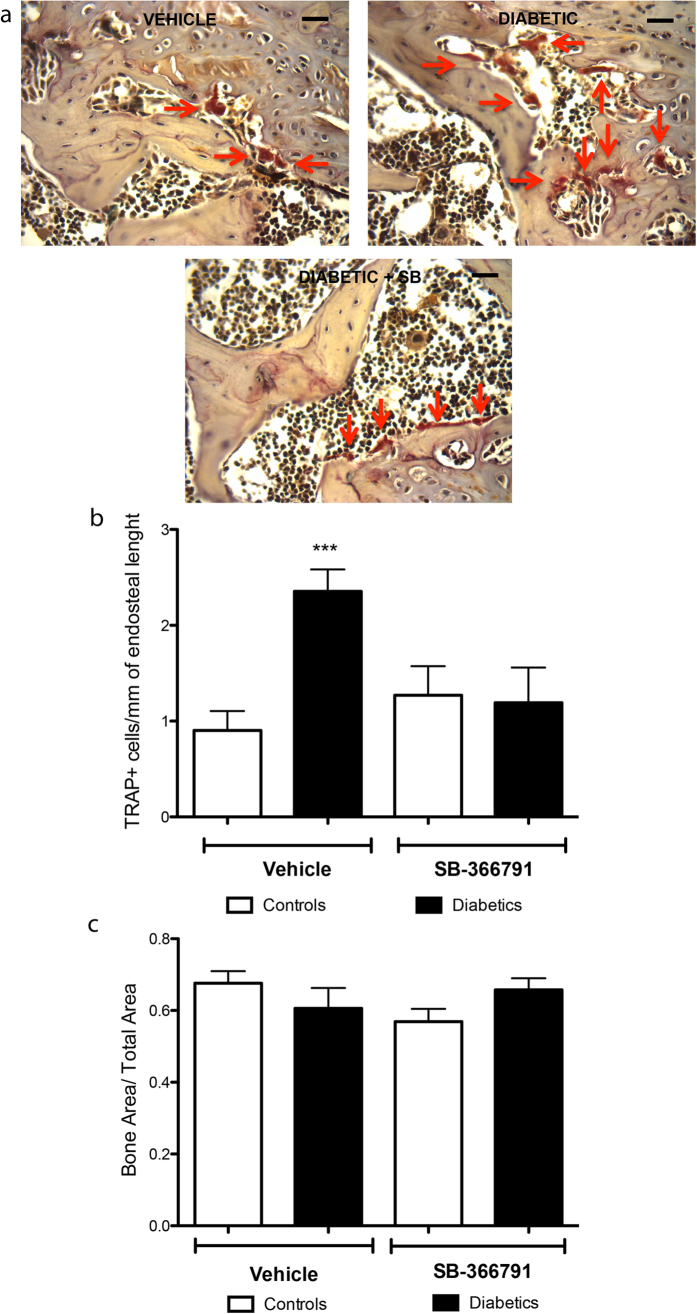
Patients with type 1 diabetes have lower bone mineral density and higher risk of fractures. The role of osteoblasts in diabetes-related osteoporosis is well acknowledged whereas the role of osteoclasts (OCLs) is still unclear. We hypothesize that OCLs participate in pathological bone remodeling. We conducted studies in animals (streptozotocin-induced type 1 diabetic mice) and cellular models to investigate canonical and non-canonical mechanisms underlying excessive OCL activation. Diabetic mice show an increased number of active OCLs. In vitro studies demonstrate the involvement of acidosis in OCL activation and the implication of transient receptor potential cation channel subfamily V member 1 (TRPV1). In vivo studies confirm the establishment of local acidosis in the diabetic bone marrow (BM) as well as the ineffectiveness of insulin in correcting the pH variation and osteoclast activation. Conversely, treatment with TRPV1 receptor antagonists re-establishes a physiological OCL availability. These data suggest that diabetes causes local acidosis in the BM that in turn increases osteoclast activation through the modulation of TRPV1. The use of clinically available TRPV1 antagonists may provide a new means to combat bone problems associated with diabetes.
Figures

Similar articles
-
TRPV1 deletion impaired fracture healing and inhibited osteoclast and osteoblast differentiation.Sci Rep. 2017 Feb 22;7:42385. doi: 10.1038/srep42385. Sci Rep. 2017. PMID: 28225019 Free PMC article.
-
Urokinase receptor mediates osteoclastogenesis via M-CSF release from osteoblasts and the c-Fms/PI3K/Akt/NF-κB pathway in osteoclasts.J Bone Miner Res. 2015 Feb;30(2):379-88. doi: 10.1002/jbmr.2350. J Bone Miner Res. 2015. PMID: 25196912
-
Promotion of osteoclast differentiation and activation in spite of impeded osteoblast-lineage differentiation under acidosis: effects of acidosis on bone metabolism.Biosci Trends. 2013 Feb;7(1):33-41. Biosci Trends. 2013. PMID: 23524891 Review.
-
The role of TRPV channels in osteoporosis.Mol Biol Rep. 2022 Jan;49(1):577-585. doi: 10.1007/s11033-021-06794-z. Epub 2021 Oct 25. Mol Biol Rep. 2022. PMID: 34694549 Review.
-
Low bone turnover and reduced angiogenesis in streptozotocin-induced osteoporotic mice.Connect Tissue Res. 2016 Jul;57(4):277-89. doi: 10.3109/03008207.2016.1171858. Epub 2016 Mar 30. Connect Tissue Res. 2016. PMID: 27028715
Cited by
-
Iron dysregulation, ferroptosis, and oxidative stress in diabetic osteoporosis: Mechanisms, bone metabolism disruption, and therapeutic strategies.World J Diabetes. 2025 Jun 15;16(6):106720. doi: 10.4239/wjd.v16.i6.106720. World J Diabetes. 2025. PMID: 40548284 Free PMC article. Review.
-
Hypoxia mimetics restore bone biomineralisation in hyperglycaemic environments.Sci Rep. 2022 Aug 17;12(1):13944. doi: 10.1038/s41598-022-18067-1. Sci Rep. 2022. PMID: 35977987 Free PMC article.
-
The investigation of energy metabolism in osteoblasts and osteoclasts.Hua Xi Kou Qiang Yi Xue Za Zhi. 2021 Oct 1;39(5):501-509. doi: 10.7518/hxkq.2021.05.002. Hua Xi Kou Qiang Yi Xue Za Zhi. 2021. PMID: 34636196 Free PMC article. Chinese, English.
-
Renal Proximal Tubule Cell Cannabinoid-1 Receptor Regulates Bone Remodeling and Mass via a Kidney-to-Bone Axis.Cells. 2021 Feb 17;10(2):414. doi: 10.3390/cells10020414. Cells. 2021. PMID: 33671138 Free PMC article.
-
Hydrogel-Mediated Release of TRPV1 Modulators to Fine Tune Osteoclastogenesis.ACS Omega. 2022 Mar 9;7(11):9537-9550. doi: 10.1021/acsomega.1c06915. eCollection 2022 Mar 22. ACS Omega. 2022. PMID: 35350319 Free PMC article.
References
-
- Räkel A., Sheehy O., Rahme E. & LeLorier J. Osteoporosis among patients with type 1 and type 2 diabetes. Diabetes Metab. 34, 193–205 (2008). - PubMed
-
- Hofbauer L. C., Brueck C. C., Singh S. K. & Dobnig H. Osteoporosis in patients with diabetes mellitus. J. Bone Miner. Res. 22, 1317–1328 (2007). - PubMed
-
- Leslie W. D., Rubin M. R., Schwartz A. V. & Kanis J. A. Type 2 diabetes and bone. J. Bone Miner. Res. 27, 2231–2237 (2012). - PubMed
-
- Burge R. et al. Incidence and economic burden of osteoporosis-related fractures in the United States, 2005–2025. J. Bone Miner. Res. 22, 465–475 (2007). - PubMed
Publication types
MeSH terms
Substances
Grants and funding
LinkOut - more resources
Full Text Sources
Other Literature Sources
Medical
Miscellaneous
