. 2016 Aug 23;113(34):E4976-84.
doi: 10.1073/pnas.1600749113. Epub 2016 Jul 28.

Atomic-resolution structure of a disease-relevant Aβ(1-42) amyloid fibril

Affiliations

Atomic-resolution structure of a disease-relevant Aβ(1-42) amyloid fibril

Marielle Aulikki Wälti et al. Proc Natl Acad Sci U S A. .

Abstract

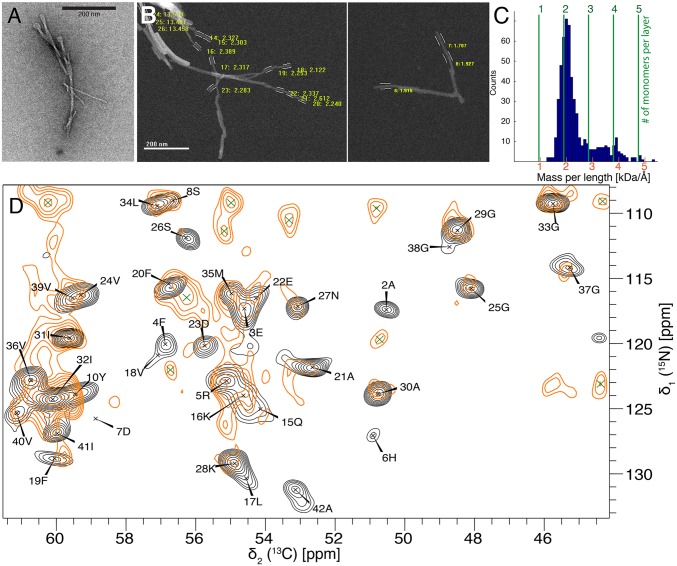
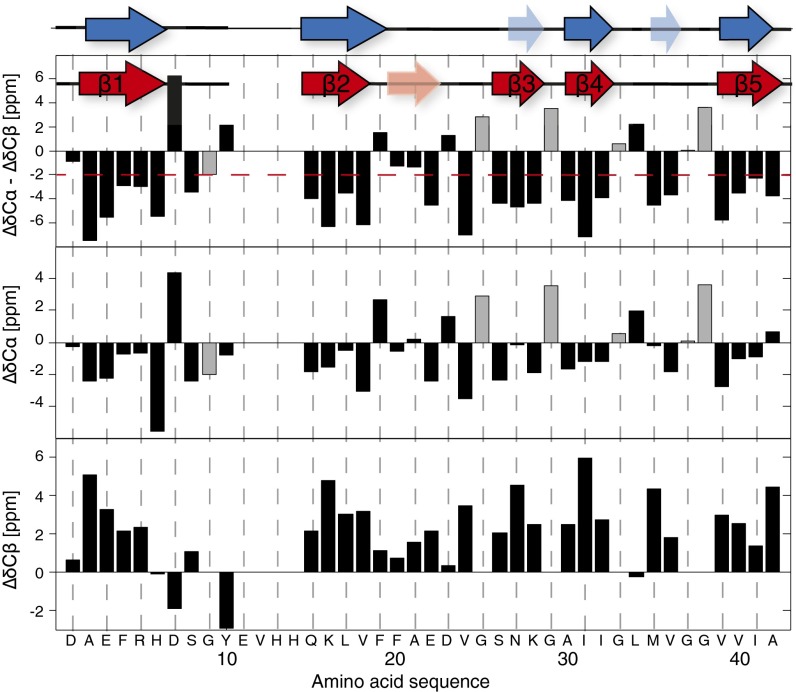
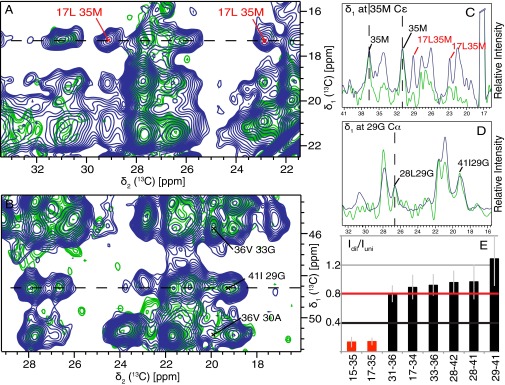
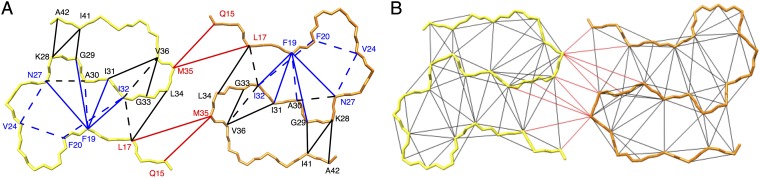
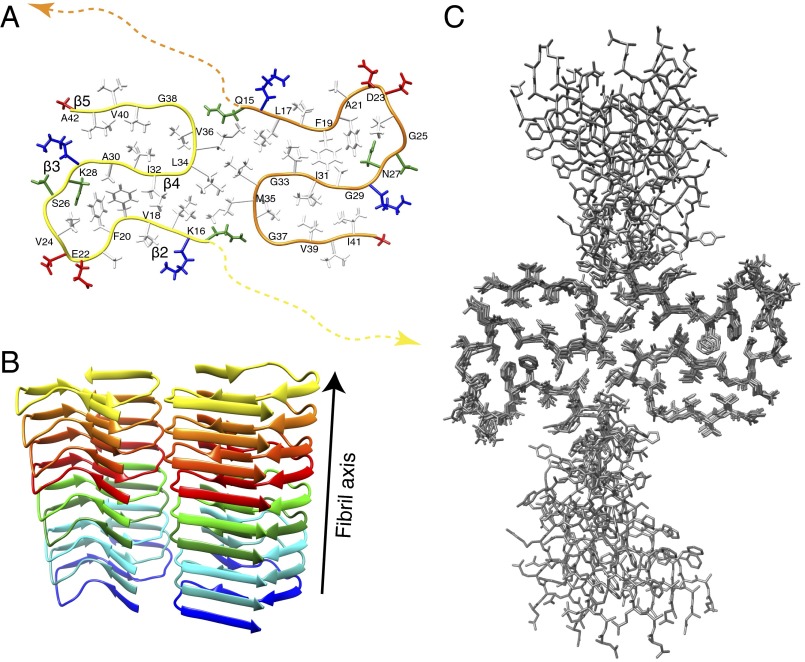
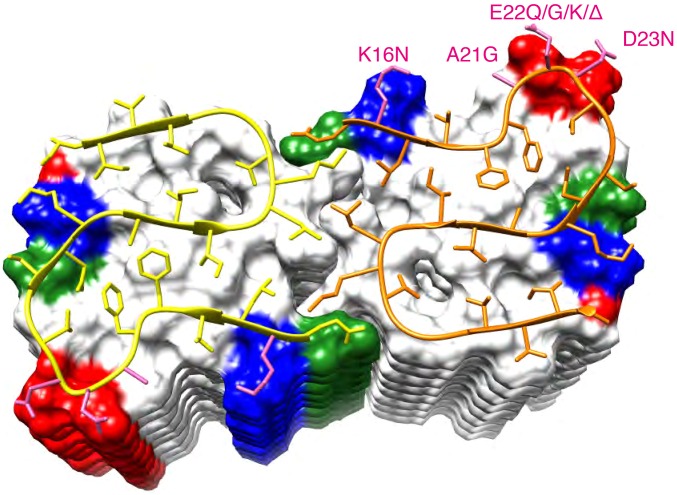
Amyloid-β (Aβ) is present in humans as a 39- to 42-amino acid residue metabolic product of the amyloid precursor protein. Although the two predominant forms, Aβ(1-40) and Aβ(1-42), differ in only two residues, they display different biophysical, biological, and clinical behavior. Aβ(1-42) is the more neurotoxic species, aggregates much faster, and dominates in senile plaque of Alzheimer's disease (AD) patients. Although small Aβ oligomers are believed to be the neurotoxic species, Aβ amyloid fibrils are, because of their presence in plaques, a pathological hallmark of AD and appear to play an important role in disease progression through cell-to-cell transmissibility. Here, we solved the 3D structure of a disease-relevant Aβ(1-42) fibril polymorph, combining data from solid-state NMR spectroscopy and mass-per-length measurements from EM. The 3D structure is composed of two molecules per fibril layer, with residues 15-42 forming a double-horseshoe-like cross-β-sheet entity with maximally buried hydrophobic side chains. Residues 1-14 are partially ordered and in a β-strand conformation, but do not display unambiguous distance restraints to the remainder of the core structure.

Keywords: Alzheimer’s disease; amyloid; protein structure; solid-state NMR.


Conflict of interest statement

The authors declare no conflict of interest.

Figures

Fig. 1.
Fig. 1.
Screening of conditions toward a sample with a single polymorph and reproducibility of the sample preparation. The 2D [13C,13C] DARR spectra (20-ms mixing time, 13 kHz MAS, 14 T B0) of Aβ(1–42) fibrils grown at different conditions. AD show the serine region used to determine the amount of polymorphs in the sample. Aβ(1–42) contains two serines (residues 8 and 26), but under condition 0 (A), at least six serines can be counted. Furthermore, under this condition, the lines are very broad, and no clear defined peaks are observable. Under condition 3 (C) the lines are narrower, but still about 6 serine peaks are visible. For conditions 2 (B) and 4 (D) a single set of resonances is observed, which indicates the presence of only one morphology. (E) Superposition of two 2D [13C,13C] DARR spectra of Aβ(1–42) fibrils grown under condition 2. The spectrum in orange is from the initial sample of the screening, and the spectrum in black is the sample produced subsequently. The two spectra overlay in all regions, showing high structural similarity, and thus the sample preparation is regarded to be reproducible. In addition, the Ser region is indicated by yellow squares.
Fig. 2.
Fig. 2.
Immunological characterization of the Aβ(1–42) fibrils. (A) Dot blot results of the Aβ(1–42) fibrils used for the solid-state NMR experiments show that the fibrils are OC+ and A11. In addition to the solid-state NMR-analyzed Aβ(1–42) fibrils, Aβ(1–40) prefibrillar oligomer mimics, an Aβ(1–42) fibril standard prepared in the C.G.G. laboratory, and Aβ(1–40) monomers were spotted as positive controls for antibodies on each membrane. The Aβ samples on each membrane were then probed with one of the anti-Aβ antibodies (6E10 and 4G8), antiamyloid antisera (i.e., αAPF, A11, and OC), or antioligomer monoclonal antibodies (mAs) (mA55, mA118, mA201, and mA204). The 6E10 and 4G8 are commercially available anti-Aβ antibodies. Amyloid conformation specific antisera, αAPF, A11, and OC, are specific for annular protofibrils (APF), prefibrillar oligomers (A11), and fibrils (OC), respectively. The results show that the Aβ(1–42) fibrils used for the solid-state NMR analysis (top row) were immunoreactive with 6E10, 4G8, and OC, but not αAPF, A11, or by the A11-derived monoclonal antibodies mA55 and m118. The Aβ(1–42) fibrils were positive for mA201 (weakly) and mA204. (B) The Aβ(1–42) fibrils used for the solid-state NMR analysis show reactivity to a subset of selected OC-derived fibril-specific monoclonal antibodies (mOCs). In addition to the fibril sample, the three different Aββ samples in A were probed with 10 mOC monoclonals. The Aβ(1–42) fibrils were immunoreactive with mOC1, mOC3, mOC16, mOC23, and mOC24, but not by mOC9, mOC15, mOC22, mOC29, and mOC31. They are immunologically distinct from the Aβ(1–42) fibril standard made under different conditions that reacts weakly with mOC15, mOC23, and strongly with mOC31. (C) All of the mOC antibodies that showed reactivity with the Aβ(1–42) NMR fibrils from B also stain plaques in human AD brain (mOC 1, mOC3, mOC16, mOC23, and mOC24). Most of the antibodies that fail to react with the Aβ(1–42) NMR fibrils also fail to stain plaques in human brain (mOC9, mOC15, mOC29, and mOC31). mOC22 fails to stain the Aβ(1–42) NMR sample, but stains plaques in human brain. (Magnification: 40×.)
Fig. 3.
Fig. 3.
NMR and STEM measurements of the Aβ(1–42) fibrils highlighting the presence of two symmetric Aβ(1–42) molecules per fibril layer with an in-register parallel β-sheet architecture. (A and B) Negatively stained TEM (A) and two STEM images (B) of different parts of the sample, separated by white line, of unstained, freeze-dried Aβ(1–42) fibrils. Only well-defined nonoverlapping parts, often toward the ends of the fibrils, are used for the MPL measurements and are marked with white lines. (C) Result of the MPL experiment with number of measurements with a given MPL as indicated. The number of monomers per layer of a cross–β-sheet fibril is highlighted with green dotted lines. The data indicate two monomers per layer. (D) A superposition of the NCA spectrum of uniformly 13C,15N-labeled fibrils (plotted in black) with the PAIN spectrum of mixed 15N- and 13C-labeled fibrils (plotted in orange). The superposition of cross-peaks indicates an in-register parallel β-sheet structure. The assignment of the individual cross-peaks in the NCA spectrum are given with single amino acid letter codes. Green crosses indicate i ± 1 correlations.
Fig. 4.
Fig. 4.
Secondary structural elements of the Aβ(1–42) fibrils derived from secondary chemical shifts and from TALOS+. The secondary chemical shifts (ΔδC), which is the difference between measured 13C chemical shifts and corresponding random coil 13C values, are listed vs. the amino acid sequence for 13Cα and 13Cβ, respectively. Stretches of three continuous residues with ΔδCα – ΔδCβ < –2 ppm were identified and used as an indication of β-sheet secondary structure. The resulting five β-strands are highlighted on top by red arrows. The pale red arrow denotes three additional negative (ΔδC) in a row, but not fulfilling the ΔδCα – ΔδCβ < –2 ppm criterion. Alternatively, a TALOS+ analysis was performed, and the predicted five β-strands are indicated with blue arrows. Two stretches with only two residues in the β-strand conformation are indicated in pale blue. The glycines Cα shift is shown in gray.
Fig. 5.
Fig. 5.
Extracts of NMR spectra that distinguish intramolecular from intermolecular contacts. (A and B) Superposition of 2D PAR spectra recorded on a uniformly 15N,13C- labeled sample (blue contours) and on a sample of 25% uniformly 15N,13C-labeled Aβ(1–42) and 75% unlabeled Aβ(1–42) (green contours). (C and D) Selected and indicated cross-sections of the PAR spectra shown in A and B, respectively, are displayed. Corresponding spectral traces of the individual spectra of the two samples were compared by scaling the intraresidue or sequential peak intensity (for nonoverlapping peaks) for the diluted sample to the one of the uniformly labeled one. (E) Intensity ratios of cross-peaks from the diluted and uniformly labeled samples. Intermolecular and intramolecular correlations, expected to be attenuated to 25% and not attenuated, are shown as red and black bars, respectively. The full statistics are shown in SI Appendix, Fig. S5. (C) Trace extracted at the M35 Cε-resonance from the PAR spectra of uniformly (blue) and diluted (green) labeled samples. All cross-peaks of this resonance are of intermolecular nature. (D) Trace extracted at the G29 Cα-resonance from the PAR spectra of uniformly (blue) and diluted (green) labeled samples. All cross-peaks of this resonance are of intramolecular nature. Cross-peaks used to scale the two spectra are marked in C and D. Cross-peaks were classified as intramolecular contacts if the intensity ratio Idil/IUni > 0.8 with a SD margin of >0.4. Cross-peaks were classified as intermolecular contacts if the intensity ratio Idil/IUni < 0.4 with a SD margin of <0.8. No classification was done in any other cases. Details on the experimental parameters and conditions are given in SI Appendix, Fig. S5.
Fig. 6.
Fig. 6.
(A) Distance restraints used for the manual structure calculations are plotted onto the final 3D structure. Distance restraints between residues (indicated by one-letter code) are color-coded in red for intermolecular restraints, black for intramolecular ones, and solid blue for unambiguous restraints (within 0.2 ppm), which could be either of intermolecular or intramolecular nature, respectively. Dashed blue lines restraints with low ambiguity as shown in SI Appendix, Table S2. The 3D structure is represented by the backbone of the two symmetric Aβ(1–42) molecules in one layer color-coded yellow and orange. (B) The distance restraints assigned during the automatic structure calculation by CYANA are displayed on its corresponding 3D structure. Only a single line per residue pair is plotted, even if several restraints exist.
Fig. 7.
Fig. 7.
The 3D structure of Aβ(1–42) fibrils. (A) Detailed 3D structure of Aβ(1–42) fibrils represented with the conformer showing the smallest CYANA target function. The backbone of the two point symmetric molecules are shown as yellow and orange spines. The 3D structure of the N-terminal residues 1–14 is indicated by dotted lines. The side chains of the positively charged residues are shown in red, the negatively charged in blue, the hydrophobic residues in white, and polar residues in green. Every second residue is labeled with the one-letter amino acid code. (B) A ribbon-based cartoon of the Aβ(1–42) fibrils showing nine molecules of Aβ(1–42) along the fibril axis. Individual molecules are colored following rainbow colors. (C) A bundle of the 10 conformers having an rmsd of 0.89 Å representing the 3D structure is shown.
Fig. 8.
Fig. 8.
Ribbon diagram of the core structure of residues 15–42 of Aβ(1–42) within the fibril. The C2 symmetric molecules are shown as yellow and orange spines, respectively. The β-strands are indicated by arrows. The following molecules within the fibril are shown by a surface representation. Positively and negatively charged surface patches are shown in blue and red, respectively, and all hydrophobic residues in white and polar residues in green. Indicated in pink and labeled accordingly are the residues with known familial Alzheimer’s mutations.

Comment in

References

    1. Masters CL, et al. Amyloid plaque core protein in Alzheimer disease and Down syndrome. Proc Natl Acad Sci USA. 1985;82(12):4245–4249. - PMC - PubMed
    1. Glenner GG, Wong CW. Alzheimer’s disease and Down’s syndrome: Sharing of a unique cerebrovascular amyloid fibril protein. Biochem Biophys Res Commun. 1984;122(3):1131–1135. - PubMed
    1. Kang J, et al. The precursor of Alzheimer’s disease amyloid A4 protein resembles a cell-surface receptor. Nature. 1987;325(6106):733–736. - PubMed
    1. Costanzo M, Zurzolo C. The cell biology of prion-like spread of protein aggregates: Mechanisms and implication in neurodegeneration. Biochem J. 2013;452(1):1–17. - PubMed
    1. Selkoe DJ, Hardy J. The amyloid hypothesis of Alzheimer’s disease at 25 years. EMBO Mol Med. 2016;8(6):595–608. - PMC - PubMed

Publication types

MeSH terms

Associated data