. 2016 Aug 16;113(33):9375-80.
doi: 10.1073/pnas.1602960113. Epub 2016 Jul 28.

FAR-RED ELONGATED HYPOCOTYL3 activates SEPALLATA2 but inhibits CLAVATA3 to regulate meristem determinacy and maintenance in Arabidopsis

Affiliations

FAR-RED ELONGATED HYPOCOTYL3 activates SEPALLATA2 but inhibits CLAVATA3 to regulate meristem determinacy and maintenance in Arabidopsis

Dongming Li et al. Proc Natl Acad Sci U S A. .

Abstract

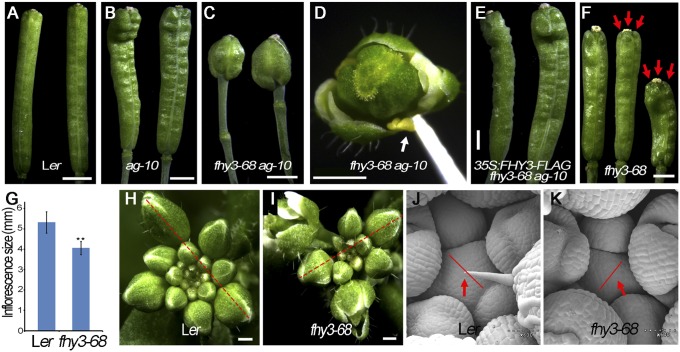
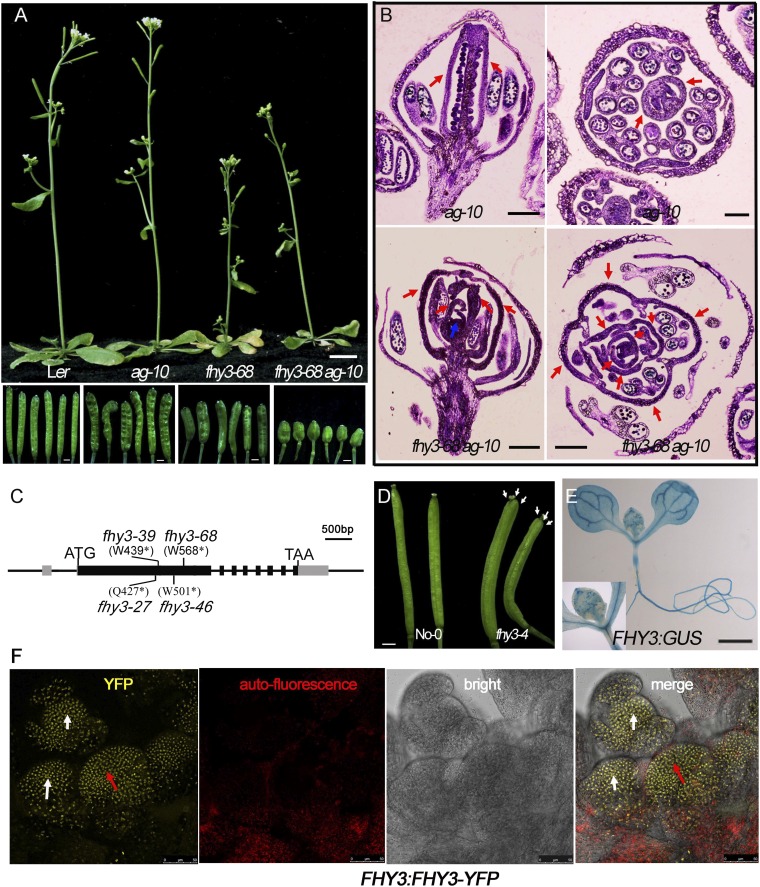
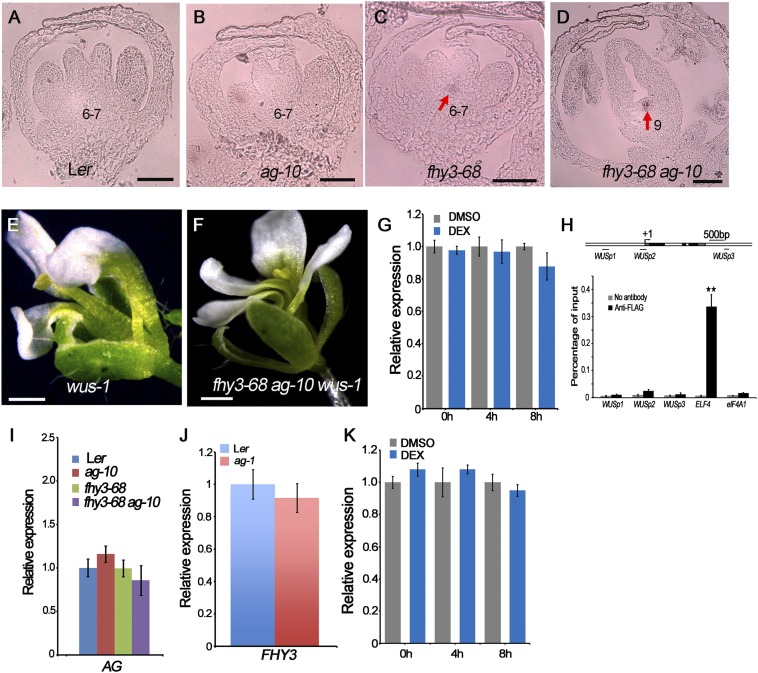
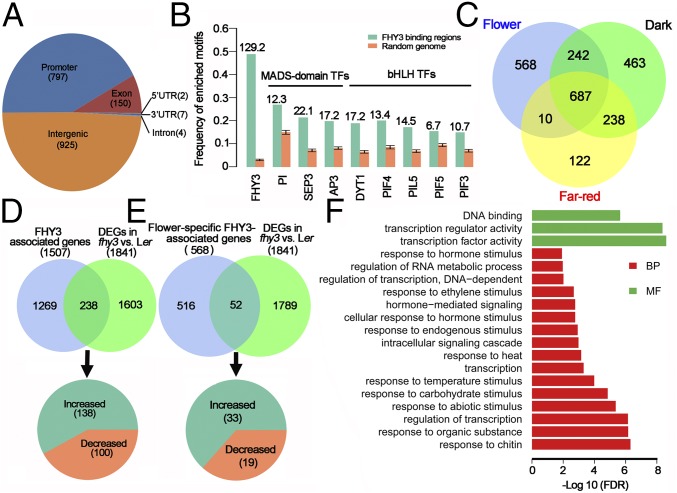
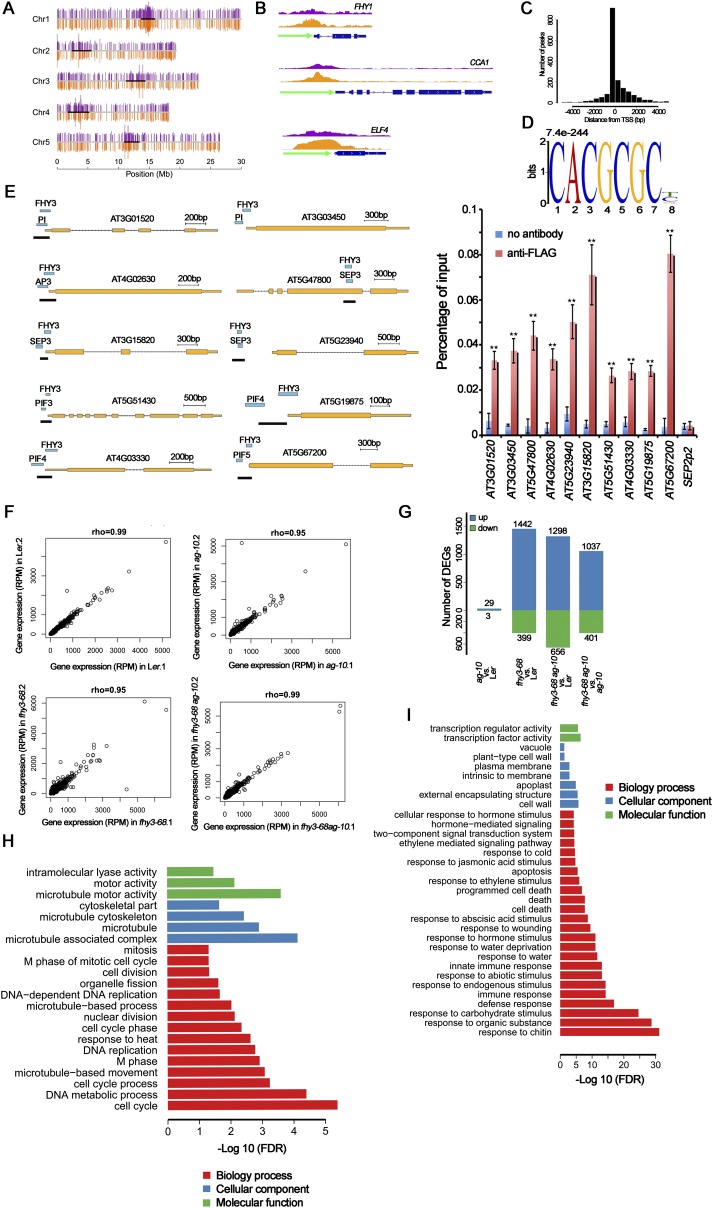
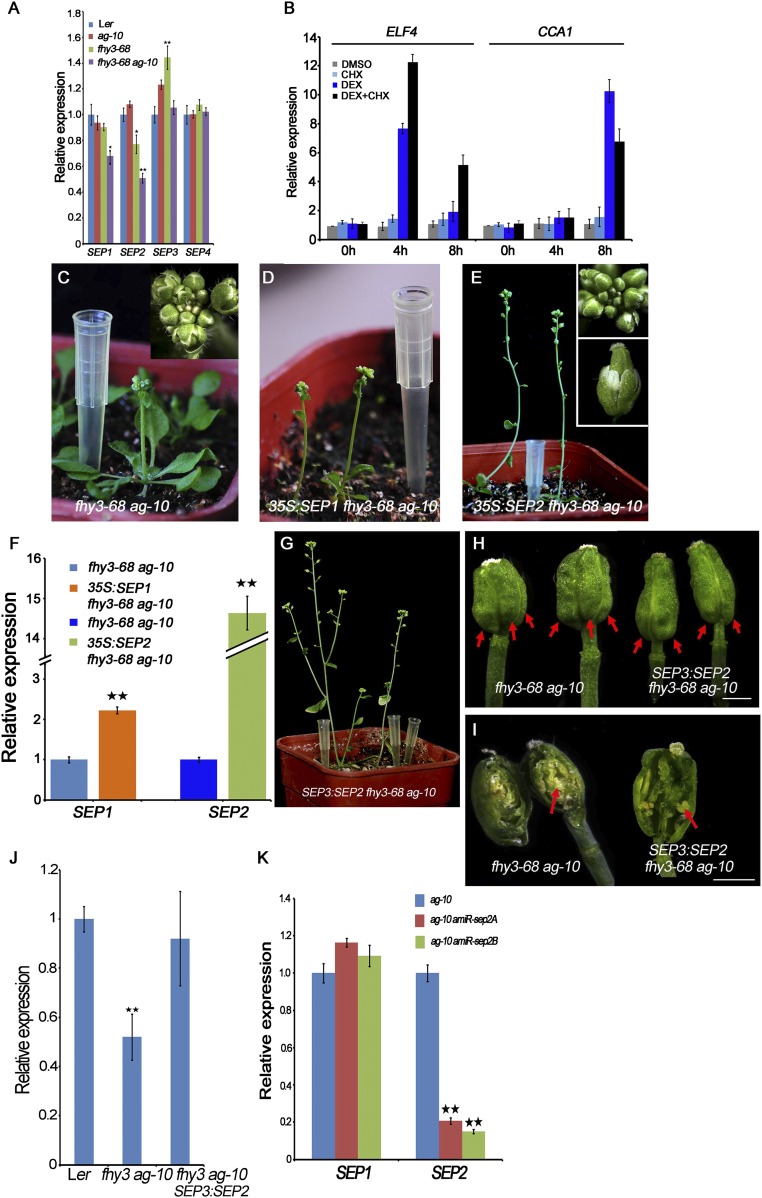
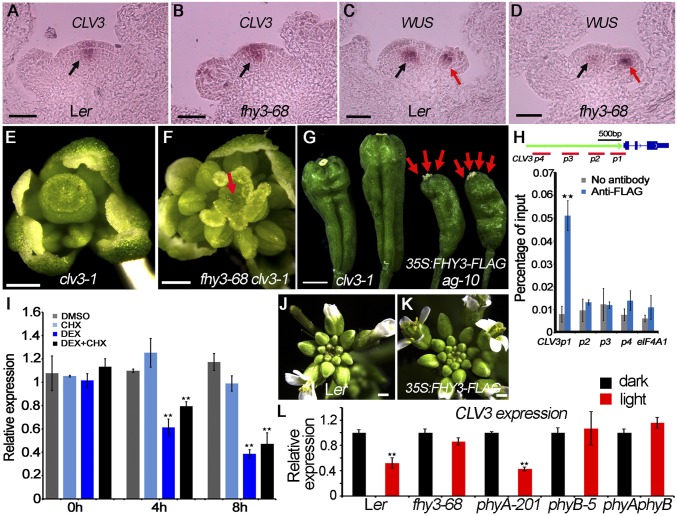
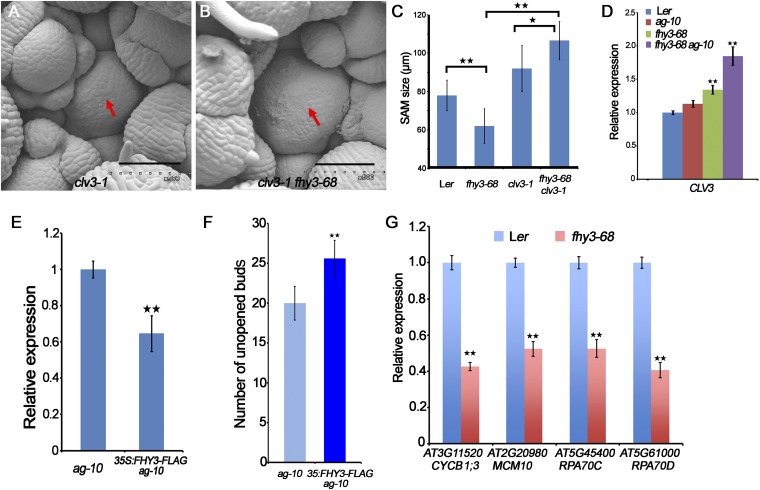
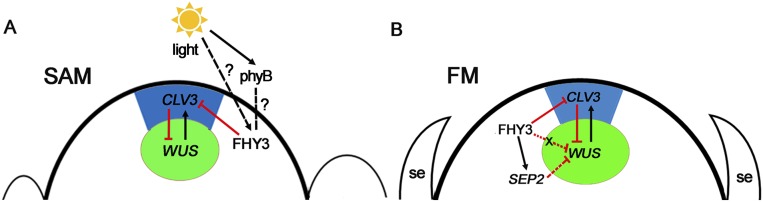
Plant meristems are responsible for the generation of all plant tissues and organs. Here we show that the transcription factor (TF) FAR-RED ELONGATED HYPOCOTYL3 (FHY3) plays an important role in both floral meristem (FM) determinacy and shoot apical meristem maintenance in Arabidopsis, in addition to its well-known multifaceted roles in plant growth and development during the vegetative stage. Through genetic analyses, we show that WUSCHEL (WUS) and CLAVATA3 (CLV3), two central players in the establishment and maintenance of meristems, are epistatic to FHY3 Using genome-wide ChIP-seq and RNA-seq data, we identify hundreds of FHY3 target genes in flowers and find that FHY3 mainly acts as a transcriptional repressor in flower development, in contrast to its transcriptional activator role in seedlings. Binding motif-enrichment analyses indicate that FHY3 may coregulate flower development with three flower-specific MADS-domain TFs and four basic helix-loop-helix TFs that are involved in photomorphogenesis. We further demonstrate that CLV3, SEPALLATA1 (SEP1), and SEP2 are FHY3 target genes. In shoot apical meristem, FHY3 directly represses CLV3, which consequently regulates WUS to maintain the stem cell pool. Intriguingly, CLV3 expression did not change significantly in fhy3 and phytochrome B mutants before and after light treatment, indicating that FHY3 and phytochrome B are involved in light-regulated meristem activity. In FM, FHY3 directly represses CLV3, but activates SEP2, to ultimately promote FM determinacy. Taken together, our results reveal insights into the mechanisms of meristem maintenance and determinacy, and illustrate how the roles of a single TF may vary in different organs and developmental stages.

Keywords: CLV3; FHY3; SEP2; meristem determinacy; meristem maintenance.


Conflict of interest statement

The authors declare no conflict of interest.

Figures

Fig. 1.
Fig. 1.
FHY3 is required for FM determinacy and SAM maintenance. (A–C, E, and F) Siliques of Ler (A), ag-10 (B), fhy3-68 ag-10 (C), 35S:FHY3-FLAG fhy3-68 ag-10 (E), and fhy3-68 (F). Carpels marked by red arrows in F. (D) Flowers of fhy3-68 ag-10. Sterile anthers are marked by a white arrow in D. (G) Quantification of inflorescence size (mm) of Ler (n = 15) and fhy3-68 (n = 15). **P < 0.01. (H and I) Inflorescences of Ler (H) and fhy3-68 (I). Dashed lines mark the width used to measure inflorescence size in G. (J and K) SAM (marked by a red arrow) of Ler (J) and fhy3-68 (K). Red lines mark the width of SAM. (Scale bars: 1 mm in A–C, E, and F; 250 µm in D; 500 µm in H and I; 60 µm in J and K.)
Fig. S1.
Fig. S1.
Various FHY3 mutants and their phenotypes in the wild-type and ag-10 backgrounds. (A) Phenotype of indicated plants (Upper) and siliques (Lower). All siliques of fhy3-68 ag-10 plant are bulged and short. (B) Longitudinal (Left) and transversal (Right) sections of indicated plants siliques. Although ag-10 produced two fused carpels (red arrows), the indeterminate floral meristem (blue arrow) of fhy3-68 ag-10 continued to generate additional organs inside the carpels (red arrows). (C) Gene diagram of FHY3 and the locations of mutations in the various fhy3 mutants used in this work. ATG and TAG correspond to the start and stop codons, respectively. The gray and black rectangles represent the 5′ or 3′ UTRs and coding regions, respectively. The black lines represent introns or intergenic regions. All mutations are nonsense mutations. (Scale bar, 500 bp.) (D) Siliques of No-0 (Left) and fhy3-4 (Right) plants. fhy3-4 siliques had three fused carpels (marked by white arrows). (E) Tissue-specific expression of FHY3 using FHY3:GUS transgenic plant. FHY3 is universally expressed in the seedling and SAM (Inset). (F) FHY3-YFP signal in the SAM and FM of FHY3:FHY3-YFP. Red arrows indicate YFP signal in SAM and white arrows indicate YFP signal in FM. [Scale bars: 1 cm in A (Upper) and 1 mm (Lower); 200 µm in B; 1 mm in D and E; and 50 µm in F.]
Fig. S2.
Fig. S2.
Molecular and genetic analysis of WUS and AG and FHY3 in FM determinacy. (A–D) In situ hybridization examining the WUS expression pattern (marked by a red arrow) in Ler (A), ag-10 (B), fhy3-68 (C), and fhy3-68 ag-10 (D). Floral development stage was marked. (Scale bars, 100 µm.) (E and F) Flower phenotypes of wus-1 (E) and fhy3-68 ag-10 wus-1 (F). (Scale bars, 500 µm.) (G) The WUS transcript abundance in FHY3:FHY3-GR fhy3-4 inflorescences measured by real-time PCR. Inflorescences containing stage 8 and younger flowers were treated with DEX or DMSO and then harvested at the indicated time point. UBQ5 served as the internal control. Three biological replicates were performed. (H) ChIP with anti-FLAG antibody to examine FHY3 binding at WUS in 35S:3FLAG-FHY3-3HA fhy3-4 inflorescences. The regions examined are diagrammed in the upper row, with “+1” indicating the TSS. The gray, black, and white rectangles represent the 5′ or 3′ UTR, coding regions, and introns or intergenic regions, respectively. (Scale bar, 500 bp). ELF4, a FHY3 target gene, served as a positive control, and eIF4A1 (EU.K.ARYOTIC TRANSLATION INITIATION FACTOR 4A1) served as a negative control. Error bars represent SD from three biological repeats. No significant FHY3 occupancy was detected at WUS. **P < 0.01. (I and J) Real-time RT-PCR to measure AG (I) and FHY3 (J) transcript levels in the indicated plants. UBQ5 served as the internal control. Three biological replicates were performed. Error bars represent SD from three biological repeats. (K) Real-time RT-PCR to measure AG transcript levels in FHY3:FHY3-GR fhy3-4 inflorescences. Inflorescences containing stage 8 and younger flowers were treated with DEX or DMSO (control) then harvested at the indicated time point. UBQ5 served as the internal control. Three biological replicates were performed. Error bars represent SD from three biological repeats. No significant change in AG transcript levels in the DEX-treated sample compared with the DMSO control indicated that FHY3 does not directly regulate AG expression.
Fig. 2.
Fig. 2.
Genome-wide identification of FHY3 binding sites and target genes. (A) Classification of FHY3 binding sites in the Arabidopsis genome. The numbers of binding sites are indicated in parentheses. (B) The binding motifs of several TFs were significantly enriched around the FHY3 binding peaks compared with randomly selected genomic regions. The numbers on the top of columns are z-scores computed from the permutation test. A z-score of 2 or above is considered statistically significant. (C) Venn diagram showing the number and overlap of FHY3-associated genes in flower and seedling under D and FR conditions. (D and E) The FHY3 ChIP-seq data and RNA-seq data were compared to identify FHY3 target genes (D) and flower-specific FHY3 target genes (E). (F) Enrichment of GO terms among flower-specific FHY3 target genes. BP, biological process; MF, molecular function.
Fig. S3.
Fig. S3.
ChIP-seq and RNA-seq analysis of FHY3 binding sites. (A) Distribution of FHY3 binding sites on the five Arabidopsis chromosomes. The top purple bars and bottom orange bars on each chromosome represent the positions of the FHY3 binding sites from two biological replicates. The scale at the bottom indicates chromosome positions. (B) FHY3 binding sites were found in the promoter region of three known FHY3 target genes FHY1, CCA1, and ELF4. FLAG-FHY3 peaks (purple and orange) from two biological replicates and gene structure are shown in the top, middle, and bottom rows, respectively. (C) FHY3 binding sites are highly enriched in the regions around the TSS. (D) The typical FBS motif (CACGCGC, E-value = 7.4e-244) was identified as a statistically significant motif in the FHY3 binding regions in flower. (E) ChIP-PCR to verify the colocalization of FHY3 and indicated TFs. FLAG-FHY3 and TFs peaks, gene structures and the regions examined by ChIP (marked by black lines) are shown (Left). ChIP to measure FHY3 occupancy at loci in 35S:3FLAG-FHY3-3HA fhy3-4 inflorescences (Right). SEP2P2 served as a negative control. Error bars represent SD from three biological replicates. **P < 0.01 compared with no antibody (negative control). (F) Scatterplots of gene expression data from two replicates for each sample. Expression level was normalized to reads per million (RPM). Spearman correlation coefficients were calculated as an indicator of reproducibility between replicates. (G) Number of DEGs identified in pairwise comparisons of RNA-seq data. (H and I) Significantly enriched GO terms in the down-regulated genes (H) and up-regulated genes (I) in fhy3-68 vs. Ler (genes from G).
Fig. 3.
Fig. 3.
SEP2 mediates the function of FHY3 in FM determinacy. (A) The FHY3-FLAG ChIP-seq peaks (two biological replicates) at SEP1 and SEP2 revealed in IGV. FLAG-FHY3 peaks (purple and orange), gene structure, and the regions examined by ChIP are shown in the top, middle, and bottom rows, respectively. (Scale bars, 500 bp.) (B) ChIP to measure FHY3 occupancy at SEP1 and SEP2 in 35S:3FLAG-FHY3-3HA fhy3-4 inflorescences. The regions examined are shown in A. eIF4A1 served as a negative control. Error bars represent SD from three biological replicates. **P < 0.01 compared with no antibody (negative control). (C) The transcript levels of SEP1 and SEP2 in FHY3:FHY3-GR fhy3-4 inflorescences measured by RT-qPCR. Ubiquitin 5 (UBQ5) served as the internal control. Three biological replicates were performed. Error bars represent SD from three biological repeats. **P < 0.01. (D and E) Siliques from plants of the indicated genotypes. Carpels were indicated by red arrows; Sliced open siliques were indicated by white arrows. (Scale bars, 1 mm.)
Fig. S4.
Fig. S4.
SEP2 mediates the function of FHY3 in FM determinacy. (A) The transcript levels of SEPs in the indicated plants measured by RT-PCR. Inflorescences containing stage 8 and younger flowers were used. (B) The transcript levels of ELF4 and CCA1 in FHY3:FHY3-GR fhy3-4 inflorescences measured by RT-qPCR served as a positive control of Fig. 3C. (C–E) Plants and inflorescences (Inset) of fhy3-68 ag-10 (C), 35S:SEP1 fhy3-68 ag-10 (D), and 35S:SEP2 fhy3-68 ag-10 (E). (F) The SEP1 and SEP2 transcript levels in transgenic plants measured by real-time RT-PCR. (G) Plant of SEP3:SEP2 fhy3-68 ag-10 transgenic plant. The plant developed normally at the vegetative stage. SEP3:SEP2 transgene mainly rescued the FM determinacy defects of fhy3-68 ag-10. However, the smaller inflorescence, shorter petal and sterile anther phenotypes were not rescued. (H) Siliques from plants of the indicated genotypes. The siliques of SEP3:SEP2 fhy3-68 ag-10 were composed of two carpels and were thinner than those of fhy3-68 ag-10. Carpels were indicated by red arrows. (I) Representative sliced-open siliques of indicated plants. Removing the primary carpels from fhy3-68 ag-10 siliques revealed additional floral organs growing inside (red arrow). No more layered carpeliod organs except of stamenoid organs (red arrow) grew inside of the silique of SEP3:SEP2 fhy3-68 ag-10 as in fhy3-68 ag-10, indicating that SEP3:SEP2 transgene mainly rescued the FM indeterminacy of fhy3-68 ag-10. (J) The transcript levels of SEP2 in indicated plants measured by real-time RT-PCR. (K) The transcript levels of SEP1 and SEP2 in amiR-sep2 transgenic plants measured by real-time RT_PCR. In A, B, F, G, and K UBQ5 served as the internal control. Three biological replicates were performed. Error bars represent SD from three biological repeats. *P < 0.05 and **P < 0.01. (Scale bars in H and I, 1 mm.)
Fig. 4.
Fig. 4.
CLV3 mediates FHY3 functions in regulating the stem cell pool in the SAM and FM meristem activity. (A–D) In situ hybridization to examine the expression of CLV3 (A and B) and WUS (C and D) in Ler (A and C) and fhy3-68 (B and D). CLV3 signals are marked by a black arrow in A and B. WUS signals are marked by a black arrow in SAM and a red arrow in FM in C and D. (E and F) Flowers of clv3-1 (E) and fhy3-68 clv3-1 (F). Dome-shaped meristem is marked by a red arrow. (G) Representative siliques of clv3-1 (Left) and 35S:FHY3-FLAG ag-10 (Right) plants. Carpels are marked by red arrows. (H) ChIP to measure FHY3 occupancy at CLV3 in 35S:3FLAG-FHY3-3HA fhy3-4 inflorescences. The regions examined are shown on the Upper panel. CLV3 gene structure was shown. (Scale bar, 500 bp.) eIF4A1 served as a negative control. Error bars represent SD from three biological replicates. **P < 0.01 compared with no antibody (negative control). (I) The CLV3 transcript levels in FHY3:FHY3-GR fhy3-4 inflorescences measured by RT-qPCR. (J and K) Inflorescence of Ler (J) and 35S:FHY3-FLAG (K). 35S:FHY3-FLAG developed a larger inflorescence containing more unopened buds than Ler. (L) The CLV3 transcript levels in seedlings of indicated plants after light treatment measured by RT-qPCR. In I and L, UBQ5 served as the internal control. Three biological replicates were performed. Error bars represent SD from three biological repeats. **P < 0.01. (Scale bars: 50 µm in A–D and 500 µm in E–G, J, and K.)
Fig. S5.
Fig. S5.
Genetic and expression analysis of CLV3 and FHY3. (A and B) SAM (marked by a red arrow) of clv3-1 (A) and fhy3-68 clv3-1 (B). (Scale bars, 60 µm.) (C) SAM size of the indicated plants. The inflorescences of 21-d-old plants were measured for Ler (n = 20), fhy3-68 (n = 20), clv3-1 (n = 20), and fhy3-68 ag-10 (n = 12). *P < 0.5 and **P < 0.01. (D) The CLV3 expression in the indicated plants measured by real-time RT-PCR. (E) The CLV3 transcript level examined by RT-qPCR. (F) Number of unopened buds of the indicated plant inflorescences (n = 22). **P < 0.01. (G) Gene expression of cell cycle gene (CYCB1;3) and DNA replication genes (MCM10, RPA70C, and RPA70D) in Ler and fhy3-68. In D, E, and G UBQ5 served as the internal control. Three biological replicates were performed. Error bars represent SD from three biological repeats. **P < 0.01.
Fig. S6.
Fig. S6.
Proposed model of FHY3 functions in meristem activity regulation. (A) FHY3 directly represses CLV3 and subsequently alters the WUS/CLV3 regulatory loop to maintain the stem cell pool in the SAM. Both FHY3 and phyB are involved in the light-regulated expression of CLV3, but the exact mechanisms need further investigation. (B) In FM, FHY3 directly represses CLV3 but also directly activates SEP2 to regulate WUS expression to promote FM determinacy. Besides SEP2, other factors (X) may also mediate the function of FHY3 in FM determinacy. se: sepal.

Similar articles

Cited by

References

    1. Sablowski R. Flowering and determinacy in Arabidopsis. J Exp Bot. 2007;58(5):899–907. - PubMed
    1. Laux T, Mayer KFX, Berger J, Jürgens G. The WUSCHEL gene is required for shoot and floral meristem integrity in Arabidopsis. Development. 1996;122(1):87–96. - PubMed
    1. Mayer KFX, et al. Role of WUSCHEL in regulating stem cell fate in the Arabidopsis shoot meristem. Cell. 1998;95(6):805–815. - PubMed
    1. Cao X, He Z, Guo L, Liu X. Epigenetic mechanisms are critical for the regulation of WUSCHEL expression in floral meristems. Plant Physiol. 2015;168(4):1189–1196. - PMC - PubMed
    1. Schoof H, et al. The stem cell population of Arabidopsis shoot meristems in maintained by a regulatory loop between the CLAVATA and WUSCHEL genes. Cell. 2000;100(6):635–644. - PubMed

Publication types

MeSH terms