

The nutrition transition and adolescents' diets in low- and middle-income countries: a cross-cohort comparison
- PMID: 27469288
- PMCID: PMC10261631
- DOI: 10.1017/S1368980016001865
The nutrition transition and adolescents' diets in low- and middle-income countries: a cross-cohort comparison
Abstract
Objective: To investigate changes in dietary diversity and dietary composition among adolescents in four developing countries.
Design: We analysed dietary diversity and consumption of seven food groups and foods with added sugars as reported by adolescents from two cohorts growing up 8 years apart, when they were aged about 12 years.
Setting: Ethiopia, India (Andhra Pradesh), Peru and Vietnam in 2006 and 2013.
Subjects: Adolescents (n 3659) from the older cohort (OC) born in 1995/96 and adolescents (n 7422) from the younger cohort (YC) born in 2001/02 (N 11 081).
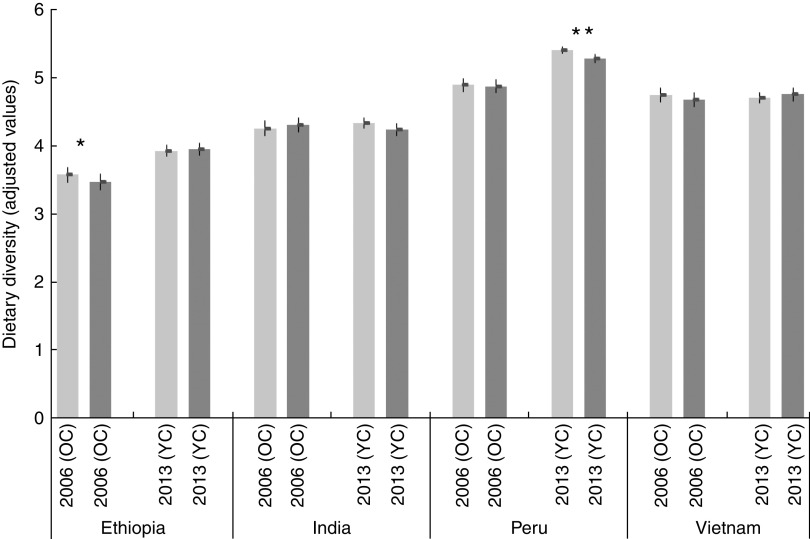
Results: Controlling for other factors, dietary diversity increased in Peru (OC=4·89, YC=5·34, P<0·001) and Ethiopia (OC=3·52, YC=3·94, P=0·001). Dietary diversity was stable in India (OC=4·28, YC=4·29, P=0·982) and Vietnam (OC=4·71, YC=4·73, P=0·814); however, changes in dietary composition were observed. YC adolescents were more likely to consume eggs (India: +32 %, P=0·038; Vietnam: +50 %, P<0·001) and milk and dairy (India: +12 %, P=0·029; Vietnam: +46 %, P<0·001). Other notable shifts included meat consumption in Peru (+72 %, P<0·001) and consumption of fruit and vegetables in Ethiopia (+36 %, P<0·001). Compared with OC, the prevalence of added sugar consumption was greater among the YC in Ethiopia (+35 %, P=0·001) and Vietnam (+44 % P<0·001). Between 2006 and 2013, disparities in dietary diversity associated with household wealth and place of residence declined, although this varied by country. No marked gender disparities in dietary diversity were evident.
Conclusions: We found significant changes over time in dietary diversity among adolescents in four countries consistent with the hypothesis of the nutrition transition.
Keywords: Adolescents; Cohorts; Dietary diversity; Low- and middle-income countries; Non-communicable diseases; Nutrition transition.
Figures
 , girls;
  , boys), country and cohort (OC, older cohort (born 1994/95); YC, younger cohort (born 2001/02)), Young Lives study. Predicted margins, with their standard errors represented by vertical bars, adjusted for adolescent’s gender and age in months, caregiver’s age, gender and educational level, head of the household’s age and gender, household size, wealth tertile, urban residence, cohort, and interactions between cohort and gender, cohort and wealth tertiles, and cohort and urban residence. *P<0·1, **P<0·05.
 , poorest tertile, equivalent to the lowest household wealth tertile; , least poor tertile, equivalent to the highest household wealth tertile), country and cohort (OC, older cohort (born 1994/95); YC, younger cohort (born 2001/02)), Young Lives study. Predicted margins, with their standard errors represented by vertical bars, adjusted for adolescent’s gender and age in months, caregiver’s age, gender and educational level, head of the household’s age and gender, household size, wealth tertiles, urban residence, cohort, and interactions between cohort and gender, cohort and wealth tertiles, and cohort and urban residence. **P<0·05, ***P<0·01
 , rural; , urban), country and cohort (OC, older cohort (born 1994/95); YC, younger cohort (born 2001/02)), Young Lives study. Predicted margins, with their standard errors represented by vertical bars, adjusted for adolescent’s gender and age in months, caregiver’s age, gender and educational level, head of the household’s age and gender, household size, wealth tertiles, urban residence, cohort, and interactions between cohort and gender, cohort and wealth tertiles, and cohort and urban residence. **P<0·05, ***P<0·01
 , poorest tertile;
  , second tertile;
  , least poor tertile), country and cohort (OC, older cohort (born 1994/95); YC, younger cohort (born 2001/02)), Young Lives study. Predicted margins, with their 95 % confidence intervals represented by vertical bars, adjusted for adolescent’s gender and age in months, caregiver’s age, gender and educational level, head of the household’s age and gender, household size, wealth tertiles, urban residence, cohort, and interactions between cohort and gender, cohort and wealth tertiles, and cohort and urban residence
 , rural;
  , urban), country and cohort (OC, older cohort (born 1994/95); YC, younger cohort (born 2001/02)), Young Lives study. Predicted margins, with their 95 % confidence intervals represented by vertical bars, adjusted for adolescent’s gender and age in months, caregiver’s age, gender and educational level, head of the household’s age and gender, household size, wealth tertiles, urban residence, cohort, and interactions between cohort and gender, cohort and wealth tertiles, and cohort and urban residence
Similar articles
-
Cross-Sectional and Longitudinal Associations between Household Food Security and Child Anthropometry at Ages 5 and 8 Years in Ethiopia, India, Peru, and Vietnam.J Nutr. 2015 Aug;145(8):1924-33. doi: 10.3945/jn.115.210229. Epub 2015 Jun 17. J Nutr. 2015. PMID: 26084361 Free PMC article.
-
Household food group expenditure patterns are associated with child anthropometry at ages 5, 8 and 12 years in Ethiopia, India, Peru and Vietnam.Econ Hum Biol. 2017 Aug;26:30-41. doi: 10.1016/j.ehb.2017.02.001. Epub 2017 Feb 14. Econ Hum Biol. 2017. PMID: 28222325 Free PMC article.
-
Understanding the causes and consequences of injuries to adolescents growing up in poverty in Ethiopia, Andhra Pradesh (India), Vietnam and Peru: a mixed method study.Health Policy Plan. 2014 Jan;29(1):67-75. doi: 10.1093/heapol/czs134. Epub 2013 Jan 17. Health Policy Plan. 2014. PMID: 23335464
-
Exploring the diet and physical activity behaviours of adolescents living in India and sub-Saharan Africa: a qualitative evidence synthesis.Public Health Nutr. 2021 Nov;24(16):5288-5298. doi: 10.1017/S1368980021002408. Epub 2021 Jun 30. Public Health Nutr. 2021. PMID: 34196267 Free PMC article. Review.
-
Future diets in India: A systematic review of food consumption projection studies.Glob Food Sec. 2019 Dec;23:182-190. doi: 10.1016/j.gfs.2019.05.006. Glob Food Sec. 2019. PMID: 32421030 Free PMC article. Review.
Cited by
-
Can Diets Be Healthy, Sustainable, and Equitable?Curr Obes Rep. 2019 Dec;8(4):495-503. doi: 10.1007/s13679-019-00362-0. Curr Obes Rep. 2019. PMID: 31654336 Free PMC article. Review.
-
The Dietary Intake and Practices of Adolescent Girls in Low- and Middle-Income Countries: A Systematic Review.Nutrients. 2018 Dec 14;10(12):1978. doi: 10.3390/nu10121978. Nutrients. 2018. PMID: 30558128 Free PMC article.
-
Micronutrient deficiencies and the double burden of malnutrition in Vietnamese female adolescents: a national cross-sectional study in 2020.Lancet Reg Health West Pac. 2024 Aug 7;50:101164. doi: 10.1016/j.lanwpc.2024.101164. eCollection 2024 Sep. Lancet Reg Health West Pac. 2024. PMID: 39219625 Free PMC article.
-
Clustering of diet and physical activity behaviours in adolescents across home and school area-level deprivation in Cameroon, South Africa, and Jamaica.BMC Public Health. 2024 Nov 21;24(1):3234. doi: 10.1186/s12889-024-20683-7. BMC Public Health. 2024. PMID: 39574052 Free PMC article.
-
Peru - Progress in health and sciences in 200 years of independence.Lancet Reg Health Am. 2021 Dec 20;7:100148. doi: 10.1016/j.lana.2021.100148. eCollection 2022 Mar. Lancet Reg Health Am. 2021. PMID: 36777656 Free PMC article. Review.
References
-
- Forouzanfar MH, Alexander L, Anderson HR et al.. (2015) Global, regional, and national comparative risk assessment of 79 behavioural, environmental and occupation, and metabolic risks or clusters of risks in 188 countries, 1990–2013: a systematic analysis for the Global Burden of Disease Study 2013. Lancet 386, 2287–2323. - PMC - PubMed
-
- Popkin BM (1998) The nutrition transition and its health implications in lower-income countries. Public Health Nutr 1, 5–21. - PubMed
-
- Ochola S & Masibo PK (2015) Dietary intake of schoolchildren and adolescents in developing countries. Ann Nutr Metab 64, Suppl. 2, 24–40. - PubMed
Publication types
MeSH terms
LinkOut - more resources
Full Text Sources
Other Literature Sources
Medical
