

IDO-orchestrated crosstalk between pDCs and Tregs inhibits autoimmunity
- PMID: 27470005
- PMCID: PMC5127883
- DOI: 10.1016/j.jaut.2016.07.004
IDO-orchestrated crosstalk between pDCs and Tregs inhibits autoimmunity
Abstract
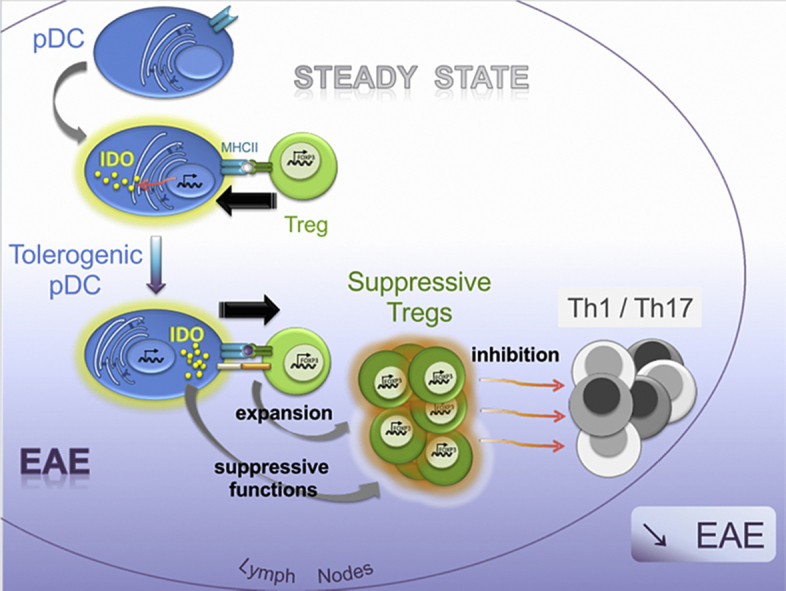
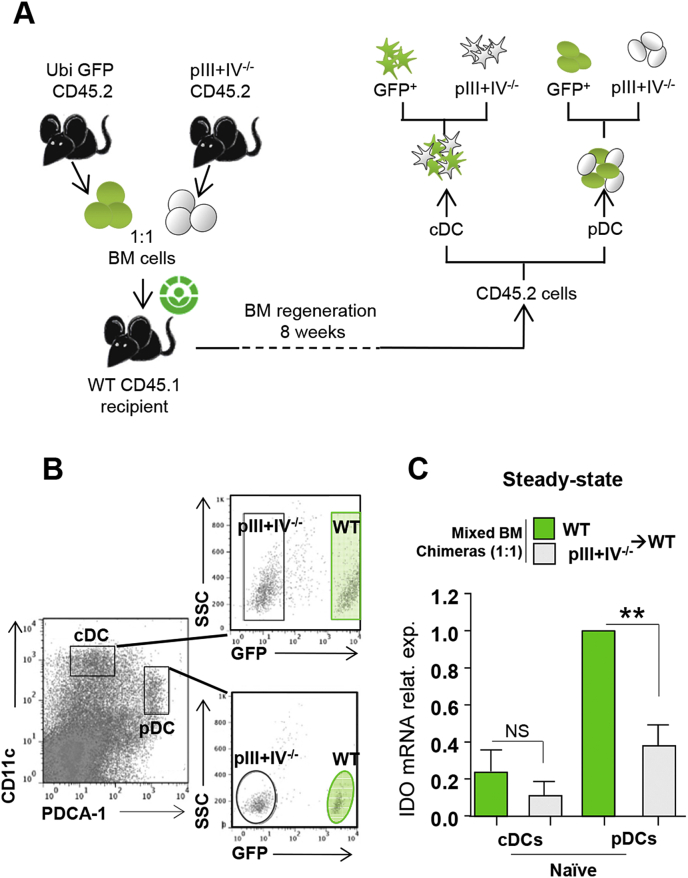
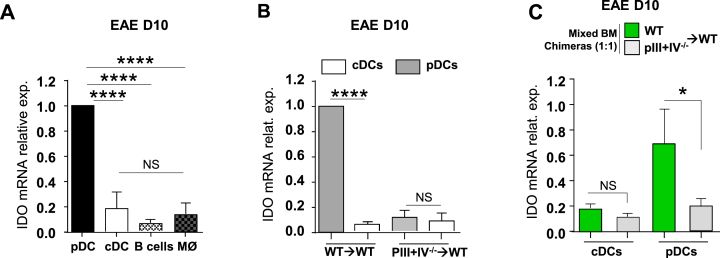
Plasmacytoid dendritic cells (pDCs) have been shown to both mediate and prevent autoimmunity, and the regulation of their immunogenic versus tolerogenic functions remains incompletely understood. Here we demonstrate that, compared to other cells, pDCs are the major expressors of Indoleamine-2,3-dioxygenase (IDO) in steady-state lymph nodes (LNs). IDO expression by LN pDCs was closely dependent on MHCII-mediated, antigen-dependent, interactions with Treg. We further established that IDO production by pDCs was necessary to confer suppressive function to Tregs. During EAE development, IDO expression by pDCs was required for the generation of Tregs capable of dampening the priming of encephalitogenic T cell and disease severity. Thus, we describe a novel crosstalk between pDCs and Tregs: Tregs shape tolerogenic functions of pDCs prior to inflammation, such that pDCs in turn, promote Treg suppressive functions during autoimmunity.
Keywords: Antigen presentation; Experimental autoimmune encephalomyelitis; Indoleamine 2,3-dyoxygenase; Plasmacytoid dendritic cells; Regulatory T cells; Tolerance.
Copyright © 2016 The Authors. Published by Elsevier Ltd.. All rights reserved.
Figures

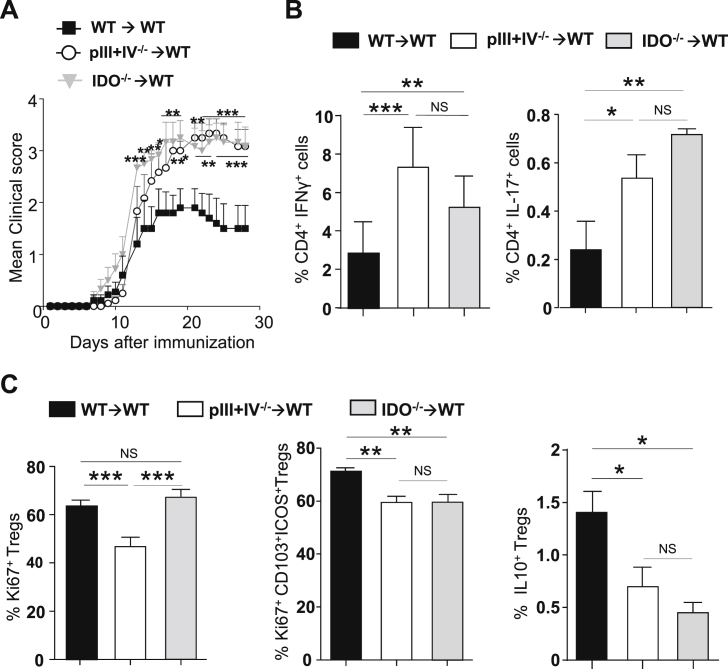
 ) BM chimeras. (A) Clinical scores were followed daily (two-way ANOVA with Bonferroni post Hoc test). Frequencies of (B) IFN-γ+ (left) and IL-17+ (right) CD4+ T cells, (C) Ki67+ (left), Ki67+CD103+ICOS+ (middle) and IL10+ (right) among CD25hiFoxp3+CD4+Tregs in dLN at d9 (one-way ANOVA with Bonferroni post Hoc test). (A–C) Results are representative of at least 3 independent experiments with 8 mice per group. Error bars depict mean ± SEM. *P < 0.05, **P < 0.01, ***P < 0.001, NS = Non significant.
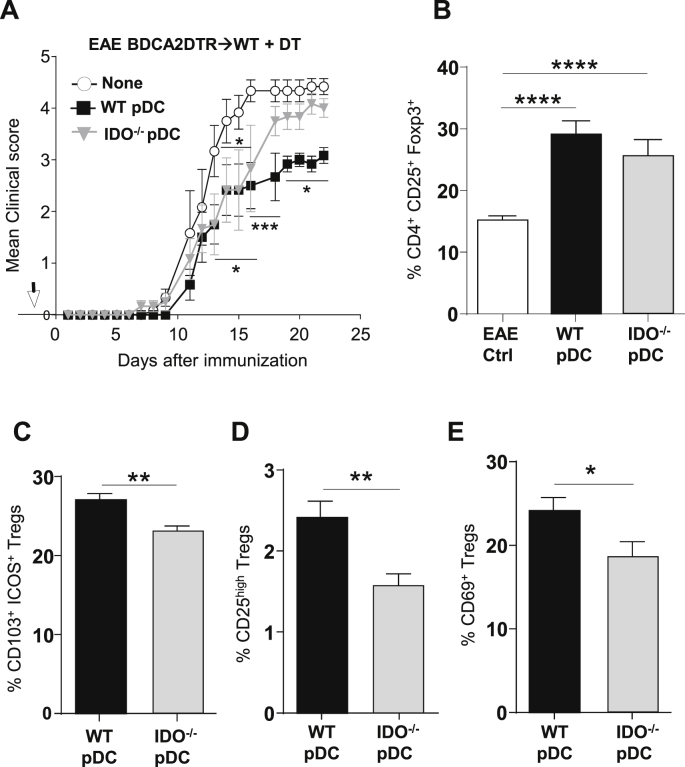 ) were transferred (arrow) or not (○) into BDCA2-DTR → WT BM chimeras and EAE was induced 1 day after. Mice received 5 consecutive DT injections every 3–4 days. (A) Clinical scores were followed daily (two-way ANOVA with Bonferroni post Hoc test). Frequencies of (B) CD4+CD25+ Foxp3+ Treg cells (one-way ANOVA with Bonferroni post Hoc test), (C) CD103+ICOS+ Tregs, (D) CD25high Tregs and (E) CD69+ Tregs from dLNs are represented at d10 after EAE immunization (two-tailed Mann-Whitney test). (A–E) Results are representative of at least 2 independent experiments with 6–8 mice per group. Error bars depict mean ± SEM. *P < 0.05, **P < 0.01, ***P < 0.001, ****P < 0.0001.
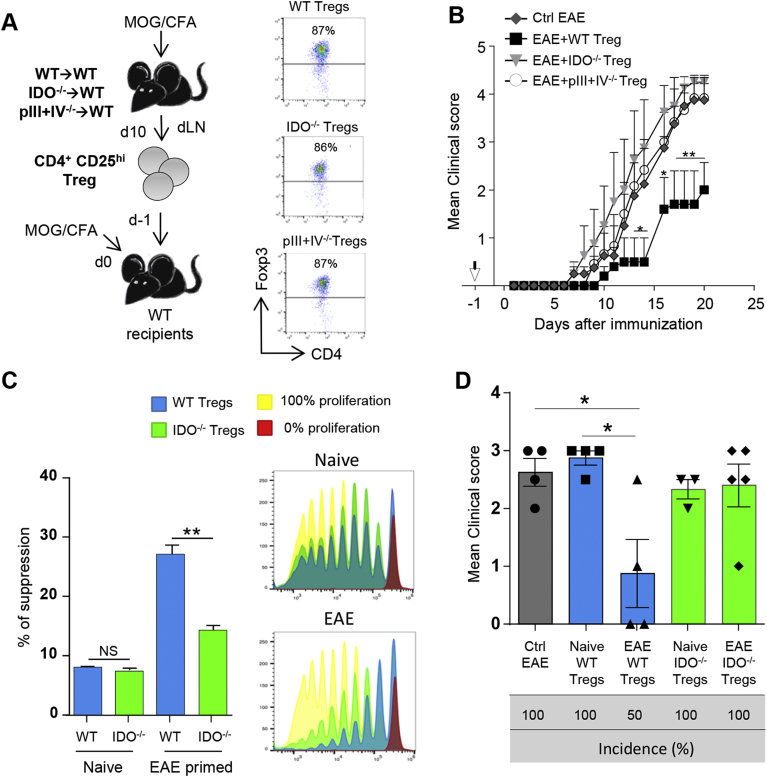 ) or pIII + IV−/− Tregs (○) (two-way ANOVA with Bonferroni post Hoc test). (A, B) Results are representative of at least 2 independent experiments. Error bars depict mean ± SEM. *P < 0.05, **P < 0.01. See also Table 1. (C, D) CD4+CD25hi cells were purified from total skin LNs of naïve WT → WT and IDO−/− → WT BM chimeras or from dLNs of WT → WT and IDO−/− → WT BM chimeras 10 days after EAE induction. (C) CD4+CD25hi cells were with proliferation dye-labeled 2D2 CD4+ T cells and LPS activated, MOG35–55 loaded, cDCs. 2D2 T cell proliferation was assessed after 5 days. Flow cytometry histograms represent 2D2 T cell proliferation for indicated conditions. Histograms represent the percentages of Treg-mediated suppression (two-tailed Mann-Whitney test). Results are representative of 2 independent experiments. Error bars depict mean ± SEM. **P < 0.01, NS = Non significant. (D) CD4+CD25hi cells were transferred into WT recipients further immunized for EAE the day after. Clinical scores and incidence (d15) are depicted. Data are representative of 2 experiments. Error bars represent mean ± SEM. One-way ANOVA with Bonferroni post Hoc test was used. *P < 0.05.
References
-
- Colonna M., Trinchieri G., Liu Y.J. Plasmacytoid dendritic cells in immunity. Nat. Immunol. 2004;5:1219–1226. - PubMed
-
- Chan V.S., Nie Y.J., Shen N., Yan S., Mok M.Y., Lau C.S. Distinct roles of myeloid and plasmacytoid dendritic cells in systemic lupus erythematosus. Autoimmun. Rev. 2012;11:890–897. - PubMed
-
- Kared H., Masson A., Adle-Biassette H., Bach J.F., Chatenoud L., Zavala F. Treatment with granulocyte colony-stimulating factor prevents diabetes in NOD mice by recruiting plasmacytoid dendritic cells and functional CD4(+)CD25(+) regulatory T-cells. Diabetes. 2005;54:78–84. - PubMed
-
- Longhini A.L., von Glehn F., Brandao C.O., de Paula R.F., Pradella F., Moraes A.S., Farias A.S., Oliveira E.C., Quispe-Cabanillas J.G., Abreu C.H. Plasmacytoid dendritic cells are increased in cerebrospinal fluid of untreated patients during multiple sclerosis relapse. J. Neuroinflammation. 2011;8:2. - PMC - PubMed
MeSH terms
Substances
LinkOut - more resources
Full Text Sources
Other Literature Sources
Research Materials
