

Estimates of global, regional, and national incidence, prevalence, and mortality of HIV, 1980-2015: the Global Burden of Disease Study 2015
- PMID: 27470028
- PMCID: PMC5056319
- DOI: 10.1016/S2352-3018(16)30087-X
Estimates of global, regional, and national incidence, prevalence, and mortality of HIV, 1980-2015: the Global Burden of Disease Study 2015
Erratum in
-
Correction to Lancet HIV 2016; 3: e361-87.Lancet HIV. 2016 Sep;3(9):e408. doi: 10.1016/S2352-3018(16)30125-4. Epub 2016 Aug 22. Lancet HIV. 2016. PMID: 27562740 Free PMC article. No abstract available.
Abstract
Background: Timely assessment of the burden of HIV/AIDS is essential for policy setting and programme evaluation. In this report from the Global Burden of Disease Study 2015 (GBD 2015), we provide national estimates of levels and trends of HIV/AIDS incidence, prevalence, coverage of antiretroviral therapy (ART), and mortality for 195 countries and territories from 1980 to 2015.
Methods: For countries without high-quality vital registration data, we estimated prevalence and incidence with data from antenatal care clinics and population-based seroprevalence surveys, and with assumptions by age and sex on initial CD4 distribution at infection, CD4 progression rates (probability of progression from higher to lower CD4 cell-count category), on and off antiretroviral therapy (ART) mortality, and mortality from all other causes. Our estimation strategy links the GBD 2015 assessment of all-cause mortality and estimation of incidence and prevalence so that for each draw from the uncertainty distribution all assumptions used in each step are internally consistent. We estimated incidence, prevalence, and death with GBD versions of the Estimation and Projection Package (EPP) and Spectrum software originally developed by the Joint United Nations Programme on HIV/AIDS (UNAIDS). We used an open-source version of EPP and recoded Spectrum for speed, and used updated assumptions from systematic reviews of the literature and GBD demographic data. For countries with high-quality vital registration data, we developed the cohort incidence bias adjustment model to estimate HIV incidence and prevalence largely from the number of deaths caused by HIV recorded in cause-of-death statistics. We corrected these statistics for garbage coding and HIV misclassification.
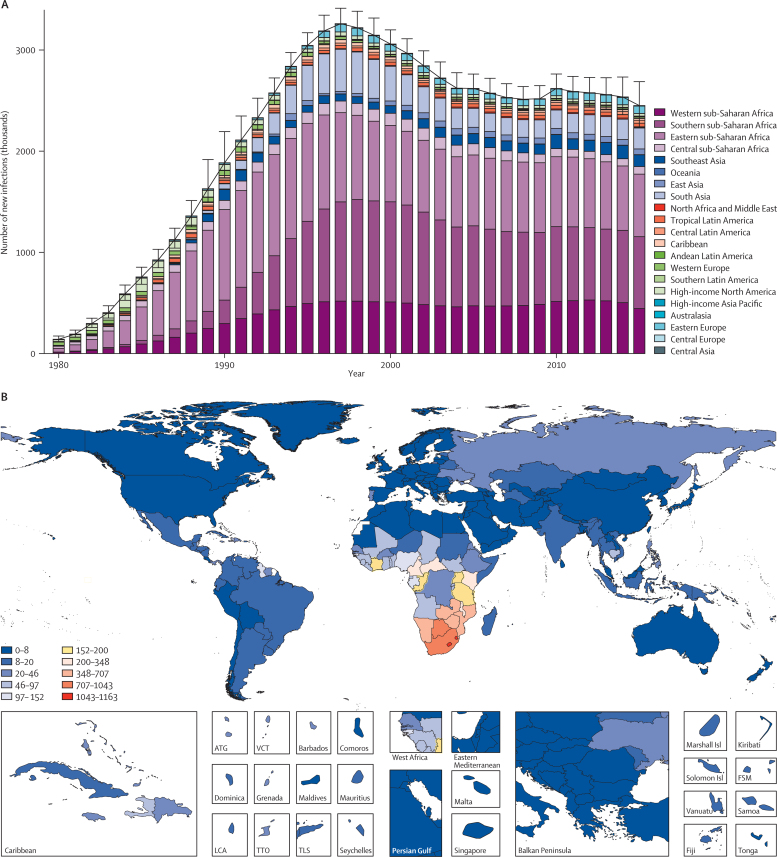
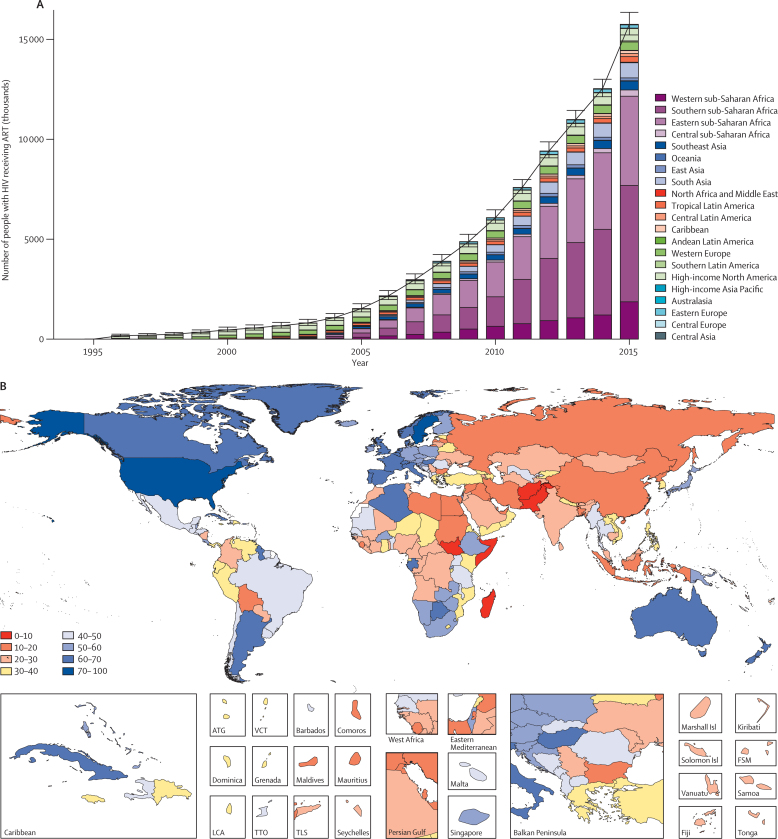
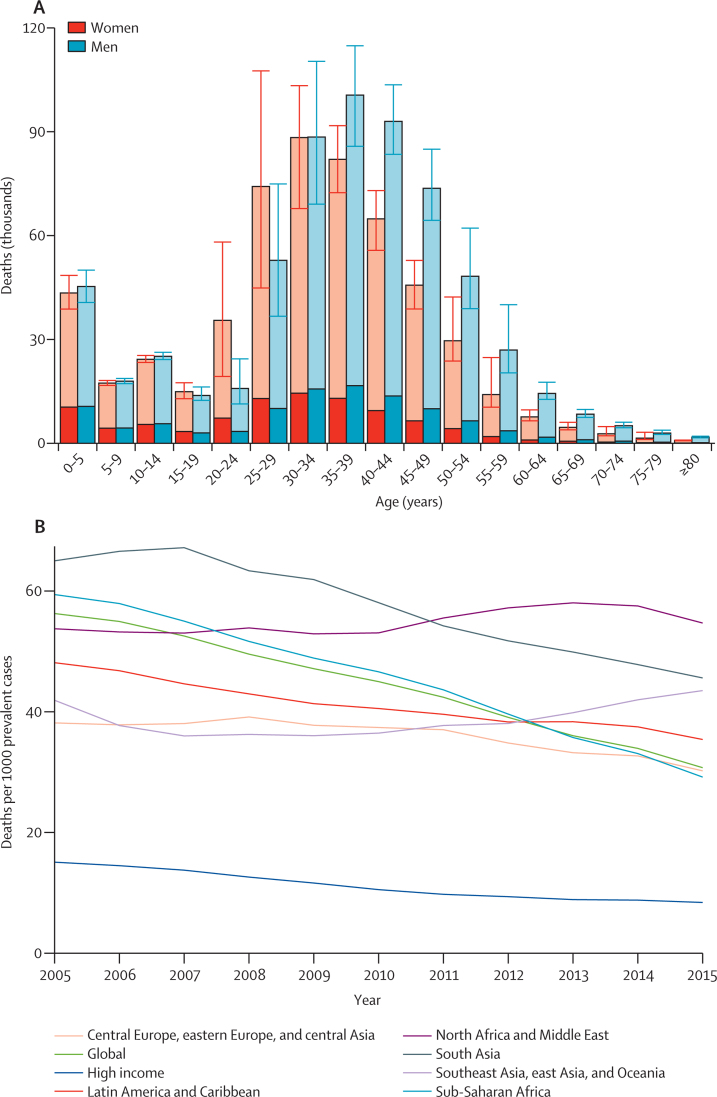
Findings: Global HIV incidence reached its peak in 1997, at 3·3 million new infections (95% uncertainty interval [UI] 3·1-3·4 million). Annual incidence has stayed relatively constant at about 2·6 million per year (range 2·5-2·8 million) since 2005, after a period of fast decline between 1997 and 2005. The number of people living with HIV/AIDS has been steadily increasing and reached 38·8 million (95% UI 37·6-40·4 million) in 2015. At the same time, HIV/AIDS mortality has been declining at a steady pace, from a peak of 1·8 million deaths (95% UI 1·7-1·9 million) in 2005, to 1·2 million deaths (1·1-1·3 million) in 2015. We recorded substantial heterogeneity in the levels and trends of HIV/AIDS across countries. Although many countries have experienced decreases in HIV/AIDS mortality and in annual new infections, other countries have had slowdowns or increases in rates of change in annual new infections.
Interpretation: Scale-up of ART and prevention of mother-to-child transmission has been one of the great successes of global health in the past two decades. However, in the past decade, progress in reducing new infections has been slow, development assistance for health devoted to HIV has stagnated, and resources for health in low-income countries have grown slowly. Achievement of the new ambitious goals for HIV enshrined in Sustainable Development Goal 3 and the 90-90-90 UNAIDS targets will be challenging, and will need continued efforts from governments and international agencies in the next 15 years to end AIDS by 2030.
Funding: Bill & Melinda Gates Foundation, and National Institute of Mental Health and National Institute on Aging, National Institutes of Health.
Copyright © 2016 The Author(s). Published by Elsevier Ltd. This is an Open Access article under the CC BY license. Published by Elsevier Ltd.. All rights reserved.
Figures


Comment in
-
Time for a revolution in tracking the HIV epidemic.Lancet HIV. 2016 Aug;3(8):e337-e339. doi: 10.1016/S2352-3018(16)30089-3. Epub 2016 Jul 19. Lancet HIV. 2016. PMID: 27470022 No abstract available.
References
Publication types
MeSH terms
Grants and funding
LinkOut - more resources
Full Text Sources
Other Literature Sources
Medical
Research Materials
Miscellaneous
