

Prescription opioid poisoning across urban and rural areas: identifying vulnerable groups and geographic areas
- PMID: 27470224
- PMCID: PMC5148642
- DOI: 10.1111/add.13543
Prescription opioid poisoning across urban and rural areas: identifying vulnerable groups and geographic areas
Abstract
Aims: To determine (1) whether prescription opioid poisoning (PO) hospital discharges spread across space over time, (2) the locations of 'hot-spots' of PO-related hospital discharges, (3) how features of the local environment contribute to the growth in PO-related hospital discharges and (4) where each environmental feature makes the strongest contribution.
Design: Hierarchical Bayesian Poisson space-time analysis to relate annual discharges from community hospitals to postal code characteristics over 10 years.
Setting: California, USA.
Participants: Residents of 18 517 postal codes in California, 2001-11.
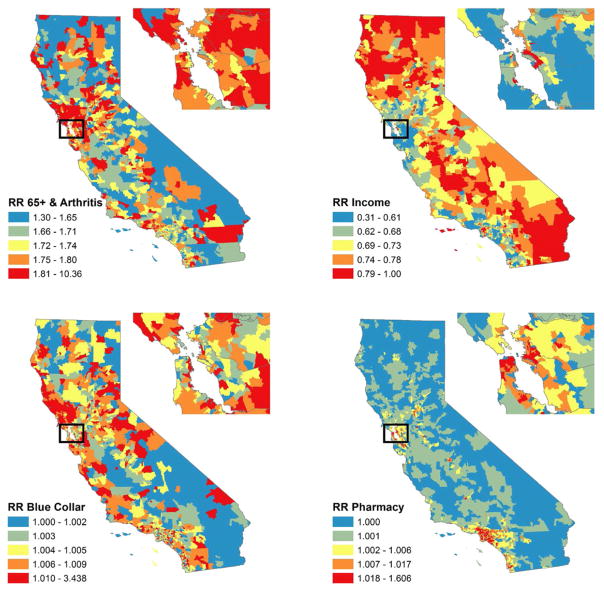
Measurements: Annual postal code-level counts of hospital discharges due to PO poisoning were related to postal code pharmacy density, measures of medical need for POs (i.e. rates of cancer and arthritis-related hospital discharges), economic stressors (i.e. median household income, percentage of families in poverty and the unemployment rate) and concentration of manual labor industries.
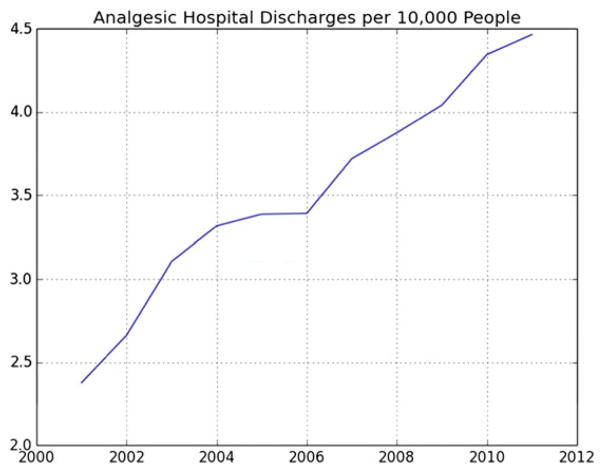
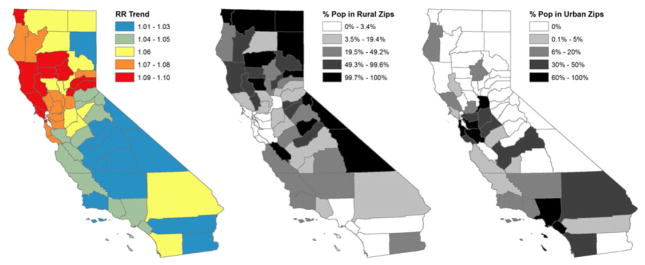
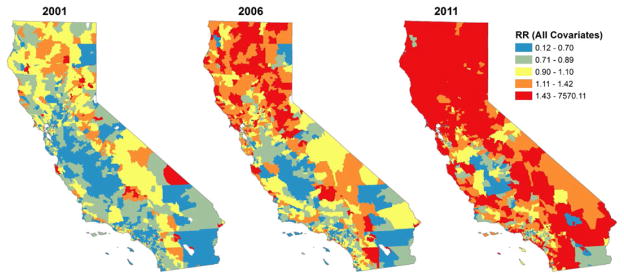
Findings: PO-related hospital discharges spread from rural and suburban/exurban 'hot-spots' to urban areas. They increased more in postal codes with greater pharmacy density [rate ratio (RR) = 1.03; 95% credible interval (CI) = 1.01, 1.05], more arthritis-related hospital discharges (RR = 1.08; 95% CI = 1.06, 1.11), lower income (RR = 0.85; 95% CI = 0.83, 0.87) and more manual labor industries (RR = 1.15; 95% CI = 1.10, 1.19 for construction; RR = 1.12; 95% CI = 1.04, 1.20 for manufacturing industries). Changes in pharmacy density primarily affected PO-related discharges in urban areas, while changes in income and manual labor industries especially affected PO-related discharges in suburban/exurban and rural areas.
Conclusions: Hospital discharge rates for prescription opioid (PO) poisoning spread from rural and suburban/exurban hot-spots to urban areas, suggesting spatial contagion. The distribution of age-related and work-place-related sources of medical need for POs in rural areas and, to a lesser extent, the availability of POs through pharmacies in urban areas, partly explain the growth of PO poisoning across California, USA.
Keywords: Bayesian space-time models; drug overdose; geography; hospital discharges; prescription opioids; rural and urban.
© 2016 Society for the Study of Addiction.
Figures
References
-
- United Nations Office on Drugs and Crime (UNODC) World Drug Report. Vienna: UNODC; 2015.
-
- Owens P, AHRQ, Barrett M, ML Barrett, Inc, Weiss A, Truven Health Analytics, Washington R, AHRQ, Kronick R., AHRQ . Hospital Inpatient Utilization Related to Opioid Overuse Among Adults, 1993–2012. Rockville, MD: Agency for Healthcare Research and Quality; 2014. - PubMed
-
- Havens JR, Talbert JC, Walker R, Leedham C, Leukefeld CG. Trends in controlled-release oxycodone (OxyContin) prescribing among Medicaid recipients in Kentucky, 1998–2002. J Rural Health. 2006;22:276–8. - PubMed
MeSH terms
Substances
Grants and funding
LinkOut - more resources
Full Text Sources
Other Literature Sources
Medical
