

Rapid construction of metabolite biosensors using domain-insertion profiling
- PMID: 27470466
- PMCID: PMC4974565
- DOI: 10.1038/ncomms12266
Rapid construction of metabolite biosensors using domain-insertion profiling
Abstract
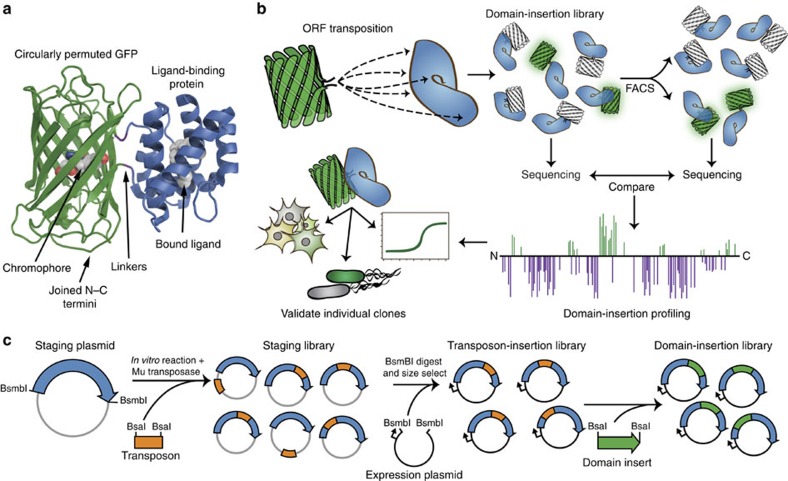
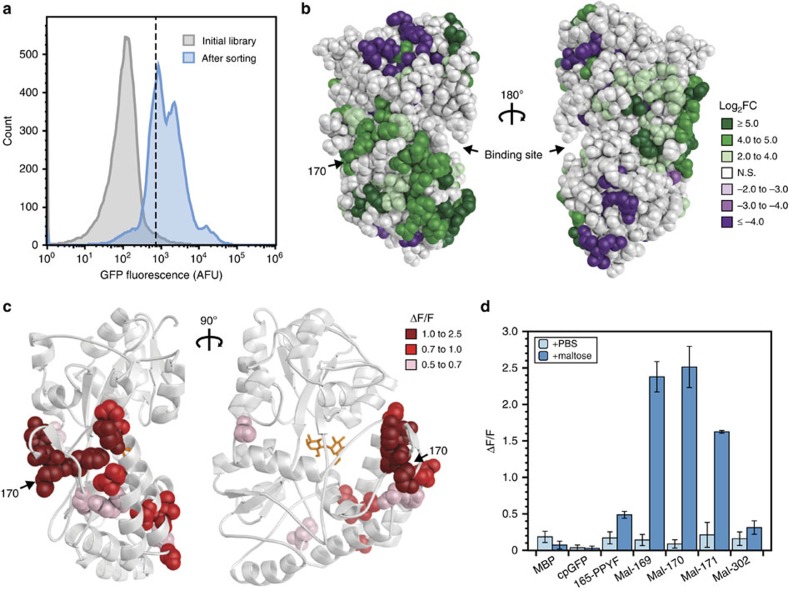
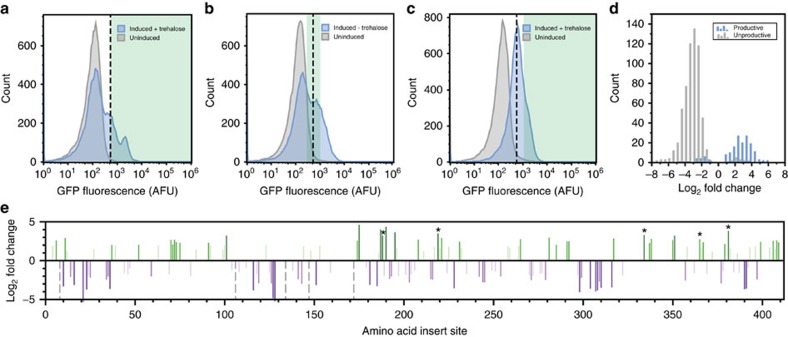
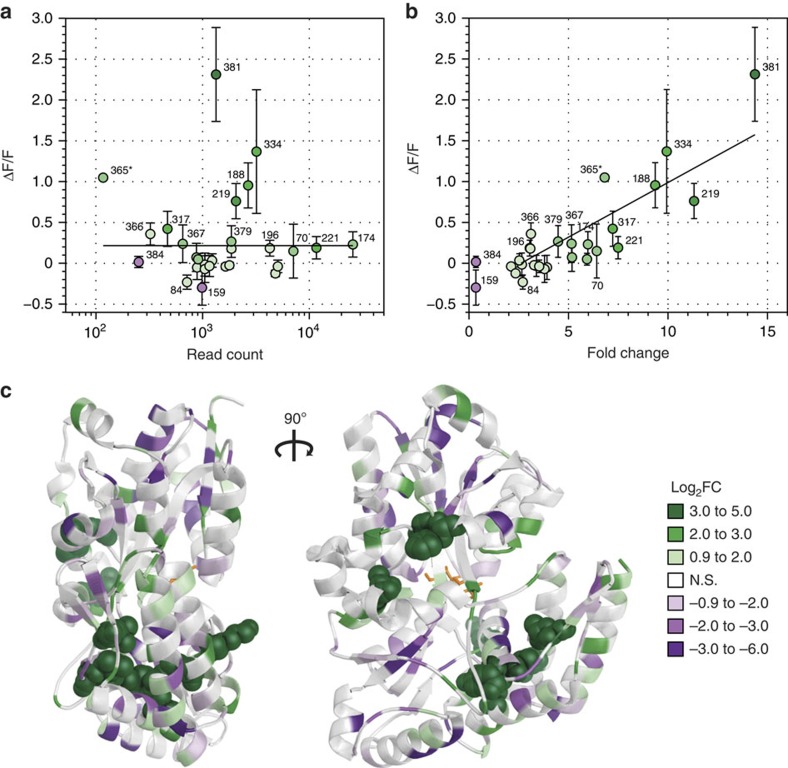
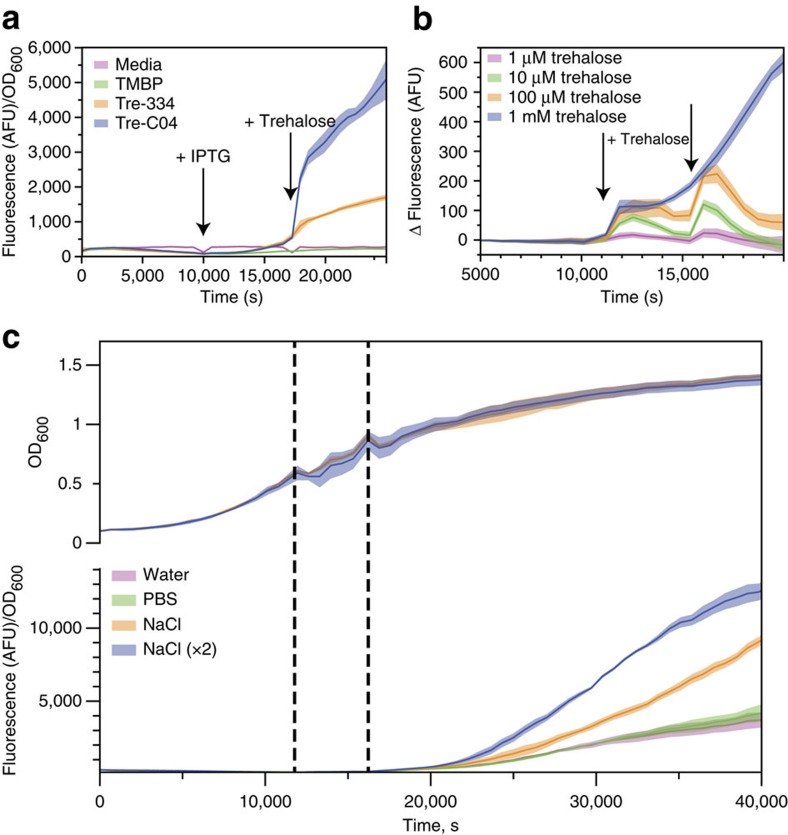
Single-fluorescent protein biosensors (SFPBs) are an important class of probes that enable the single-cell quantification of analytes in vivo. Despite advantages over other detection technologies, their use has been limited by the inherent challenges of their construction. Specifically, the rational design of green fluorescent protein (GFP) insertion into a ligand-binding domain, generating the requisite allosteric coupling, remains a rate-limiting step. Here, we describe an unbiased approach, termed domain-insertion profiling with DNA sequencing (DIP-seq), that combines the rapid creation of diverse libraries of potential SFPBs and high-throughput activity assays to identify functional biosensors. As a proof of concept, we construct an SFPB for the important regulatory sugar trehalose. DIP-seq analysis of a trehalose-binding-protein reveals allosteric hotspots for GFP insertion and results in high-dynamic range biosensors that function robustly in vivo. Taken together, DIP-seq simultaneously accelerates metabolite biosensor construction and provides a novel tool for interrogating protein allostery.
Figures
Similar articles
-
Development of an miRFP680-Based Fluorescent Calcium Ion Biosensor Using End-Optimized Transposons.ACS Sens. 2024 Jun 28;9(6):3394-3402. doi: 10.1021/acssensors.4c00727. Epub 2024 Jun 1. ACS Sens. 2024. PMID: 38822813 Free PMC article.
-
A Sort-Seq Approach to the Development of Single Fluorescent Protein Biosensors.ACS Chem Biol. 2021 Sep 17;16(9):1709-1720. doi: 10.1021/acschembio.1c00423. Epub 2021 Aug 25. ACS Chem Biol. 2021. PMID: 34431656 Free PMC article.
-
Engineering Modular Biosensors to Confer Metabolite-Responsive Regulation of Transcription.ACS Synth Biol. 2017 Feb 17;6(2):311-325. doi: 10.1021/acssynbio.6b00184. Epub 2016 Oct 31. ACS Synth Biol. 2017. PMID: 27744683
-
Principles and applications of green fluorescent protein-based biosensors: a mini-review.Analyst. 2023 Jun 26;148(13):2882-2891. doi: 10.1039/d3an00320e. Analyst. 2023. PMID: 37255369 Review.
-
Recent progress in strategies for the creation of protein-based fluorescent biosensors.Chembiochem. 2009 Nov 2;10(16):2560-77. doi: 10.1002/cbic.200900249. Chembiochem. 2009. PMID: 19693761 Review.
Cited by
-
Protein Splicing of Inteins: A Powerful Tool in Synthetic Biology.Front Bioeng Biotechnol. 2022 Feb 21;10:810180. doi: 10.3389/fbioe.2022.810180. eCollection 2022. Front Bioeng Biotechnol. 2022. PMID: 35265596 Free PMC article. Review.
-
Red Fluorescent Genetically Encoded Voltage Indicators with Millisecond Responsiveness.Sensors (Basel). 2019 Jul 6;19(13):2982. doi: 10.3390/s19132982. Sensors (Basel). 2019. PMID: 31284557 Free PMC article.
-
In vivo direct cell-penetrating peptide mediated protein transduction system in Acyrthosiphon pisum.BMC Res Notes. 2023 Sep 25;16(1):231. doi: 10.1186/s13104-023-06514-9. BMC Res Notes. 2023. PMID: 37749584 Free PMC article.
-
Structures of the CRISPR genome integration complex.Science. 2017 Sep 15;357(6356):1113-1118. doi: 10.1126/science.aao0679. Epub 2017 Jul 20. Science. 2017. PMID: 28729350 Free PMC article.
-
Development of an miRFP680-Based Fluorescent Calcium Ion Biosensor Using End-Optimized Transposons.ACS Sens. 2024 Jun 28;9(6):3394-3402. doi: 10.1021/acssensors.4c00727. Epub 2024 Jun 1. ACS Sens. 2024. PMID: 38822813 Free PMC article.
References
-
- Heinemann M. & Sauer U. Systems biology of microbial metabolism. Curr. Opin. Microbiol. 13, 337–343 (2010). - PubMed
-
- Okumoto S., Jones A. & Frommer W. B. Quantitative imaging with fluorescent biosensors. Annu. Rev. Plant Biol. 63, 663–706 (2012). - PubMed
-
- Fehr M., Ehrhardt D. W., Lalonde S. & Frommer W. B. Minimally invasive dynamic imaging of ions and metabolites in living cells. Curr. Opin. Plant Biol. 7, 345–351 (2004). - PubMed
Publication types
MeSH terms
Substances
Grants and funding
LinkOut - more resources
Full Text Sources
Other Literature Sources
Research Materials
