High throughput genomic sequencing of bioaerosols in broiler chicken production facilities
- PMID: 27470660
- PMCID: PMC5072194
- DOI: 10.1111/1751-7915.12380
High throughput genomic sequencing of bioaerosols in broiler chicken production facilities
Abstract
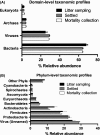
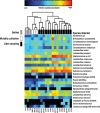
Chronic inhalation exposure to agricultural dust promotes the development of chronic respiratory diseases among poultry workers. Poultry dust is composed of dander, chicken feed, litter bedding and microbes. However, the microbial composition and abundance has not been fully elucidated. Genomic DNA was extracted from settled dust and personal inhalable dust collected while performing litter sampling or mortality collection tasks. DNA libraries were sequenced using a paired-end sequencing-by-synthesis approach on an Illumina HiSeq 2500. Sequencing data showed that poultry dust is predominantly composed of bacteria (64-67%) with a small quantity of avian, human and feed DNA (< 2% of total reads). Staphylococcus sp. AL1, Salinicoccus carnicancri and Lactobacillus crispatus were the most abundant bacterial species in personal exposure samples of inhalable dust. Settled dust had a moderate relative abundance of these species as well as Staphylococcus lentus and Lactobacillus salivarius. There was a statistical difference between the microbial composition of aerosolized and settled dust. Unlike settled dust composition, aerosolized dust composition had little variance between samples. These data provide an extensive analysis of the microbial composition and relative abundance in personal inhalable poultry dust and settled poultry dust.
© 2016 The Authors. Microbial Biotechnology published by John Wiley & Sons Ltd and Society for Applied Microbiology.
Figures


Similar articles
-
Culture-independent characterization of bacteria and fungi in a poultry bioaerosol using pyrosequencing: a new approach.J Occup Environ Hyg. 2010 Dec;7(12):693-9. doi: 10.1080/15459624.2010.526893. J Occup Environ Hyg. 2010. PMID: 21058154
-
Microbial diversity in bioaerosol samples causing ODTS compared to reference bioaerosol samples as measured using Illumina sequencing and MALDI-TOF.Environ Res. 2015 Jul;140:255-67. doi: 10.1016/j.envres.2015.03.027. Epub 2015 Apr 13. Environ Res. 2015. PMID: 25880607
-
Microbial contents of vacuum cleaner bag dust and emitted bioaerosols and their implications for human exposure indoors.Appl Environ Microbiol. 2013 Oct;79(20):6331-6. doi: 10.1128/AEM.01583-13. Epub 2013 Aug 9. Appl Environ Microbiol. 2013. PMID: 23934489 Free PMC article.
-
Millions of reads, thousands of taxa: microbial community structure and associations analyzed via marker genes.FEMS Microbiol Rev. 2016 Sep;40(5):686-700. doi: 10.1093/femsre/fuw017. Epub 2016 Jun 29. FEMS Microbiol Rev. 2016. PMID: 27358393 Review.
-
Dust levels and control methods in poultry houses.J Agric Saf Health. 2000 Nov;6(4):275-82. doi: 10.13031/2013.1910. J Agric Saf Health. 2000. PMID: 11217692 Review.
Cited by
-
Bacterial extracellular vesicles isolated from organic dust induce neutrophilic inflammation in the lung.Am J Physiol Lung Cell Mol Physiol. 2020 Dec 1;319(6):L893-L907. doi: 10.1152/ajplung.00107.2020. Epub 2020 Sep 30. Am J Physiol Lung Cell Mol Physiol. 2020. PMID: 32996778 Free PMC article.
-
Contribution of the Broiler Breeders' Fecal Microbiota to the Establishment of the Eggshell Microbiota.Front Microbiol. 2020 Apr 15;11:666. doi: 10.3389/fmicb.2020.00666. eCollection 2020. Front Microbiol. 2020. PMID: 32351488 Free PMC article.
-
Composition and Function of Chicken Gut Microbiota.Animals (Basel). 2020 Jan 8;10(1):103. doi: 10.3390/ani10010103. Animals (Basel). 2020. PMID: 31936291 Free PMC article. Review.
-
Bacterial Community Characteristics Shaped by Artificial Environmental PM2.5 Control in Intensive Broiler Houses.Int J Environ Res Public Health. 2022 Dec 30;20(1):723. doi: 10.3390/ijerph20010723. Int J Environ Res Public Health. 2022. PMID: 36613044 Free PMC article.
-
Evaluation of a sprinkler cooling system on inhalable dust and ammonia concentrations in broiler chicken production.J Occup Environ Hyg. 2017 Jan;14(1):40-48. doi: 10.1080/15459624.2016.1211285. J Occup Environ Hyg. 2017. PMID: 27869548 Free PMC article.
References
-
- Bray, J.R. , and Curtis, J.T. (1957) An ordination of the upland forest communities of southern wisconsin. Ecol Monogr 27: 325–349.
-
- Brooks, J.P. , McLaughlin, M.R. , Scheffler, B. , and Miles, D.M. (2010) Microbial and antibiotic resistant constituents associated with biological aerosols and poultry litter within a commercial poultry house. Sci Total Environ 408: 4770–4777. - PubMed
-
- Camarinha‐Silva, A. , Jauregui, R. , Chaves‐Moreno, D. , Oxley, A.P. , Schaumburg, F. , Becker, K. , et al (2014) Comparing the anterior nare bacterial community of two discrete human populations using Illumina amplicon sequencing. Environ Microbiol 16: 2939–2952. - PubMed
Publication types
MeSH terms
Substances
Grants and funding
LinkOut - more resources
Full Text Sources
Other Literature Sources

