

Discovering Pair-wise Synergies in Microarray Data
- PMID: 27470995
- PMCID: PMC4965793
- DOI: 10.1038/srep30672
Discovering Pair-wise Synergies in Microarray Data
Abstract
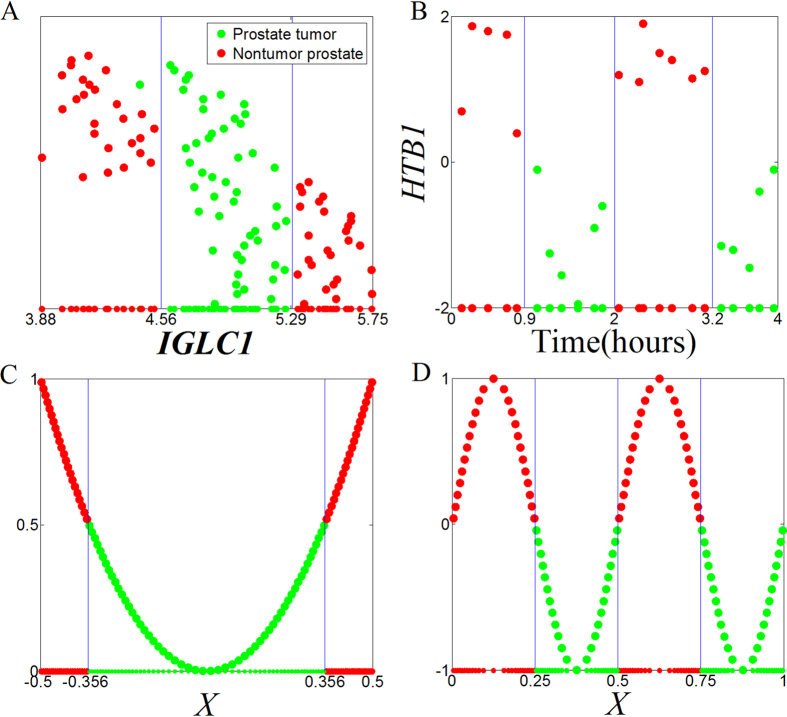
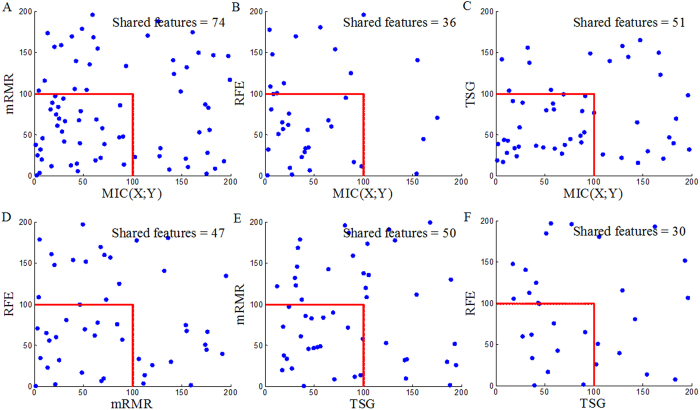
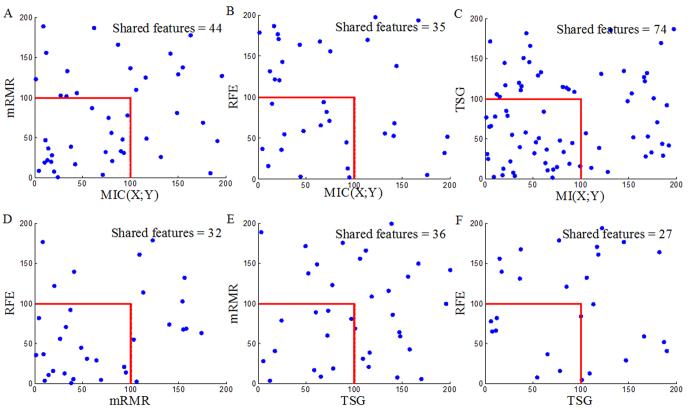
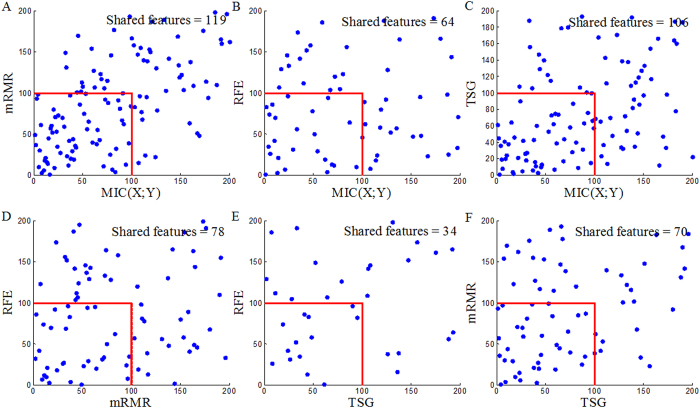
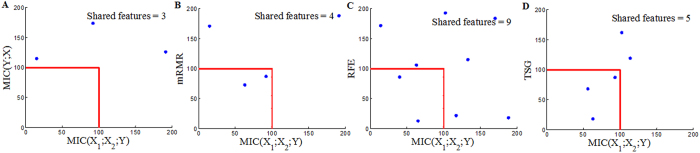
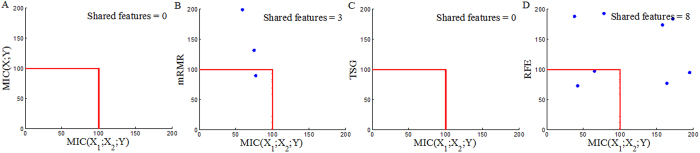
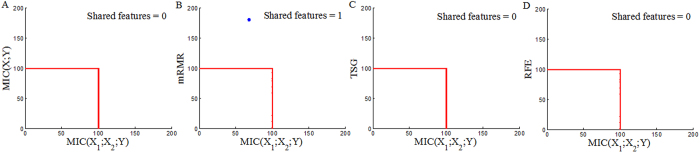
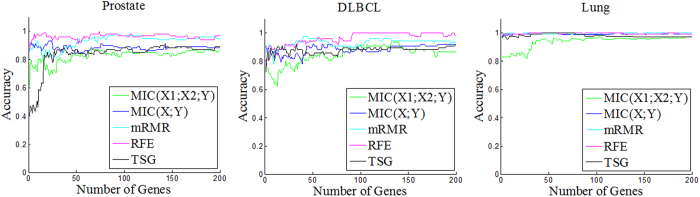
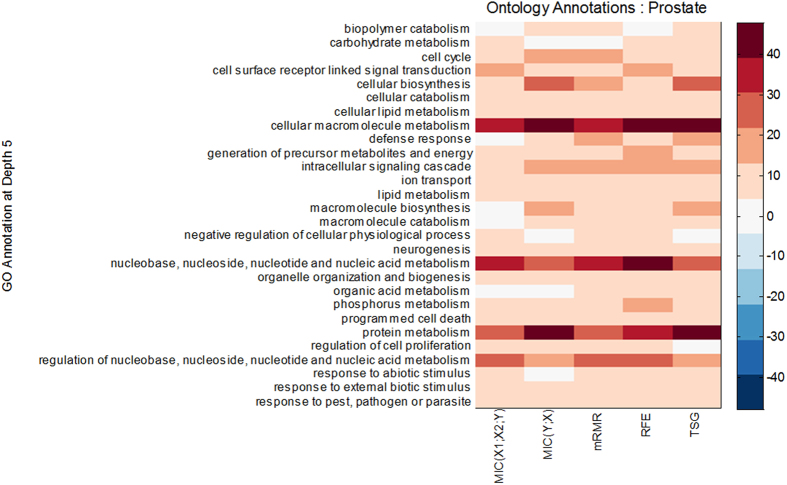
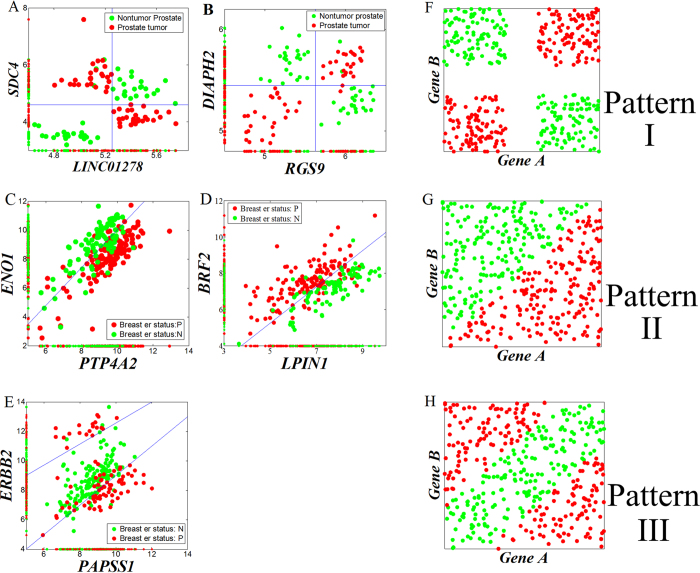
Informative gene selection can have important implications for the improvement of cancer diagnosis and the identification of new drug targets. Individual-gene-ranking methods ignore interactions between genes. Furthermore, popular pair-wise gene evaluation methods, e.g. TSP and TSG, are helpless for discovering pair-wise interactions. Several efforts to discover pair-wise synergy have been made based on the information approach, such as EMBP and FeatKNN. However, the methods which are employed to estimate mutual information, e.g. binarization, histogram-based and KNN estimators, depend on known data or domain characteristics. Recently, Reshef et al. proposed a novel maximal information coefficient (MIC) measure to capture a wide range of associations between two variables that has the property of generality. An extension from MIC(X; Y) to MIC(X1; X2; Y) is therefore desired. We developed an approximation algorithm for estimating MIC(X1; X2; Y) where Y is a discrete variable. MIC(X1; X2; Y) is employed to detect pair-wise synergy in simulation and cancer microarray data. The results indicate that MIC(X1; X2; Y) also has the property of generality. It can discover synergic genes that are undetectable by reference feature selection methods such as MIC(X; Y) and TSG. Synergic genes can distinguish different phenotypes. Finally, the biological relevance of these synergic genes is validated with GO annotation and OUgene database.
Figures
 and
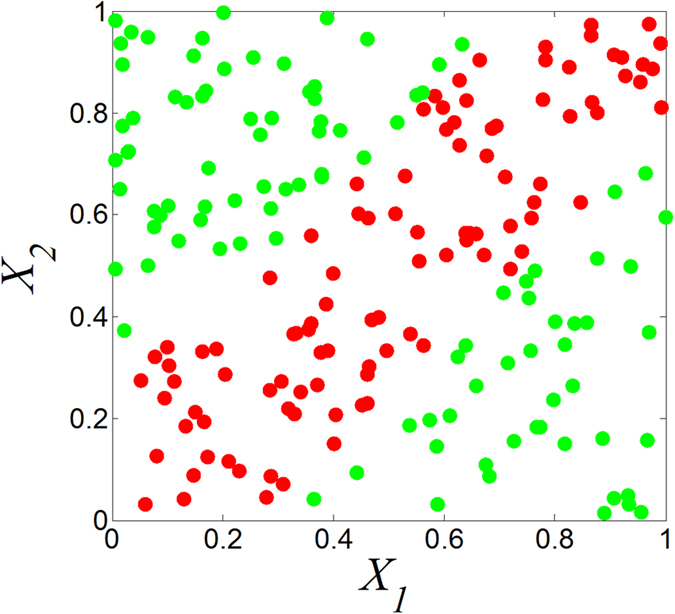
and result from binarization vector of X1 and X2, respectively. Y =
  (n = 1000). Green and red dots represent Y = 1 and Y = 0, respectively.
Similar articles
-
A fast approach to detect gene-gene synergy.Sci Rep. 2017 Nov 27;7(1):16437. doi: 10.1038/s41598-017-16748-w. Sci Rep. 2017. PMID: 29180805 Free PMC article.
-
A complementary circular code in the protein coding genes.J Theor Biol. 1996 Sep 7;182(1):45-58. doi: 10.1006/jtbi.1996.0142. J Theor Biol. 1996. PMID: 8917736
-
Feature construction from synergic pairs to improve microarray-based classification.Bioinformatics. 2007 Nov 1;23(21):2866-72. doi: 10.1093/bioinformatics/btm429. Epub 2007 Oct 9. Bioinformatics. 2007. PMID: 17925306
-
Classification between normal and tumor tissues based on the pair-wise gene expression ratio.BMC Cancer. 2004 Oct 7;4:72. doi: 10.1186/1471-2407-4-72. BMC Cancer. 2004. PMID: 15469618 Free PMC article.
-
Microarray data analysis and mining approaches.Brief Funct Genomic Proteomic. 2007 Dec;6(4):265-81. doi: 10.1093/bfgp/elm034. Epub 2008 Jan 22. Brief Funct Genomic Proteomic. 2007. PMID: 18216026 Review.
Cited by
-
A fast approach to detect gene-gene synergy.Sci Rep. 2017 Nov 27;7(1):16437. doi: 10.1038/s41598-017-16748-w. Sci Rep. 2017. PMID: 29180805 Free PMC article.
-
High dimensional model representation of log-likelihood ratio: binary classification with expression data.BMC Bioinformatics. 2020 Apr 25;21(1):156. doi: 10.1186/s12859-020-3486-x. BMC Bioinformatics. 2020. PMID: 32334509 Free PMC article.
-
Data analysis methods for defining biomarkers from omics data.Anal Bioanal Chem. 2022 Jan;414(1):235-250. doi: 10.1007/s00216-021-03813-7. Epub 2021 Dec 24. Anal Bioanal Chem. 2022. PMID: 34951658 Review.
References
Publication types
MeSH terms
LinkOut - more resources
Full Text Sources
Other Literature Sources
Miscellaneous
