

Chronic Repression of mTOR Complex 2 Induces Changes in the Gut Microbiota of Diet-induced Obese Mice
- PMID: 27471110
- PMCID: PMC4965768
- DOI: 10.1038/srep30887
Chronic Repression of mTOR Complex 2 Induces Changes in the Gut Microbiota of Diet-induced Obese Mice
Abstract
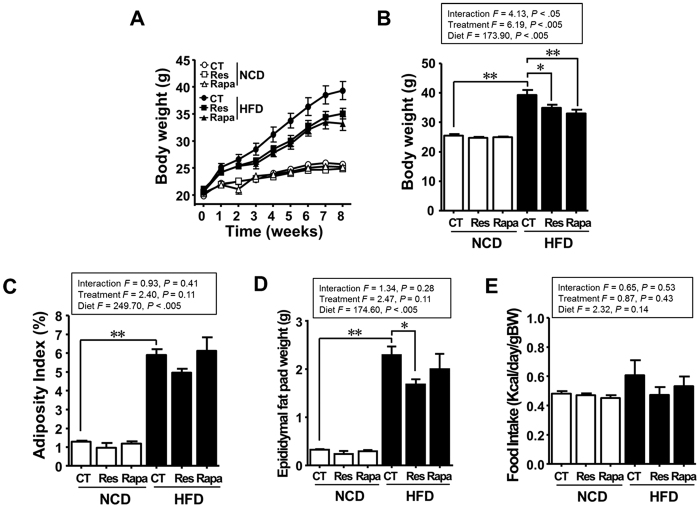
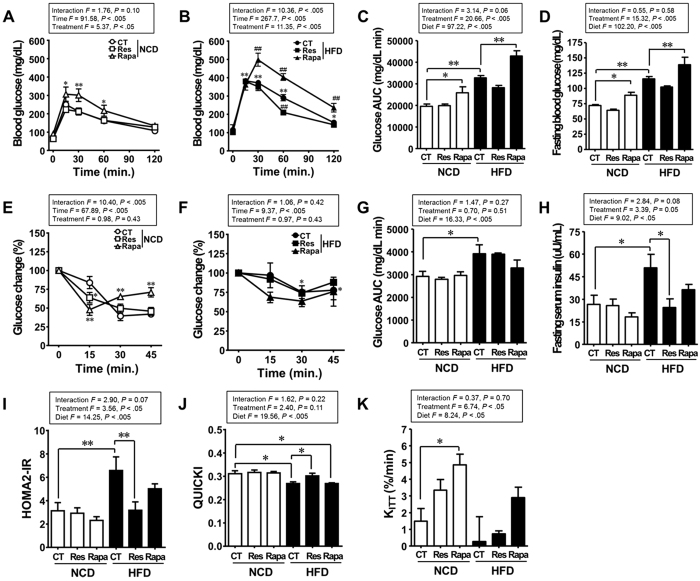
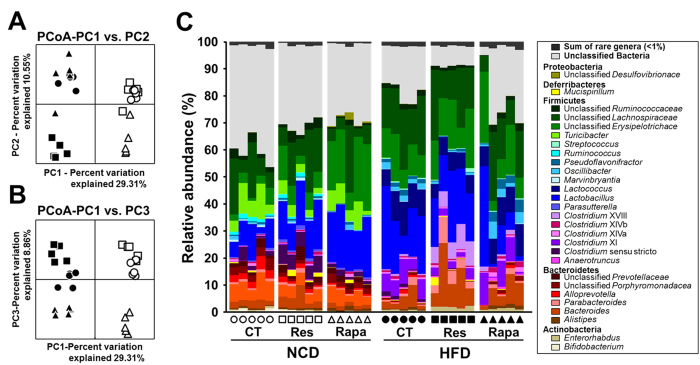
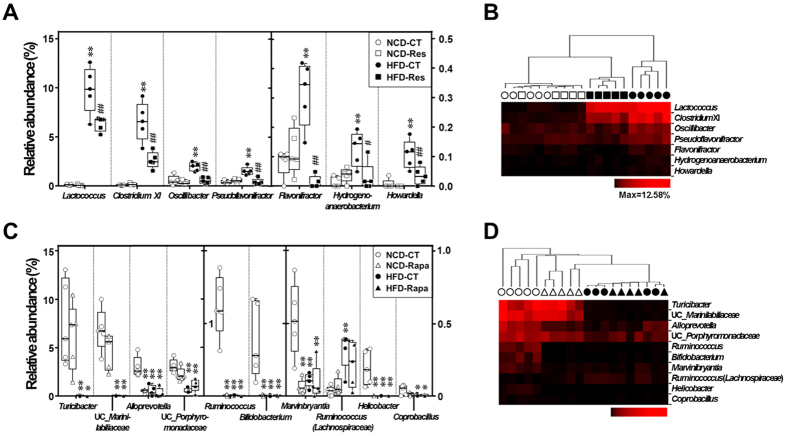
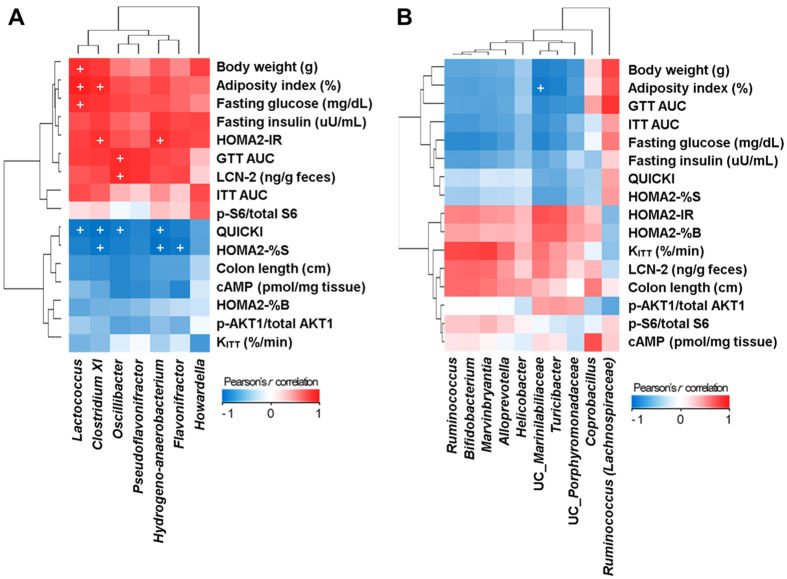
Alterations in the gut microbiota play a crucial role in host physiology and metabolism; however, the molecular pathways underlying these changes in diet-induced obesity are unclear. Mechanistic target of rapamycin (mTOR) signaling pathway is associated with metabolic disorders such as obesity and type 2 diabetes (T2D). Therefore, we examined whether changes in the regulation of mTOR signaling induced by diet (a high-fat diet [HFD] or normal-chow diet) and/or therapeutics (resveratrol [a specific inhibitor of mTOR complex 1] or rapamycin [an inhibitor of both mTOR complex 1 and 2]) altered the composition of the gut microbiota in mice. Oral administration of resveratrol prevented glucose intolerance and fat accumulation in HFD-fed mice, whereas rapamycin significantly impaired glucose tolerance and exacerbated intestinal inflammation. The abundance of Lactococcus, Clostridium XI, Oscillibacter, and Hydrogenoanaerobacterium increased under the HFD condition; however, the abundance of these species declined after resveratrol treatment. Conversely, the abundance of unclassified Marinilabiliaceae and Turicibacter decreased in response to a HFD or rapamycin. Taken together, these results demonstrated that changes in the composition of intestinal microbiota induced by changes in mTOR activity correlate with obese and diabetic phenotypes.
Figures
Similar articles
-
N-Acetylcysteine alleviates gut dysbiosis and glucose metabolic disorder in high-fat diet-fed mice.J Diabetes. 2019 Jan;11(1):32-45. doi: 10.1111/1753-0407.12795. Epub 2018 Jul 4. J Diabetes. 2019. PMID: 29845722
-
Melatonin prevents obesity through modulation of gut microbiota in mice.J Pineal Res. 2017 May;62(4). doi: 10.1111/jpi.12399. Epub 2017 Mar 10. J Pineal Res. 2017. PMID: 28199741
-
Dietary Uncoupling of Gut Microbiota and Energy Harvesting from Obesity and Glucose Tolerance in Mice.Cell Rep. 2017 Nov 7;21(6):1521-1533. doi: 10.1016/j.celrep.2017.10.056. Cell Rep. 2017. PMID: 29117558 Free PMC article.
-
The Complex Roles of Mechanistic Target of Rapamycin in Adipocytes and Beyond.Trends Endocrinol Metab. 2017 May;28(5):319-339. doi: 10.1016/j.tem.2017.01.004. Epub 2017 Feb 22. Trends Endocrinol Metab. 2017. PMID: 28237819 Free PMC article. Review.
-
mTOR: A Cellular Regulator Interface in Health and Disease.Cells. 2019 Jan 2;8(1):18. doi: 10.3390/cells8010018. Cells. 2019. PMID: 30609721 Free PMC article. Review.
Cited by
-
Influence of high-fat diet on host animal health via bile acid metabolism and benefits of oral-fed Streptococcus thermophilus MN-ZLW-002.Exp Anim. 2022 Nov 10;71(4):468-480. doi: 10.1538/expanim.21-0182. Epub 2022 Jul 6. Exp Anim. 2022. PMID: 35793979 Free PMC article.
-
The Roles of the Gut Microbiota and Toll-like Receptors in Obesity and Nonalcoholic Fatty Liver Disease.J Obes Metab Syndr. 2017 Jun;26(2):86-96. doi: 10.7570/jomes.2017.26.2.86. Epub 2017 Jun 30. J Obes Metab Syndr. 2017. PMID: 31089501 Free PMC article. Review.
-
mTOR Signaling Pathway and Gut Microbiota in Various Disorders: Mechanisms and Potential Drugs in Pharmacotherapy.Int J Mol Sci. 2023 Jul 22;24(14):11811. doi: 10.3390/ijms241411811. Int J Mol Sci. 2023. PMID: 37511569 Free PMC article. Review.
-
Reducing gut microbiome-driven adipose tissue inflammation alleviates metabolic syndrome.Microbiome. 2023 Sep 21;11(1):208. doi: 10.1186/s40168-023-01637-4. Microbiome. 2023. PMID: 37735685 Free PMC article.
-
Resveratrol protects against L-arginine-induced acute necrotizing pancreatitis in mice by enhancing SIRT1-mediated deacetylation of p53 and heat shock factor 1.Int J Mol Med. 2017 Aug;40(2):427-437. doi: 10.3892/ijmm.2017.3012. Epub 2017 Jun 6. Int J Mol Med. 2017. PMID: 28586010 Free PMC article.
References
-
- Allison D. B., Fontaine K. R., Manson J. E., Stevens J. & VanItallie T. B. Annual deaths attributable to obesity in the United States. JAMA 282, 1530–1538 (1999). - PubMed
-
- Genton L., Melzer K. & Pichard C. Energy and macronutrient requirements for physical fitness in exercising subjects. Clin Nutr 29, 413–423 (2010). - PubMed
-
- Horgan G. & Stubbs J. Predicting basal metabolic rate in the obese is difficult. Eur J Clin Nutr 57, 335–340 (2003). - PubMed
-
- Spiegelman B. M. & Flier J. S. Obesity and the regulation of energy balance. Cell 104, 531–543 (2001). - PubMed
-
- Badman M. K. & Flier J. S. The gut and energy balance: visceral allies in the obesity wars. Science 307, 1909–1914 (2005). - PubMed
Publication types
MeSH terms
Substances
LinkOut - more resources
Full Text Sources
Other Literature Sources
Miscellaneous
