. 2016 Nov;48(5):1442-1452.
doi: 10.1183/13993003.00129-2016. Epub 2016 Jul 28.

High attenuation areas on chest computed tomography in community-dwelling adults: the MESA study

Affiliations

High attenuation areas on chest computed tomography in community-dwelling adults: the MESA study

Anna J Podolanczuk et al. Eur Respir J. 2016 Nov.

Abstract

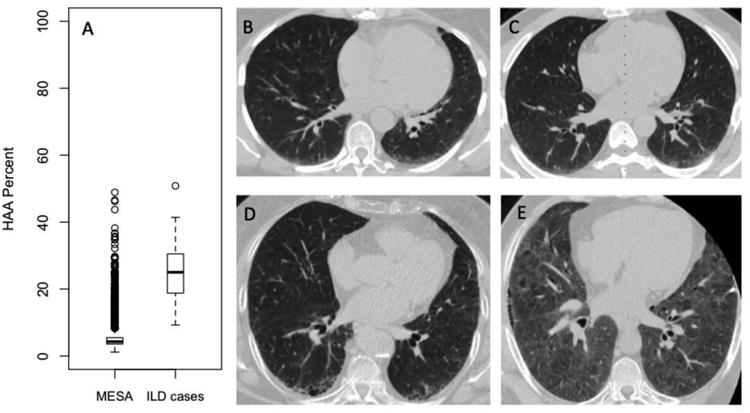
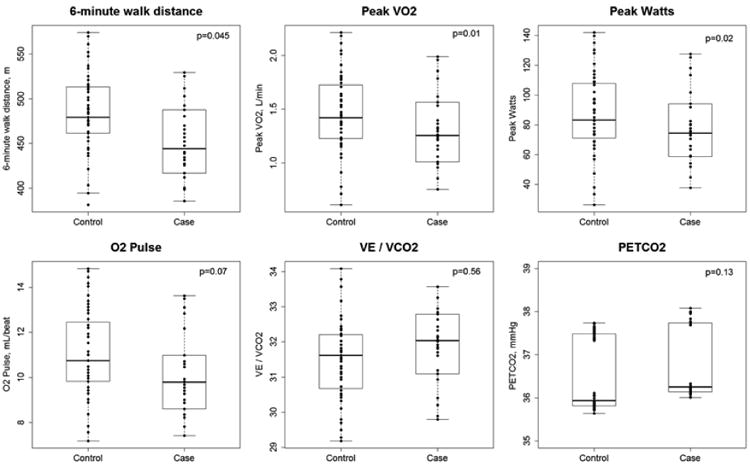
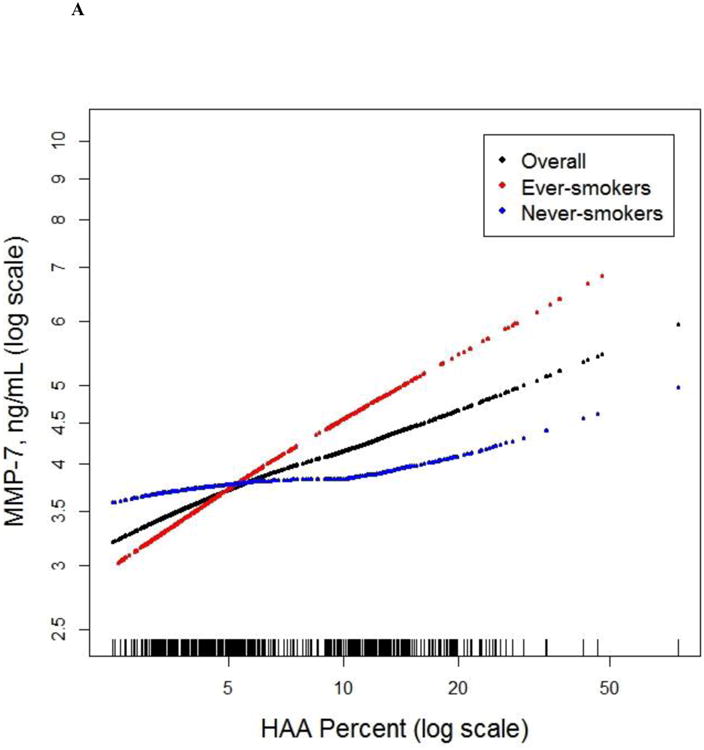
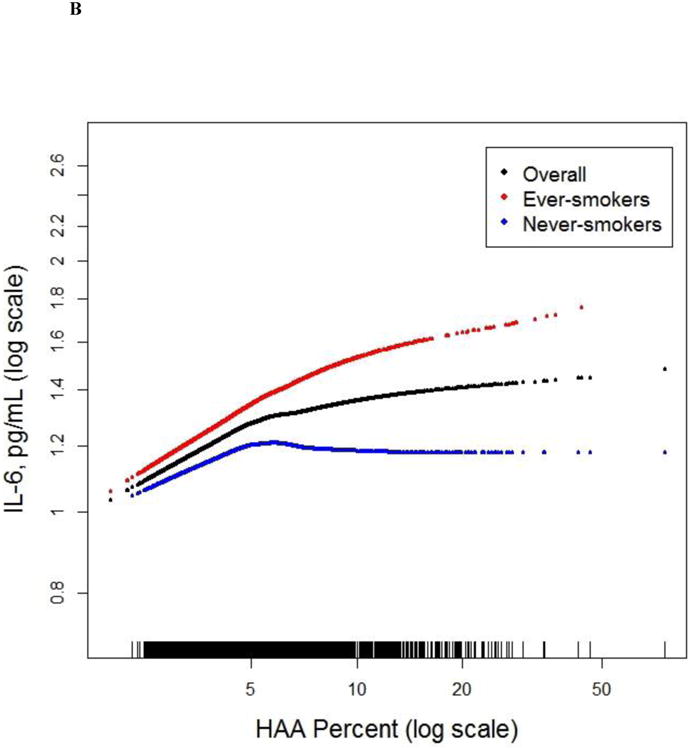
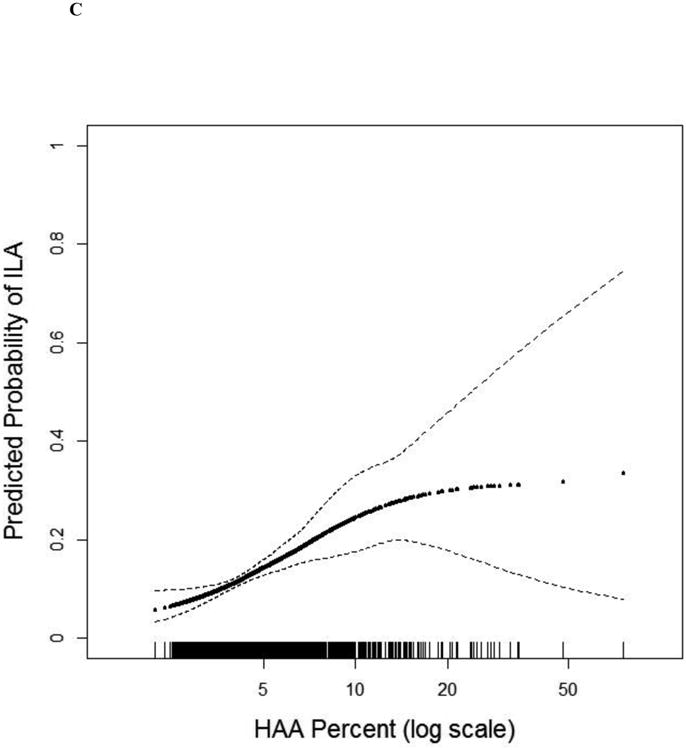
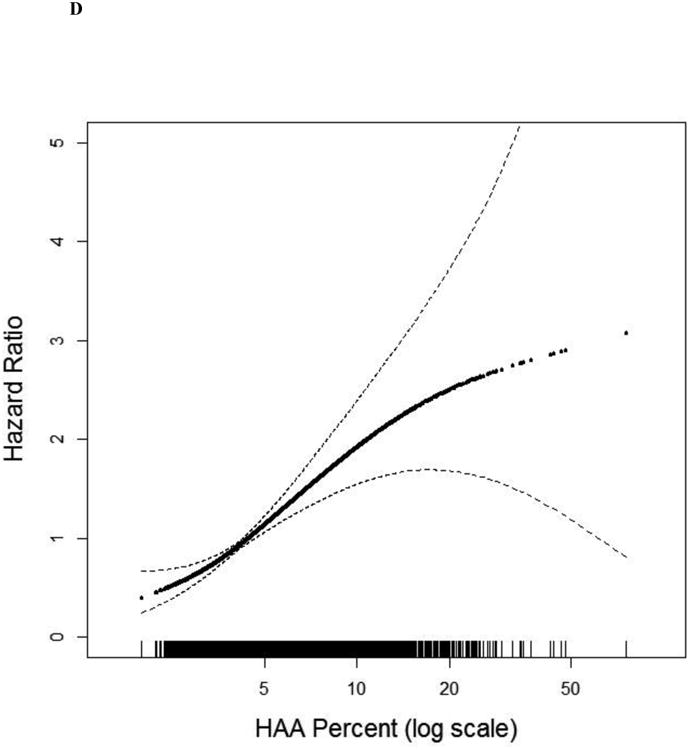
Evidence suggests that lung injury, inflammation and extracellular matrix remodelling precede lung fibrosis in interstitial lung disease (ILD). We examined whether a quantitative measure of increased lung attenuation on computed tomography (CT) detects lung injury, inflammation and extracellular matrix remodelling in community-dwelling adults sampled without regard to respiratory symptoms or smoking.We measured high attenuation areas (HAA; percentage of lung voxels between -600 and -250 Hounsfield Units) on cardiac CT scans of adults enrolled in the Multi-Ethnic Study of Atherosclerosis.HAA was associated with higher serum matrix metalloproteinase-7 (mean adjusted difference 6.3% per HAA doubling, 95% CI 1.3-11.5), higher interleukin-6 (mean adjusted difference 8.8%, 95% CI 4.8-13.0), lower forced vital capacity (FVC) (mean adjusted difference -82 mL, 95% CI -119--44), lower 6-min walk distance (mean adjusted difference -40 m, 95% CI -1--80), higher odds of interstitial lung abnormalities at 9.5 years (adjusted OR 1.95, 95% CI 1.43-2.65), and higher all cause-mortality rate over 12.2 years (HR 1.58, 95% CI 1.39-1.79).High attenuation areas are associated with biomarkers of inflammation and extracellular matrix remodelling, reduced lung function, interstitial lung abnormalities, and a higher risk of death among community-dwelling adults.


Figures

Figure 1
Figure 1
(A) Boxplots of HAA values for 6,813 MESA participants and 48 adults with clinically diagnosed interstitial lung disease enrolled in the Lung Transplant Body Composition Study. Solid horizontal lines represent the median HAA value. Boxes are bound by the upper and lower quartiles. Whiskers extend to 1.5 times the interquartile range. Outliers are represented by open circles. Wilcoxon rank sum test p value< 0.001. (B-E) Selected CT scan images from 4 MESA participants with elevated HAA. (B) Peripheral basilar ground glass abnormality with HAA=8.8% of the imaged lung. (C) Ground-glass opacity with HAA=10.0% of the imaged lung. (D) Early peripheral reticular and cystic changes with HAA=10.2% of the imaged lung. (E) Diffuse ground glass abnormality and an area of peripheral reticular changes with HAA=27.7% of imaged lung. All participants had ILA on follow-up CT scans at MESA exam 5 (median follow-up time 9.5 years). None of the participants were clinically diagnosed with ILD.
Figure 2
Figure 2
Boxplots of exercise capacity at 10.8 years of follow-up in 30 cases with elevated HAA (>7.5%) and 59 controls without elevated HAA on MESA baseline CT scans. O2 pulse, V̇E/V̇CO2 and PetCO2 were measured at peak exercise. Dots represent individual predicted values adjusted for age and gender. Solid horizontal lines represent the median HAA value. Boxes are bound by the upper and lower quartiles. Whiskers extend to 1.5 times the interquartile range.
Figure 3
Figure 3
Continuous associations between HAA and (a) MMP-7 (overall and stratified by smoking status) at baseline among 908 MESA participants, (b) IL-6 (overall and stratified by smoking status) at baseline among 6,621 MESA participants, (c) ILA 9.5 years following HAA measurement among 2,430 MESA participants, and (d) mortality over 12.2 years of follow-up among 6,808 MESA participants. All models adjusted for age, gender, race/ethnicity, educational attainment, height, BMI, waist circumference, glomerular filtration rate (GFR), study site, mA dose, total volume imaged lung and percent emphysema; overall models also adjusted for smoking status and cigarette pack-years. (a) Overall p for association 0.01, p for non-linearity 0.37; among ever-smokers, p for association <0.001, p for non-linearity 0.70; among never-smokers, p for association 0.69, p for non-linearity 0.18; p for smoking interaction <0.001. (b) Overall p for association <0.001, p for non-linearity 0.005; among ever-smokers p for association <0.001; p for non-linearity 0.17; among never-smokers p for association 0.28; p for non-linearity 0.02; p for smoking interaction 0.11. (c) P for association <0.001; p for non-linearity 0.05. (d) P for association <0.001. Black points are the overall effect estimate; thin dashed lines are the 95% confidence bands; red points are the effect estimate among ever-smokers; blue points are the effect estimate among never-smokers. Each point in the graphs and each vertical hashmark in the rug plot along the x-axis represent one study participant.
Figure 3
Figure 3
Continuous associations between HAA and (a) MMP-7 (overall and stratified by smoking status) at baseline among 908 MESA participants, (b) IL-6 (overall and stratified by smoking status) at baseline among 6,621 MESA participants, (c) ILA 9.5 years following HAA measurement among 2,430 MESA participants, and (d) mortality over 12.2 years of follow-up among 6,808 MESA participants. All models adjusted for age, gender, race/ethnicity, educational attainment, height, BMI, waist circumference, glomerular filtration rate (GFR), study site, mA dose, total volume imaged lung and percent emphysema; overall models also adjusted for smoking status and cigarette pack-years. (a) Overall p for association 0.01, p for non-linearity 0.37; among ever-smokers, p for association <0.001, p for non-linearity 0.70; among never-smokers, p for association 0.69, p for non-linearity 0.18; p for smoking interaction <0.001. (b) Overall p for association <0.001, p for non-linearity 0.005; among ever-smokers p for association <0.001; p for non-linearity 0.17; among never-smokers p for association 0.28; p for non-linearity 0.02; p for smoking interaction 0.11. (c) P for association <0.001; p for non-linearity 0.05. (d) P for association <0.001. Black points are the overall effect estimate; thin dashed lines are the 95% confidence bands; red points are the effect estimate among ever-smokers; blue points are the effect estimate among never-smokers. Each point in the graphs and each vertical hashmark in the rug plot along the x-axis represent one study participant.

Comment in

References

    1. Selman M, Pardo A. Alveolar epithelial cell disintegrity and subsequent activation: a key process in pulmonary fibrosis. Am J Respir Crit Care Med. 2012;186(2):119–121. - PubMed
    1. Zoz DF, Lawson WE, Blackwell TS. Idiopathic pulmonary fibrosis: a disorder of epithelial cell dysfunction. Am J Med Sci. 2011;341(6):435–438. - PMC - PubMed
    1. Rosas IO, Ren P, Avila NA, Chow CK, Franks TJ, Travis WD, McCoy JP, Jr, May RM, Wu HP, Nguyen DM, Arcos-Burgos M, MacDonald SD, Gochuico BR. Early interstitial lung disease in familial pulmonary fibrosis. Am J Respir Crit Care Med. 2007;176(7):698–705. - PMC - PubMed
    1. Doyle TJ, Hunninghake GM, Rosas IO. Subclinical interstitial lung disease: why you should care. Am J Respir Crit Care Med. 2012;185(11):1147–1153. - PMC - PubMed
    1. Kropski JA, Pritchett JM, Zoz DF, Crossno PF, Markin C, Garnett ET, Degryse AL, Mitchell DB, Polosukhin VV, Rickman OB, Choi L, Cheng DS, McConaha ME, Jones BR, Gleaves LA, McMahon FB, Worrell JA, Solus JF, Ware LB, Lee JW, Massion PP, Zaynagetdinov R, White ES, Kurtis JD, Johnson JE, Groshong SD, Lancaster LH, Young LR, Steele MP, Phillips JA, Iii, Cogan JD, Loyd JE, Lawson WE, Blackwell TS. Extensive Phenotyping of Individuals At-risk for Familial Interstitial Pneumonia Reveals Clues to the Pathogenesis of Interstitial Lung Disease. Am J Respir Crit Care Med. 2014 - PMC - PubMed

Publication types

MeSH terms

Grants and funding