. 2016 Mar 10;5(6):e1149673.
doi: 10.1080/2162402X.2016.1149673. eCollection 2016 Jun.

Contribution of RIP3 and MLKL to immunogenic cell death signaling in cancer chemotherapy

Affiliations

Contribution of RIP3 and MLKL to immunogenic cell death signaling in cancer chemotherapy

Heng Yang et al. Oncoimmunology. .

Abstract

Chemotherapy can reinstate anticancer immunosurveillance through inducing tumor immunogenic cell death (ICD). Here, we show that anthracyclines and oxaliplatin can trigger necroptosis in murine cancer cell lines expressing receptor-interacting serine-threonine kinase 3 (RIP3) and mixed lineage kinase domain-like (MLKL). Necroptotic cells featured biochemical hallmarks of ICD and stimulated anticancer immune responses in vivo. Chemotherapy normally killed Rip3 (-/-) and Mlkl (-/-) tumor cells and normally induced caspase-3 activation in such cells, yet was unable to reduce their growth in vivo. RIP3 or MLKL deficiency abolished the capacity of dying cancer cells to elicit an immune response. This could be attributed to reduced release of ATP and high mobility group box 1 (HMGB1) by RIP3 and MLKL-deficient cells. Measures designed to compensate for deficient ATP and HMGB1 signaling restored the chemotherapeutic response of Rip3 (-/-) and Mlkl (-/-) cancers. Altogether, these results suggest that RIP3 and MLKL can contribute to ICD signaling and tumor immunogenicity.

Keywords: ATP; HMGB1; Necroptosis; Tumor immunogenicity; chemotherapy; cytotoxic T cells; dendritic cells.


Figures

Figure 1.
Figure 1.
Differential susceptibility of murine tumor cell lines to necroptosis induction in vitro. (A–B) TC-1 cells were cultured for 48 h in the absence or presence of the combination of recombinant tumor necrosis factor-α (TNF), the synthetic SMAC mimetic BV6, and the caspase inhibitor z-VAD-FMK (TSZ), followed by staining with Annexin V-PE plus the vital dye DAPI and cytofluorometric analysis. Representative cytofluorometric pictograms are shown in (A) and quantitative summary (means ± SD of triplicates) are shown in (B). (C–D) Induction of cell death with various drug combinations. TC-1 cells were cultured in the absence or presence of TNF alone, TNF+SMAC mimetic (TS), TSZ, Necrostatin-1 (Nec-1) or TSZ+Nec-1. Representative FACS plots are shown in (C) and quantitative data (means ± SD of triplicates) are revealed in (D). See also Fig. S1 the similar data obtained with EL4 cells. (E) Expression of necroptosis-relevant proteins in distinct cell lines, as determined by immunoblot analysis. Results are representative of at least three independent experiments. p values were calculated by means of the unpaired Student's t test. ***p < 0.001.
Figure 2.
Figure 2.
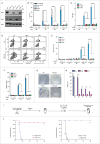
Characterization of TSZ-induced signs of immunogenic cell death. (A) Confirmation of the knockout of Rip3 and Mlkl in TC-1 cells by immunoblot. Two different guide RNAs (g1, g2) were used to knockout each of the genes by CRISPR/Cas9 technology. (B–F) Comparison of cell death induction and ICD parameters after TSZ treatment. WT, Rip3−/− and Mlkl−/− TC-1 cells were treated with TSZ for indicated period. Cell death, as measured by staining with Annexin V-PE plus DAPI with cytofluorometry (B), extracellular ATP in the supernatant dosed with a luminescence reaction (C), exposure of CRT on the cell surface as detected by CRT+ viable (DAPI) staining (see representative cytofluorometric plots in (D) and the corresponding quantitative data in (E), as well as HMGB1 release in the supernatant quantified with ELISA (F) were shown. See also Fig. S2 the similar data obtained with EL4 cells. (G, H) Clonogenic potential of cells treated with MTX or TSZ. Cells were left untreated (Co) or treated for the indicated times with MTX or TSZ, then washed and plated. Representative wells reflecting the colony formation are shown in (G) and quantitative results are reported in (H). (I, J) Immunogenicity of TSZ-treated WT TC-1 cells. Cells were killed in vitro by freeze-thawing (F/T), or incubation with mitoxantrone (MTX) or TSZ, then washed three times (to avoid any carryover of cell death inducers) before injecting subcutaneously (s.c.) into the right flank of naive C57Bl/6 mice. One week later, mice were rechallenged with untreated, live TC-1 cells, on the opposite flank, and tumor occurrence was monitored. A schematic view of the experiment is shown in (I), and Kaplan Meyer curves are demonstrated in (J). Columns indicate means ± SD and statistics were performed with unpaired Student's t test. Tumor incidence in vaccination experiments was analyzed by means of the Log-rank test. *p < 0.05, **p < 0.01, ***p < 0.001. One representative result out of 2–6 independent experiments is shown.
Figure 3.
Figure 3.
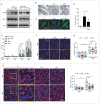
Induction of necroptosis-related features by mitoxantrone (MTX). (A) Induction of MLKL phosphorylation by MTX. TC-1 cells were cultured in vitro in the absence (Co) or presence of MTX alone or in combination with zVAD, followed by immunoblot detection of phospho-MLKL and bulk MLKL. The lysate from MTX+zVAD-treated cells was subjected to treatment with λ-phosphatase alone (λ) or in combination with its inhibitor (λ+i). (B) Representative transmission electron microphotographs of TC-1 cells cultured in the absence (Co) or presence of TSZ or MTX. (C, D) Induction of necrosome formation by MTX. Mlkl−/− TC-1 cells engineered to express a RIP3-GFP fusion protein were cultured in the presence of MTX alone for 24 h or in the presence or necrostatin-1 (Nec-1), counterstained with Hoechst 33324 and subjected to confocal imaging. Representative microphotographs are shown in (C) and the frequency of cells with cytoplasmic RIP3-GFP speckles are quantitated in (D). (E) Effect of Rip3- or Mlkl-knockout on cell-death elicited by MTX. TC-1 cells with the indicated genotypes were cultured for the indicated time with MTX, followed by the quantitation of cell death by Annexin-V/DAPI. (F, G) The impact of Rip3 or Mlkl deficiency on chemotherapy-induced caspase-3 activation. TC-1 cells (either WT, Rip3k−/− or Mlkl−/−) were injected subcutaneously into C57Bl/6 mice, which received systemic chemotherapy with MTX or PBS as the vehicle control when tumors became palpable. Tumor samples were harvested 48 h after treatment to quantify apoptosis in situ (as marked by positive staining with proteolytically mature, active caspase3 (Casp3a) antibody). Representative images (F) and quantifications (G) are shown. (H, I) Effect of the knockout of Rip3 or Mlkl on the chemotherapy-induced HMGB1 release from tumor cells in vivo. Established TC-1 tumors (either WT, Rip3k−/− or Mlkl−/−) were treated by systemic administration of MTX or vehicle (PBS) control. Two days later, tumors were recovered and subjected to immunofluorescence detection of HMGB1. Necrosis “N” was defined as HMGB1-negative nuclei without signs of chromosome condensation. Representative images are exemplified in (H) and summarized in (I). Columns in (E) show means ± SD. Individual values are reported in (G) and (I) with boxplots indicating the lower and upper quartile plus the median value. p values were calculated by means of the unpaired Student's t test. *p < 0.05, **p < 0.01, ***p < 0.001, ns, non-significant. See also data in Fig. S3.
Figure 4.
Figure 4.
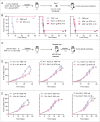
Rip3 and Mlkl contribute to the immunogenicity of chemotherapy-induced cell death. (A, B) Vaccination settings revealing the importance of RIP3 and MLKL for MTX-induced immunogenic cell death. WT, Rip3−/− or Mlkl−/− TC-1 cells were treated with MTX in vitro and then injected subcutaneously into C57BL/6 mice. After seven days, mice were rechallenged with untreated, live TC-1 cells (as depicted in A) and tumor occurrence was monitored (B). (C–E) Chemotherapy of established tumors revealing the role of Rip3 and Mlkl in MTX-induced tumor growth reduction. Mice bearing established WT, Rip3−/− or Mlkl−/− TC-1 or EL4 tumors received systemic intraperitoneal chemotherapy with MTX or oxaliplatin (OXA) as shown in (C), and tumor growth was monitored for vehicle or MTX-treated TC-1 tumors (D) or for vehicle or OXA-treated EL4 tumors (E). Asterisks indicate statistical significance(**p < 0.01, ***p < 0.001, ns, non-significant) determined by Log-rank test (for vaccine setting) or Mann–Whitney U-test (for chemotherapy setting). One out of two representative experiments was shown. See also data comparing tumor growth in WT versus nude mice in Fig. S4.
Figure 5.
Figure 5.
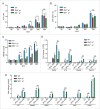
Requirement of Rip3 and Mlkl for the manifestation of some hallmarks of immunogenic cell death. (A) Comparison of ATP release from WT, Rip3−/− or Mlkl−/− TC-1 treated with MTX at indicated time points. (B) Cytoplasmic CRT exposure by WT, Rip3−/− or Mlkl−/− TC-1 in response to MTX, as determined by immunofluorescence staining and cytofluorometry. (C) HMGB1 release from WT, Rip3−/− or Mlkl−/− TC-1 treated with MTX. (D, E) Induction of type 1 IFN response genes in WT, Rip3−/− or Mlkl−/− TC-1 treated with MTX, as determined by quantitative RT-PCR reaction. Results are shown as fold increase compared to the untreated control WT cells. Histograms indicate means ± SD of triplicates from one representative experiment out of two–six repeats. p values were calculated by means of the unpaired Student's t test. *p < 0.05, **p < 0.01. All date shown in this figure were obtained with the knockout clones generated with gRNA1 for Rip3 and Mlkl. See also data obtained with another series of knockout clones in Fig. S5.
Figure 6.
Figure 6.
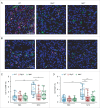
Requirement of Rip3 and Mlkl for the MTX-elicited immune infiltration in vivo. (A–D) Mice bearing established TC-1 tumors (WT, Rip3−/−or Mlkl−/−) with the indicated genotypes were treated with vehicle or MTX. Tumors were recovered at day 2 after MTX treatment and stained for the detection of CD11C+CD86+ dendritic cells (A). Alternatively, tumors were excised at day 7 post-chemotherapy for the immunofluorescence detection of CD3+CD8+ cytotoxic T lymphocytes (B). Representative images of MTX-treated tumor are exemplified in (A, B) and quantitative results are shown in (C, D). Results are shown as Box-and-Whisker plots merged with dot plots showing individual values. p values were calculated by means of the unpaired Student's t test. **p < 0.01, ***p < 0.001.
Figure 7.
Figure 7.
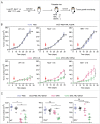
Restoration of deficient chemotherapeutic responses of Rip3−/− or Mlkl−/− cancers. (A–C) Mice bearing established WT, Rip3−/− or Mlkl−/− TC-1 cancers received intraperitoneal injections of mitoxantrone (MTX) alone or together with dendrophilin A (DENA, injected intravenously) and ARL67156 (ARL, injected locally into the tumor) on the same day, and cancer growth was monitored as indicated in (A). Complete tumor growth curves are shown in (B). For quantitative comparisons, the final tumor sizes were indicated for each individual mouse (C). Dot plots indicate means ± SEM. p values were calculated by means of Mann–Whitney U-test. *p < 0.05, **p < 0.01, ***p < 0.001, ns, not significant.

References

    1. Vesely MD, Kershaw MH, Schreiber RD, Smyth MJ. Natural innate and adaptive immunity to cancer. Annu Rev Immunol 2011; 29:235-71; PMID:21219185; http://dx.doi.org/10.1146/annurev-immunol-031210-101324 - DOI - PubMed
    1. Sharma P, Allison JP. Immune checkpoint targeting in cancer therapy: toward combination strategies with curative potential. Cell 2015; 161:205-14; PMID:25860605; http://dx.doi.org/10.1016/j.cell.2015.03.030 - DOI - PMC - PubMed
    1. Galluzzi L, Vacchelli E, Bravo-San Pedro JM, Buque A, Senovilla L, Baracco EE, Bloy N, Castoldi F, Abastado JP, Agostinis P et al.. Classification of current anticancer immunotherapies. Oncotarget 2014; 5:12472-508; PMID:25537519; http://dx.doi.org/10.18632/oncotarget.2998 - DOI - PMC - PubMed
    1. Zitvogel L, Galluzzi L, Smyth MJ, Kroemer G. Mechanism of action of conventional and targeted anticancer therapies: reinstating immunosurveillance. Immunity 2013; 39:74-88; PMID:23890065; http://dx.doi.org/10.1016/j.immuni.2013.06.014 - DOI - PubMed
    1. Denkert C, Loibl S, Noske A, Roller M, Muller BM, Komor M, Budczies J, Darb-Esfahani S, Kronenwett R, Hanusch C et al.. Tumor-associated lymphocytes as an independent predictor of response to neoadjuvant chemotherapy in breast cancer. J Clin Oncol 2010; 28:105-13; PMID:19917869; http://dx.doi.org/10.1200/JCO.2009.23.7370 - DOI - PubMed

Publication types