. 2016 Mar 10;5(6):e1151592.
doi: 10.1080/2162402X.2016.1151592. eCollection 2016 Jun.

A Tec kinase BTK inhibitor ibrutinib promotes maturation and activation of dendritic cells

Affiliations

A Tec kinase BTK inhibitor ibrutinib promotes maturation and activation of dendritic cells

Gayathri Natarajan et al. Oncoimmunology. .

Abstract

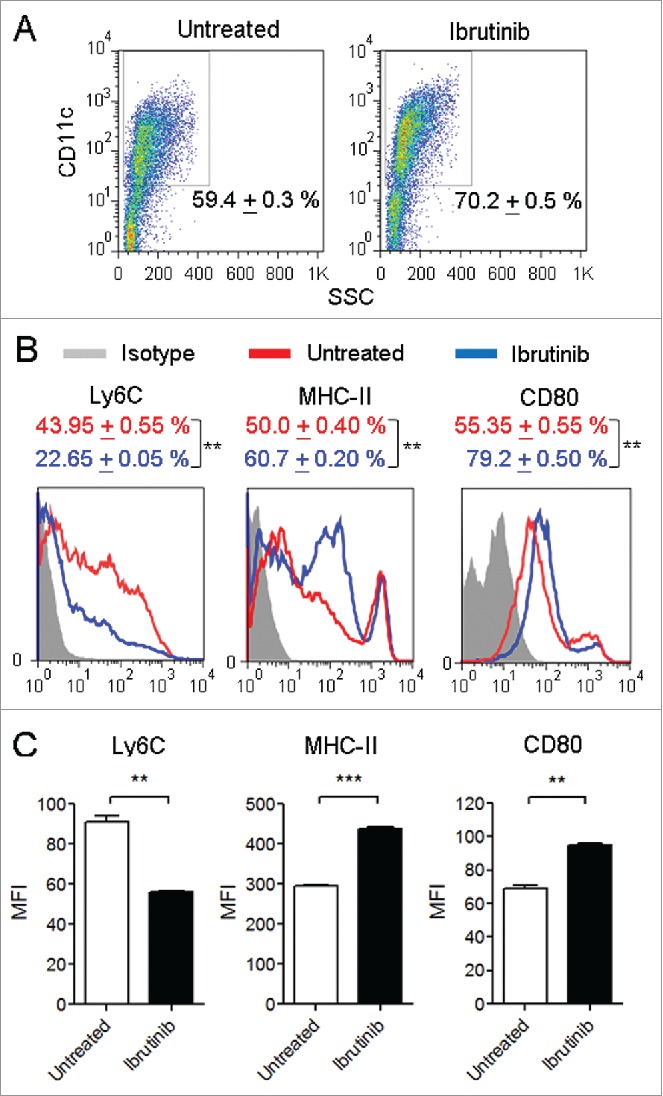
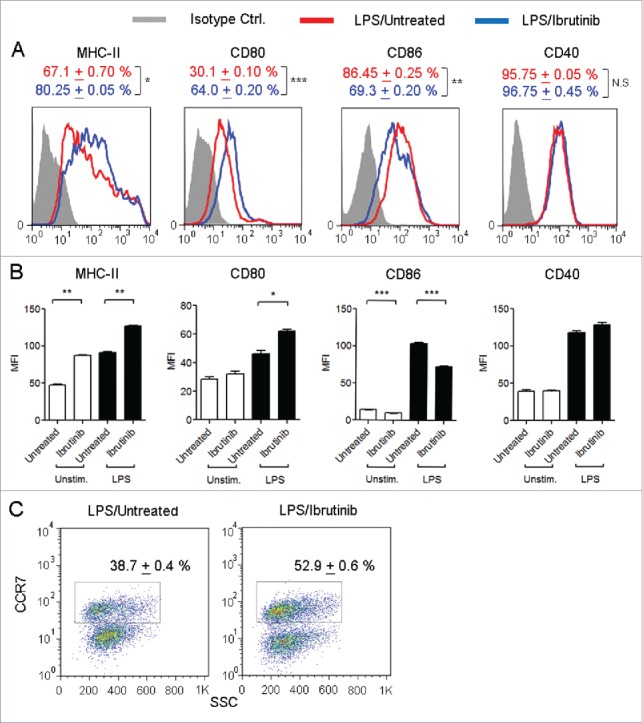
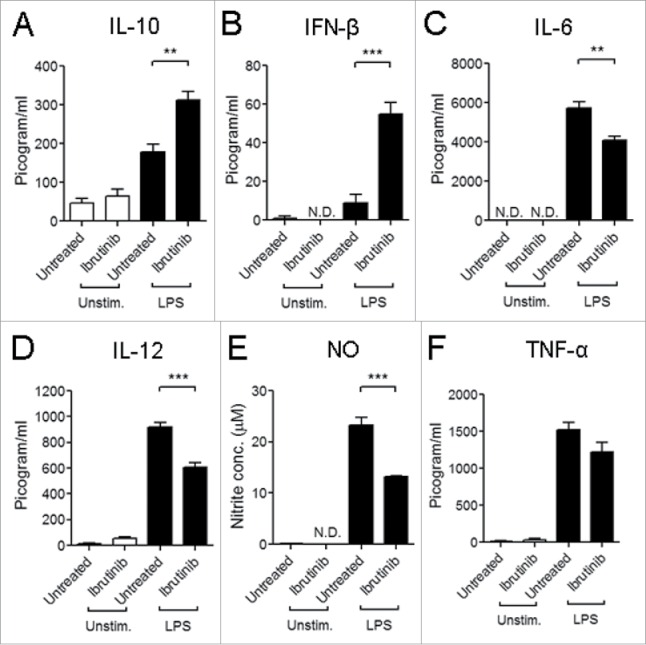
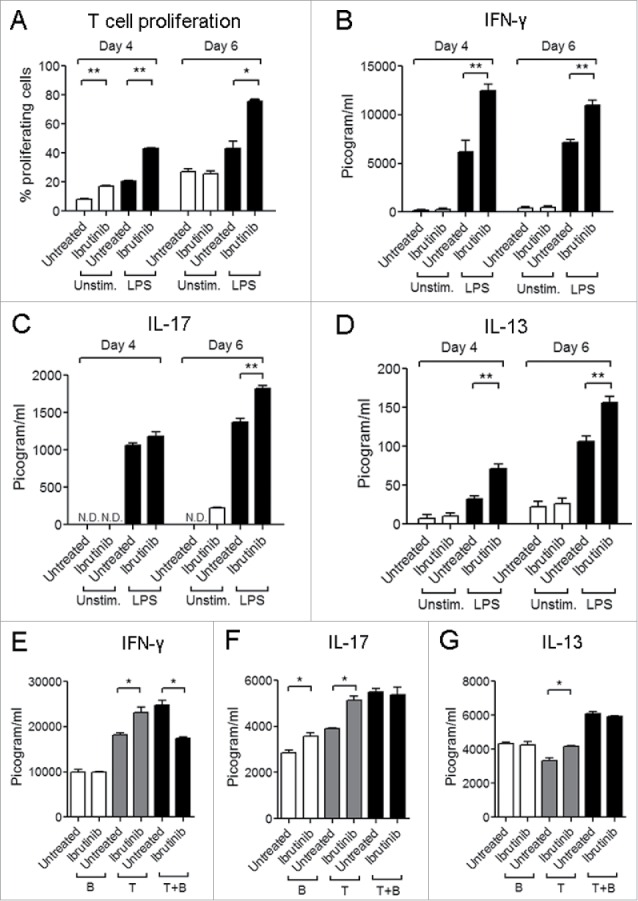
Ibrutinib, a BTK inhibitor, is currently used to treat various hematological malignancies. We evaluated whether ibrutinib treatment during development of murine bone marrow-derived dendritic cells (DCs) modulates their maturation and activation. Ibrutinib treatment increased the proportion of CD11c(+) DCs, upregulated the expression of MHC-II and CD80 and downregulated Ly6C expression by DCs. Additionally, ibrutinib treatment led to an increase in MHC-II(+), CD80(+) and CCR7(+) DCs but a decrease in CD86(+) DCs upon LPS stimulation. LPS/ibrutinib-treated DCs displayed increased IFNβ and IL-10 synthesis and decreased IL-6, IL-12 and NO production compared to DCs stimulated with LPS alone. Finally, LPS/ibrutinib-treated DCs promoted higher rates of CD4(+) T cell proliferation and cytokine production compared to LPS only stimulated DCs. Taken together, our results indicate that ibrutinib enhances the maturation and activation of DCs to promote CD4(+) T cell activation which could be exploited for the development of DC-based cancer therapies.

Keywords: BTK; Ibrutinib; LPS; T cell; dendritic cell.


Figures

Figure 1.
Figure 1.
Ibrutinib treatment enhances the development and maturation of DCs. (A) Dot plots show the percentages of CD11c+ DCs in untreated and ibrutinib-treated DC cultures. Numbers denote mean + SEM of duplicate percentage values. (B) Histograms show the expressions of Ly6C, MHC-II and CD80 in CD11c+ DCs from untreated and ibrutinib-treated DC cultures. Numbers denote mean + SEM of duplicate percentage values of cells expressing the respective surface molecule. (C) Mean fluorescence intensities of Ly6C, MHC-II and CD80 expression in CD11c+ DCs from untreated and ibrutinib-treated DC cultures. The data are presented as mean + SEM of duplicate MFI values. Bone marrow cells from C57BL/6 mice were cultured in the presence of GM-CSF, without or with 1 µM ibrutinib for 7 d to generate untreated and ibrutinib-treated DCs, respectively. At Day 7, DC cultures were stained with the fluorescently labeled antibodies for the respective surface markers and their expressions were determined by flow cytometry. The data presented are representative of three independent experiments. **p < 0.001, ***p < 0.0001.
Figure 2.
Figure 2.
Ibrutinib differentially regulates the expression of MHC-II, co-stimulatory molecules and CCR7 on LPS-treated DCs. (A) Histograms show the expressions of MHC-II, CD80, CD86 and CD40 in CD11c+ DCs from LPS/untreated and LPS/ibrutinib-treated DCs. Numbers denote mean + SEM of duplicate percentage values. (B) Mean fluorescence intensities of MHC-II, CD80, CD86 and CD40 on CD11c+ DCs from untreated and ibrutinib-treated DCs upon LPS stimulation. The data are presented as mean + SEM of duplicate MFI values. (C) Dot plots show the percentage of CCR7+ cells in CD11c+ DCs from LPS/untreated and LPS/ibrutinib-treated DC cultures. Numbers denote mean + SEM of duplicate percentage values. Untreated and ibrutinib-treated DCs were treated with control (media) or LPS (1 μg/mL) for 24 h. After 24 h, cells were stained with fluorescently labeled antibody for the respective surface molecules and their expressions were determined by flow cytometry. Analyses were conducted by gating on CD11c+ DCs. The data presented are representative of three independent experiments. *p < 0.05, **p < 0.001, ***p < 0.0001.
Figure 3.
Figure 3.
Ibrutinib differentially regulates cytokine production and nitric oxide (NO) responses by LPS-treated DCs. (A) IL-10, (B) IFNβ, (C) IL-6, (D) IL-12, (E) NO and (F) TNF-α production by untreated and ibrutinib-treated DCs upon LPS stimulation. Untreated and ibrutinib-treated DCs were treated with control (media) or LPS (1 μg/mL). After 24 h of LPS treatment, cytokine production was determined in the culture supernatants by ELISA. After 48 h of LPS treatment, NO levels were determined in the culture supernatants by measuring nitrite concentrations using Griess assay. The data are presented as mean + SEM of triplicate sample values from two independent experiments. **p < 0.001, ***p < 0.0001.
Figure 4.
Figure 4.
Ibrutinib-treated DCs enhance T cell proliferation and production of T cell derived cytokines. (A) Analysis of T cell proliferation upon co-culture with untreated, ibrutinib-treated, LPS/untreated or LPS/ibrutinib-treated DCs. Untreated and ibrutinib-treated DCs were pulsed with OVA (10 μg/mL) for 2 h prior to treatment with LPS (1 μg/mL) for 22 h. After OVA/LPS stimulation, DCs were cultured in 1:4 ratio with CFSE-stained T cells enriched from spleens of OT-II mice for 4 or 6 d. At Day 4 and 6, cells from co-culture were stained with anti-CD4 antibody and T cell proliferation was measured by flow cytometry. Analyses were conducted by gating on CD4+ population. Production of cytokines (B) IFNγ, (C) IL-17 and (D) IL-13 in co-culture experiments performed as mentioned in A. At Day 4 and 6 of co-culture, cell culture supernatants were collected and the respective cytokines were measured by ELISA. Production of cytokines (E) IFNγ, (F) IL-17 and G) IL-13 in DC, T cell and B cell co-culture experiments. OVA pulsed LPS/untreated and LPS/ibrutinib-treated DCs were cultured in 1:4 ratio each with B cell fraction (B), T cell fraction (T) or both (T + B) prepared by nylon wool enrichment from spleens of OT.II mice for 6 d and cytokines were measured in the culture supernatants. The data are presented as mean + SEM of duplicate sample values and are representative of two independent experiments. *p < 0.05, **p < 0.001.

References

    1. Berglöf A, Hamasy AJ, Meinke S, Palma M, Krstic A, Månsson R, Kimby E, Österborg A, Smith CI. Targets for Ibrutinib beyond B cell malignancies. Scand J Immunol 2015; 82(3):208-17; PMID:26111359; http://dx.doi.org/10.1111/sji.12333 - DOI - PMC - PubMed
    1. Chang BY, Huang MM, Francesco M, Chen J, Sokolove J, Magadala P, Robinson WH, Buggy JJ. The Bruton tyrosine kinase inhibitor PCI-32765 ameliorates autoimmune arthritis by inhibition of multiple effector cells. Arthritis Res Ther 2011; 13:R115; PMID:21752263; http://dx.doi.org/10.1186/ar3400 - DOI - PMC - PubMed
    1. Natarajan G, Terrazas C, Oghumu S, Varikuti S, Dubovsky JA, Byrd JC, Satoskar AR. Ibrutinib enhances IL-17 response by modulating the function of bone marrow derived dendritic cells. OncoImmunology 2015; 5:e1057385; PMID:26942065; http://dx.doi.org/10.1080/2162402X.2015.1057385. - DOI - PMC - PubMed
    1. Kawakami Y, Inagaki N, Salek-ardakani S, Kitaura J, Tanaka H, Nagao K. Regulation of dendritic cell maturation and function by Bruton's tyrosine kinase via IL-10 and Stat3. Proc Natl Acad Sci USA 2006; 103:153-8; PMID:16371463; http://dx.doi.org/10.1073/pnas.0509784103 - DOI - PMC - PubMed
    1. Oghumu S, Varikuti S, Terrazas C, Kotov D, Nasser MW, Powell CA, Ganju RK, Satoskar AR. CXCR3 deficiency enhances tumor progression by promoting macrophage M2 polarization in a murine breast cancer model. Immunology 2014; 143(1):109-19; PMID:24679047; http://dx.doi.org/10.1111/imm.12293 - DOI - PMC - PubMed

Publication types

LinkOut - more resources