. 2016 Mar 16;5(6):e1163461.
doi: 10.1080/2162402X.2016.1163461. eCollection 2016 Jun.

Natural killer cells require monocytic Gr-1(+)/CD11b(+) myeloid cells to eradicate orthotopically engrafted glioma cells

Affiliations

Natural killer cells require monocytic Gr-1(+)/CD11b(+) myeloid cells to eradicate orthotopically engrafted glioma cells

Gregory J Baker et al. Oncoimmunology. .

Abstract

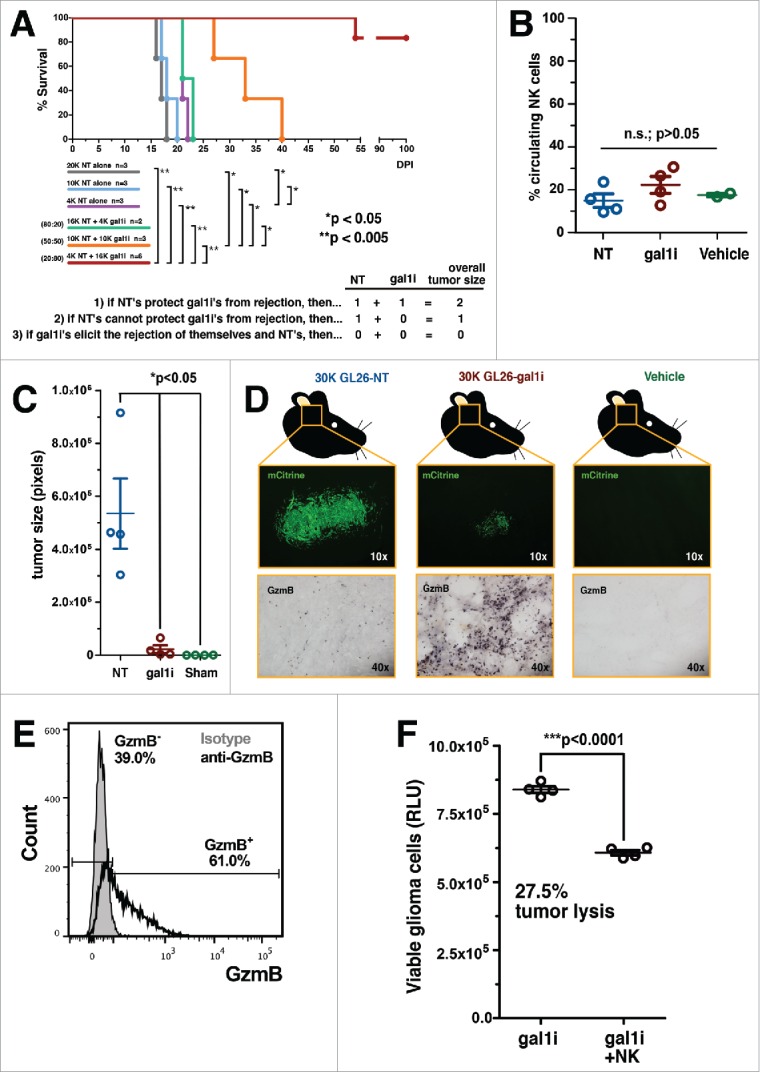
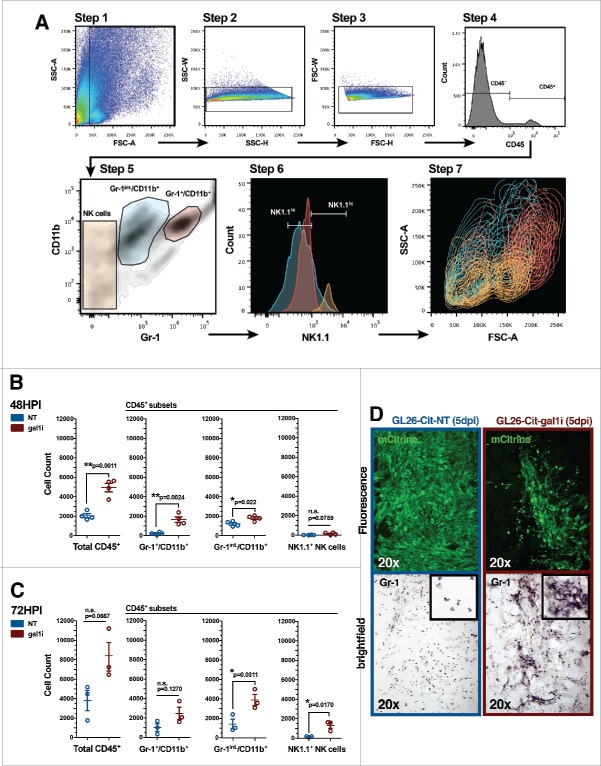
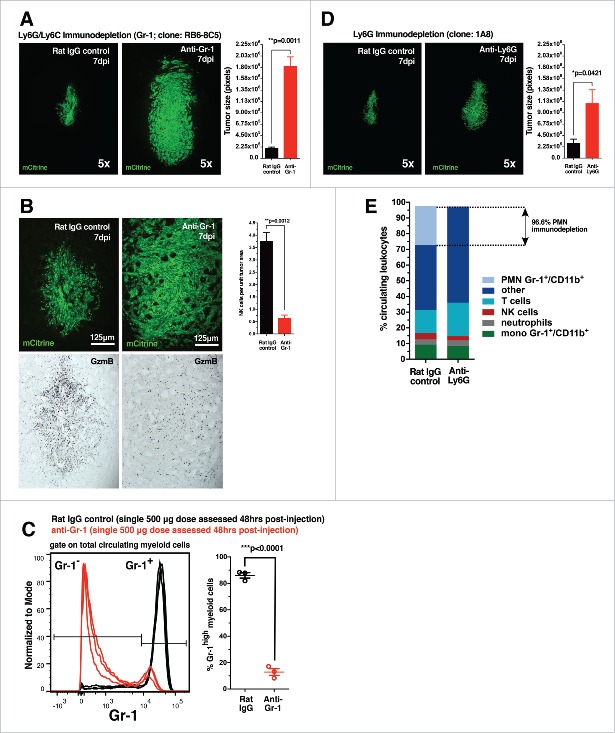
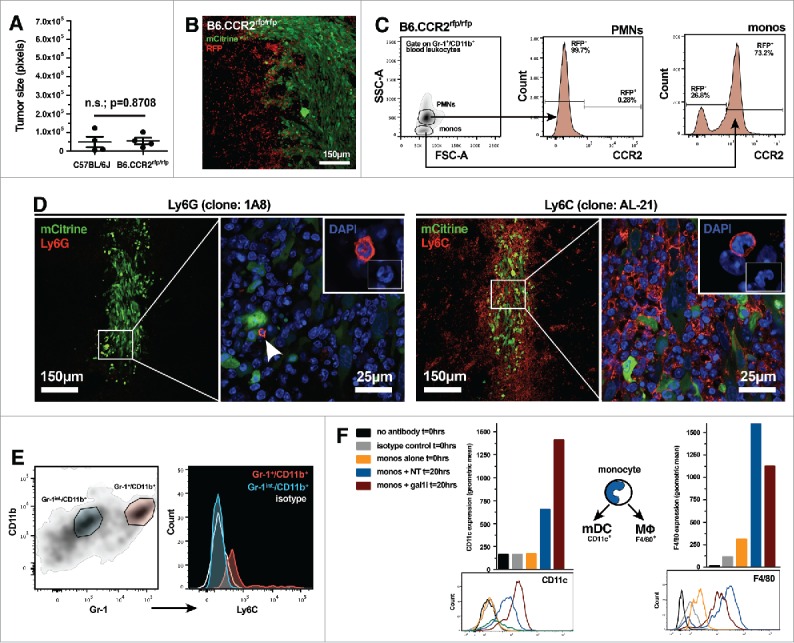
Malignant gliomas are resistant to natural killer (NK) cell immune surveillance. However, the mechanisms used by these cancers to suppress antitumor NK cell activity remain poorly understood. We have recently reported on a novel mechanism of innate immune evasion characterized by the overexpression of the carbohydrate-binding protein galectin-1 by both mouse and rat malignant glioma. Here, we investigate the cytokine profile of galectin-1-deficient GL26 cells and describe the process by which these tumors are targeted by the early innate immune system in RAG1(-/-) and C57BL/6J mice. Our data reveal that galectin-1 knockdown in GL26 cells heightens their inflammatory status leading to the rapid recruitment of Gr-1(+)/CD11b(+) myeloid cells and NK1.1(+) NK cells into the brain tumor microenvironment, culminating in tumor clearance. We show that immunodepletion of Gr-1(+) myeloid cells in RAG1(-/-) mice permits the growth of galectin-1-deficient glioma despite the presence of NK cells, thus demonstrating an essential role for myeloid cells in the clearance of galectin-1-deficient glioma. Further characterization of tumor-infiltrating Gr-1(+)/CD11b(+) cells reveals that these cells also express CCR2 and Ly-6C, markers consistent with inflammatory monocytes. Our results demonstrate that Gr-1(+)/CD11b(+) myeloid cells, often referred to as myeloid-derived suppressor cells (MDSCs), are required for antitumor NK cell activity against galectin-1-deficient GL26 glioma. We conclude that glioma-derived galectin-1 represents an important factor in dictating the phenotypic behavior of monocytic Gr-1(+)/CD11b(+) myeloid cells. Galectin-1 suppression may be a valuable treatment approach for clinical glioma by promoting their innate immune-mediated recognition and clearance through the concerted effort of innate myeloid and lymphoid cell lineages.

Keywords: GL26; Galectin-1 (gal-1); Gr-1+/CD11b+ myeloid cells; gal-1-deficient glioma; natural killer (NK) cells.


Figures

Figure 1.
Figure 1.
Gal-1-deficient GL26 glioma cells are proinflammatory. (A) Kaplan–Meier survival analysis of RAG1−/− mice bearing GL26-NT cells alone (gray, blue and purple curves), or together with an increasing percentage of GL26-gal1i cells (green, orange and red curves). NT:gal1i ratios are indicated to the left of the three co-implant groups. Three alternative experimental outcomes are shown in the table below. The actual results are consistent with outcome number 3. Mantel–Cox log-rank test detected a significant survival difference between the indicated groups. *p <0.05; **p <0.005. (B) Percentage of circulating NK1.1+ NK cells in RAG1−/− mouse blood 5-d after intracranial engraftment of GL26-NT (n = 4), GL26-gal1i (n = 4), or injection with vehicle alone (n = 2). (C) Quantitative comparison of brain tumor size 5-days after implantation into RAG1−/− mice. GL26-NT (n = 4), GL26-gal1i (n = 4), and vehicle alone (n = 2) groups are shown. (D) Representative histology from the brain tumors represented in panel C showing tumor-derived mCitrine fluorescent protein (top micrographs) and granzyme B (GzmB) expression (bottom micrographs). (E) Circulating CD11blo/NK1.1+ NK cells from RAG1−/− mouse blood demonstrating the expression of GzmB (open black histogram) above isotype control (closed gray histogram). Experiment performed in triplicate. Data from a representative experiment is shown. (F) NK-mediated cytotoxicity assessed using an ATP-dependent luminescence assay showing the level of viable GL26-gal1i cells (RLU) alone, or in the presence of a 10:1 E:T ratio of circulating NK1.1+ NK cells from RAG1−/− mice after 4 h of co-culture (n = 4 technical replicates per group, experiment repeated × 3).
Figure 2.
Figure 2.
Gal-1-deficient GL26 glioma cells upregulate cytokine expression. (A–C) Relative expression values of detectable cytokines in GL26 whole cell lysate (A), GL26 conditioned media (B), and brain tissue homogenate containing GL26 gliomas 72 h post-engraftment (C). Red bars indicate GL26-gal1i cells, blue bars indicate GL26-NT cells. Numbers associated with each NT/gal1i bar graph pair correspond to the raw cytokine array data shown below. Error bars in panels A and B correspond to two technical replicates (n = 2). Error bars associated with the data in panel C correspond to two biological replicates (n = 2) of each tumor type. Positive control spots for each array are shown in the upper-left, upper-right, and lower-left corners. Negative control spots are at the lower-right corner of each array. The positive control spots in the arrays associated with panels A and B are overexposed and appear red. Statistical analysis was performed by unpaired, two-tailed student's t-tests. Associated p values are shown above each cytokine.
Figure 3.
Figure 3.
PBMCs preferentially infiltrate the early gal-1-deficient glioma microenvironment. (A) Gating strategy used to assess tumor-infiltrating PBMCs. Step 1: total cells extracted from a 37/70 density centrifugation media gradient interface, gated to exclude cellular debris (FSC-A less than ∼50 K). Steps 2 and 3: doublet discrimination gating. Step 4: CD45 gate to identify immune cells. Step 5: CD45+ cells stratified based on Gr-1 and CD11b expression. Distinct PBMC populations are color-coded. Step 6: color-coded PBMC populations stratified based on NK1.1 expression. Step 7: color-coded PBMC populations shown in Step 6, displayed in contour mode to better visualize the distribution of rare cell populations, backgated onto FSC-A versus SSC-A. NK1.1hi NK cells (orange population) are smaller on FSC-A compared to NK1.1lo myeloid cells (red and cyan populations), as expected, due to their smaller lymphoid size. (B and C) Comparison of the number of glioma-infiltrating PBMCs at 48- (B) and 72- (C) h post-intracranial engraftment. GL26-NT (n = 4) data points are shown in blue. GL26-gal1i (n = 4) data points are shown in red. Statistical analysis was performed using unpaired, two-tailed, Student's t-tests. p values are indicated above each PBMC type. (D) Representative fluorescence (top) and bright-field (bottom) micrographs of Gr-1 immunolabeled brain tissue sections bearing GL26-NT (left column) or GL26-gal1i (right column) tumors 5-d post-engraftment into the striatum of C57BL/6J mice. Bright-field micrographs show Gr-1 immunoreactivity corresponding to the same area shown in the respective fluorescence micrographs above. Insets show aspects of the respective bright-field micrographs at higher zoom for clarity.
Figure 4.
Figure 4.
Gr-1 immunodepletion permits GL26-gal1i tumor growth in RAG1−/− mice. (A) Representative fluorescence micrographs of GL26-gal1i gliomas 7-d post-engraftment into the striatum of RAG1−/− mice treated with rat IgG control antibodies (left; n = 3) or anti-Ly-6G/Ly-6C (i.e., Gr-1) antibodies (clone: RB6-8C5) (right; n = 3). Quantification of brain tumor size (in pixels) in each treatment group is shown to the right. (B) Representative fluorescence micrographs of GL26-gal1i gliomas 7-d post-engraftment into the striatum of RAG1−/− mice treated with rat IgG control antibodies (left; n = 3) or anti-Ly-6G/Ly-6C (i.e., Gr-1) antibodies (clone: RB6-8C5) (right; n = 3). Quantification of GzmB expression per unit tumor area (in pixels) in each treatment group is shown to the right. (C) Immunodepletion of Gr-1+ cells in RAG1−/− mouse blood in response to a single 500 μg dose of the RB6-8C5 clone. (D) Representative fluorescence micrographs of GL26-gal1i gliomas 7-d post-engraftment into the striatum of RAG1−/− mice treated with rat IgG control antibodies (left; n = 3) or anti-Ly-6G-specific antibodies (clone: 1A8) (right; n = 3). Quantification of brain tumor size (in pixels) in each treatment group is shown to the right. (E) Stacked bar graph showing the breakdown of total circulating leukocytes in RAG1−/− 24-h after a single 600 μg dose of the anti-Ly-6G 1A8 clone.
Figure 5.
Figure 5.
Gr-1+/CD11b+ myeloid cells that infiltrate early gal-1-deficient glioma express markers of inflammatory monocytes. (A) Quantification of GL26-gal1i tumor size 7-d after intracranial engraftment in wild-type C57BL/6J (n = 4) or B6.CCR2−/− (n = 4) mice. (B) Scanning fluorescence confocal analysis of GL26-gal1i glioma (green) 48-h post-engraftment into the brain of a B6.CCR2−/− mouse showing the presence of numerous RFP+ cells (red), a surrogate marker for cells that normally express CCR2. (C) Flow cytometric analysis of circulating leukocytes from tumor-naive B6.CCR2−/− mice reveals that only the monocytic subtype of Gr-1+/CD11b+ myeloid cell expresses RFP. (D) Fluorescence immunohistochemical analysis on brain tissue sections bearing GL26-gal1i 7-d post-engraftment into wild-type C57BL/6J mice (n = 4) using anti-Ly-6G (clone: 1A8) (left two panels) or anti-Ly-6C (clone: AL-21) (right two panels) antibodies, experiment repeated × 2. The aspects of the low-magnification micrographs outlined by the white boxes within the respective micrographs are shown at higher-magnification in the micrographs to the right, demonstrating the paucity of Ly-6G+ cells, but high degree of Ly-6C+ cells within the gal-1-deficient glioma microenvironment. Insets show examples of immunopositive cells whose nuclear morphology is consistent with Ly-6G+ polymorphonuclear cells (left panel) and Ly-6C+ monocytes (right panel). (E) Flow cytometric analysis of Gr-1int./CD11b+ (blue gate) and Gr-1+/CD11b+ myeloid cells (red gate) within the GL26-gal1i tumor microenvironment 6-d post-engraftment (left panel). Color-coded PBMC populations are further stratified based on Ly-6C expression in the histograms to the right, demonstrating that the Gr-1int./CD11b+ population is Ly-6C while the Gr-1+/CD11b+ cells are Ly-6C+. Isotype control is shown (white histogram); experiment repeated × 2. (F) Flow cytometric analysis for CD11c (left) and F4/80 in FACS-purified Gr-1+/CD11b+ monocytic myeloid cells after 20-h of in vitro co-culture with GL26-NT or GL26-gal1i cells. The geometric mean of each color-coded histogram (bottom panels) is plotted as a bar graph above the respective histogram plots. The schematic between the two bar graphs shows the known fates of circulating monocytes toward either conventional myeloid dendritic cells (i.e., mDCs) or macrophages (MΦ) in response to different microenvironmental queues, experiment repeated × 2.
Figure 6.
Figure 6.
Summary models. (A) Schematic summary of innate immune-mediated gal-1-deficient GL26 glioma rejection. Step 1: gal-1-knockdown causes GL26 cells to increase production of the chemokines CXCL10/IP-10, CXCL12/SDF-1, and CCL5/RANTES. Step 2: gal-1-deficient GL26 cells are engrafted into the brain of RAG1−/− or C57BL/6 mice. Step 3: gal-1-deficient glioma cells produce proinflammatory factors in the brain. Step 4: circulating Gr-1+/CD11b+/Ly-6C+/CCR2+ monocytic myeloid cells are rapidly recruited to the brain tumor microenvironment. Step 5: once within the tumor microenvironment, these myeloid cells are influenced by tumor-derived proinflammatory factors, likely differentiating into conventional DCs. Step 6: circulating NK1.1+ NK cells then recruit to the brain tumor microenvironment. Step 7: NK cells lyse glioma cells leading to tumor eradication. (B) Myeloid-derived suppressor cells (MDSCs) versus myeloid-derived inflammatory cells (MDICs). Immunosuppressive malignant glioma generated through natural selective pressures influence the inherently plastic Gr-1+/CD11b+ myeloid precursor cell population to act as MDSCs with immunosuppressive or pro-tumor functionality. Gr-1 immunodepletion in these cancer systems is expected to extend survival (left panel). Experimental or therapeutic interventions that enhance the inflammatory state of the glioma microenvironment (i.e. tumor-derived gal-1 suppression) influence the same population of Gr-1+/CD11b+ myeloid precursor cells to act as MDICs with antitumor functionality. Gr-1 immunodepletion in these cancer systems is expected to reduce survival.

References

    1. Ostrom QT, Gittleman H, Liao P, Rouse C, Chen Y, Dowling J, Wolinsky Y, Kruchko C, Barnholtz-Sloan J. CBTRUS statistical report: primary brain and central nervous system tumors diagnosed in the United States in 2007–2011. Neuro Oncol 2014; 16 Suppl 4:iv1-63; PMID:25304271; http://dx.doi.org/10.1093/neuonc/nou223 - DOI - PMC - PubMed
    1. Waziri A. Glioblastoma-derived mechanisms of systemic immunosuppression. Neurosurg Clin N Am 2010; 21:31-42; PMID:19944964; http://dx.doi.org/10.1016/j.nec.2009.08.005 - DOI - PubMed
    1. Hegde M, Bielamowicz KJ, Ahmed N. Novel approaches and mechanisms of immunotherapy for glioblastoma. Discov Med 2014; 17:145-54; PMID:24641957 - PubMed
    1. Weller M. Immunotherapy for glioblastoma: a long and winding road. Neuro Oncol 2010; 12:319; PMID:20308309; http://dx.doi.org/10.1093/neuonc/noq027 - DOI - PMC - PubMed
    1. Ostrand-Rosenberg S, Sinha P. Myeloid-derived suppressor cells: linking inflammation and cancer. J Immunol 2009; 182:4499-506; PMID:19342621; http://dx.doi.org/10.4049/jimmunol.0802740 - DOI - PMC - PubMed

Publication types

LinkOut - more resources