

Genome-Wide Identification and Expression Analysis of Two-Component System Genes in Tomato
- PMID: 27472316
- PMCID: PMC5000602
- DOI: 10.3390/ijms17081204
Genome-Wide Identification and Expression Analysis of Two-Component System Genes in Tomato
Abstract
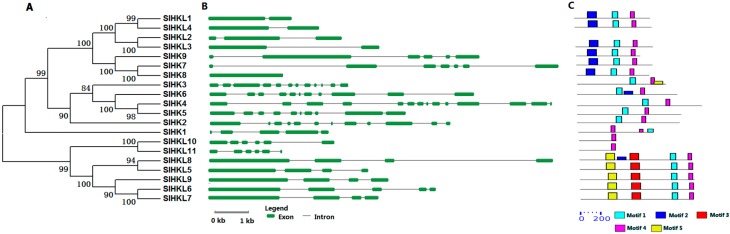
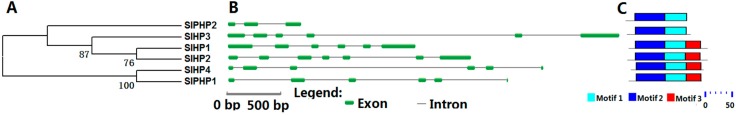
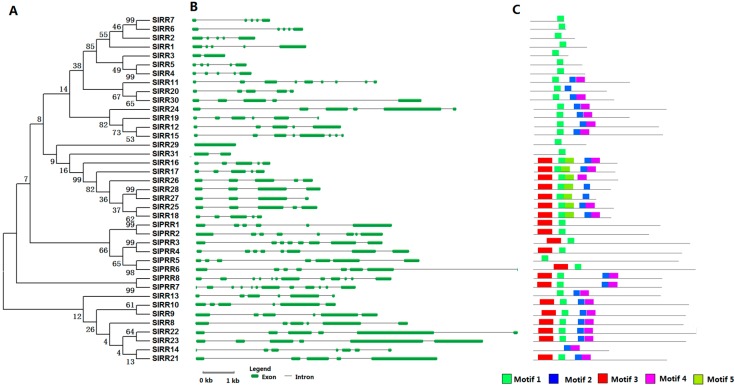
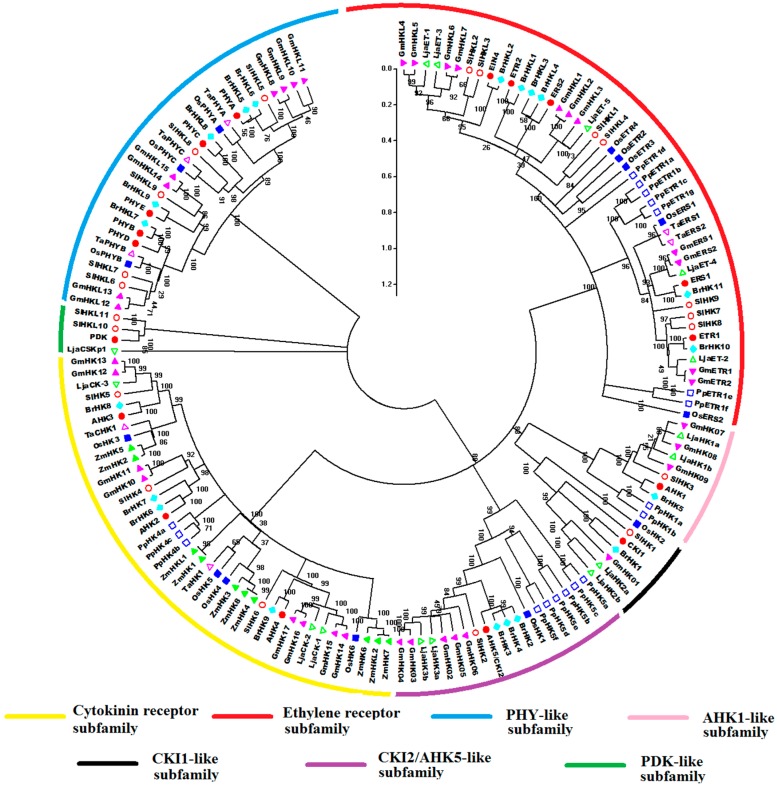
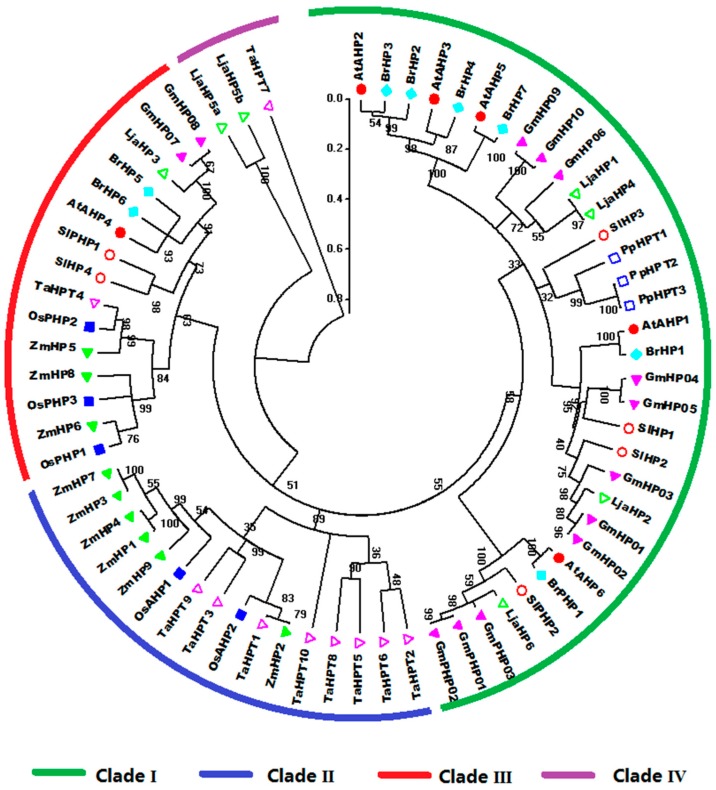
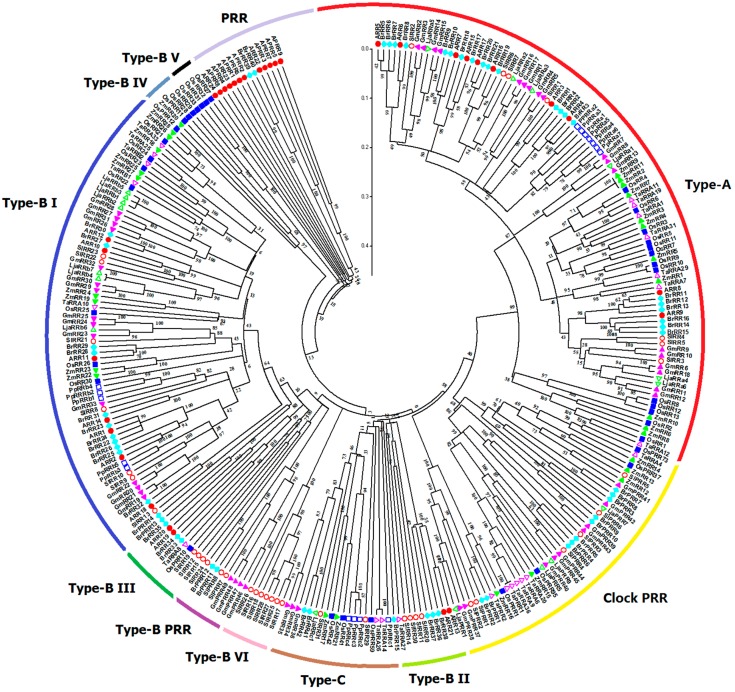
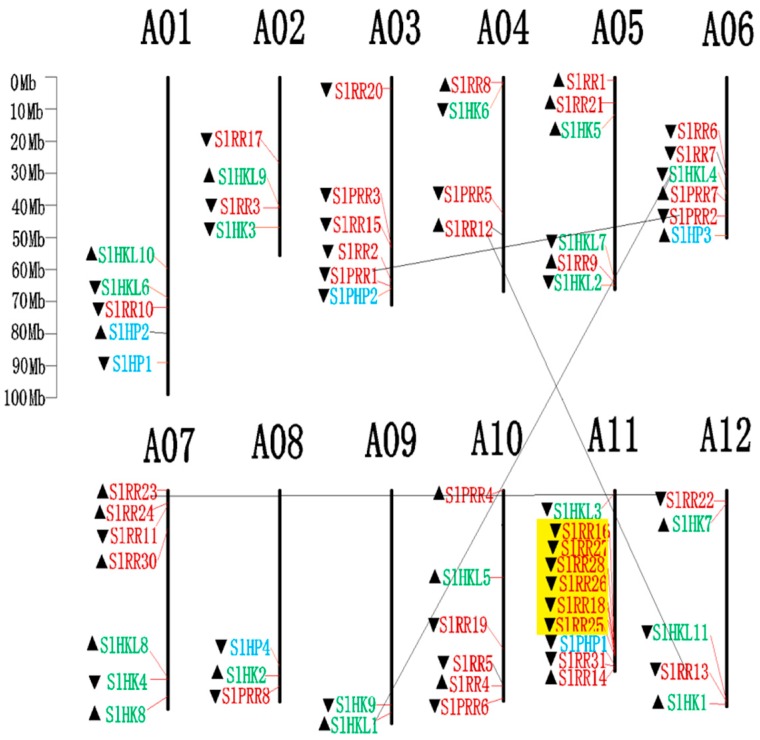
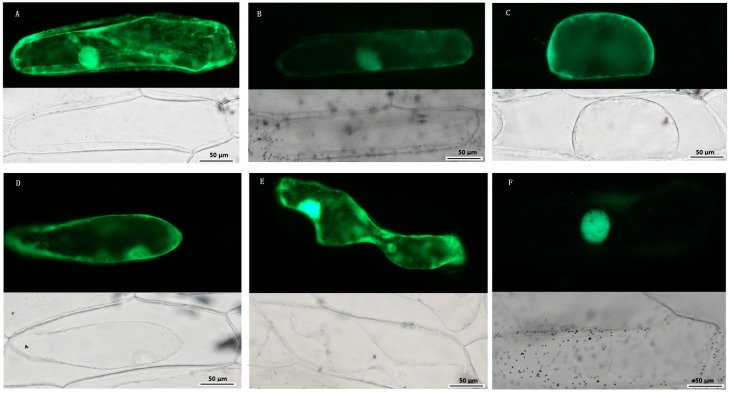
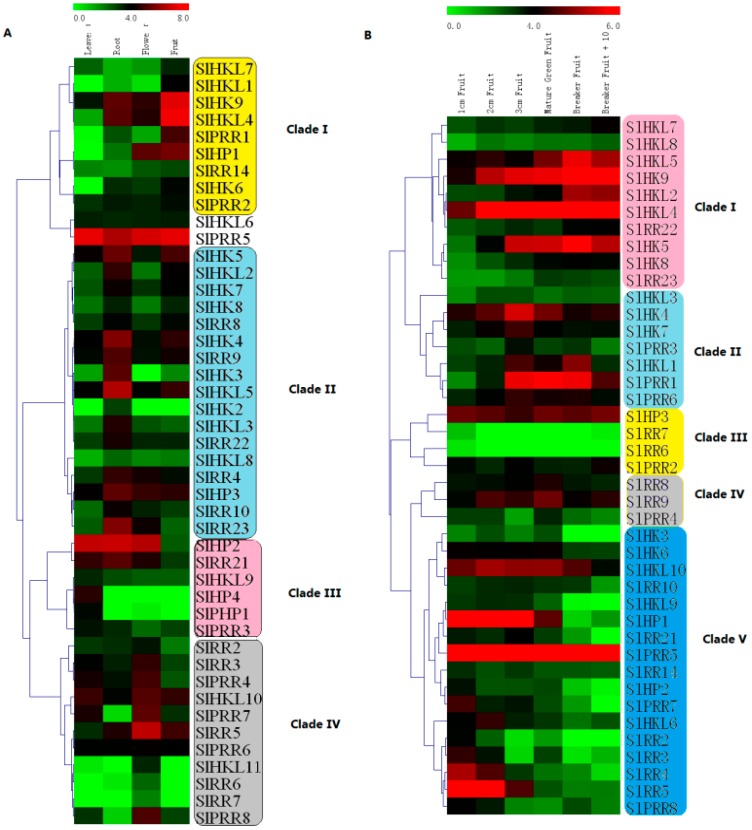
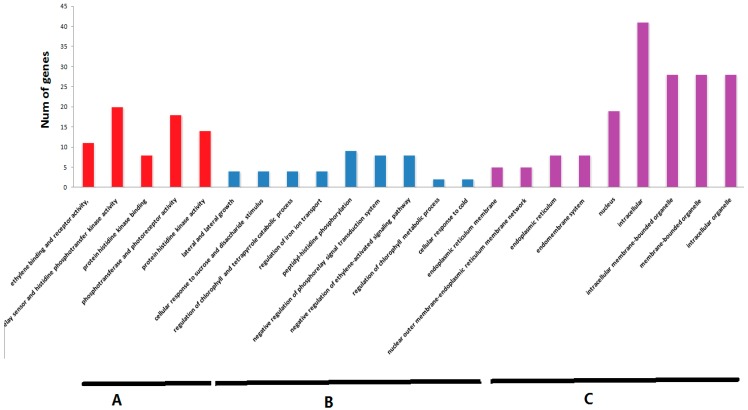
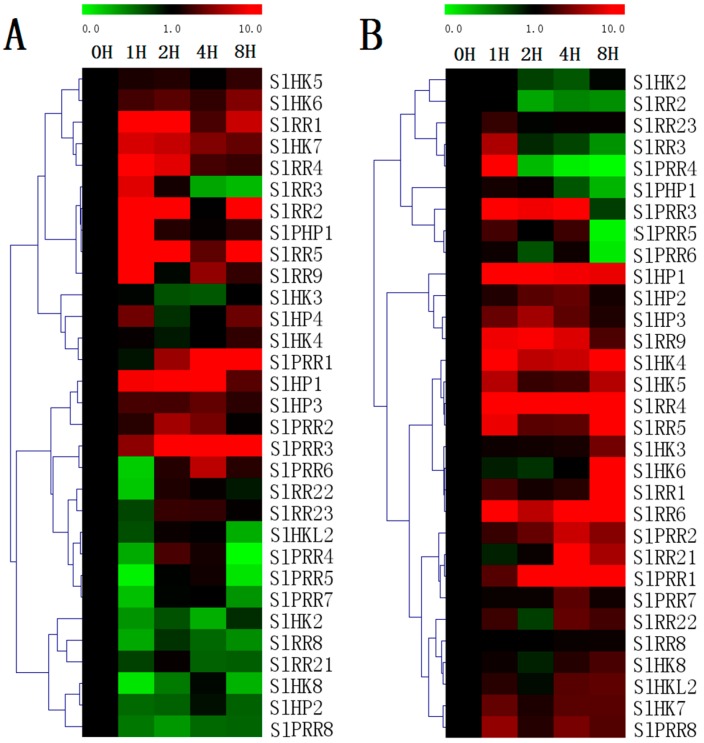
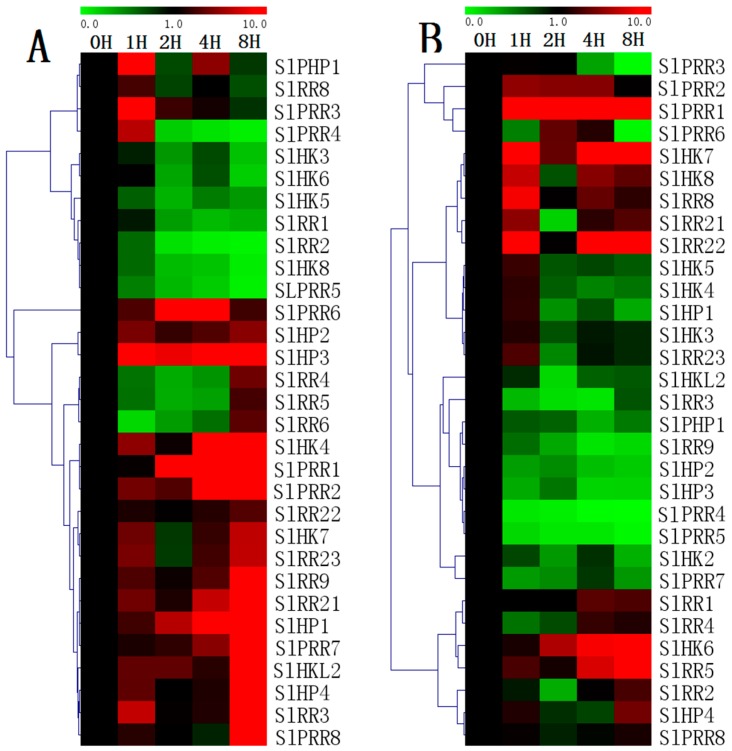
The two-component system (TCS), which comprises histidine kinases (HKs), phosphotransfers (HPs), and response regulator proteins (RRs), plays pivotal roles in regulating plant growth, development, and responses to biotic and abiotic stresses. TCS genes have been comprehensively identified and investigated in various crops but poorly characterized in tomato. In this work, a total of 65 TCS genes consisting of 20 HK(L)s, six HPs, and 39 RRs were identified from tomato genome. The classification, gene structures, conserved domains, chromosome distribution, phylogenetic relationship, gene duplication events, and subcellular localization of the TCS gene family were predicted and analyzed in detail. The amino acid sequences of tomato TCS family members, except those of type-B RRs, are highly conserved. The gene duplication events of the TCS family mainly occurred in the RR family. Furthermore, the expansion of RRs was attributed to both segment and tandem duplication. The subcellular localizations of the selected green fluorescent protein (GFP) fusion proteins exhibited a diverse subcellular targeting, thereby confirming their predicted divergent functionality. The majority of TCS family members showed distinct organ- or development-specific expression patterns. In addition, most of TCS genes were induced by abiotic stresses and exogenous phytohormones. The full elucidation of TCS elements will be helpful for comprehensive analysis of the molecular biology and physiological role of the TCS superfamily.
Keywords: evolution; expression profiles; phylogeny; tomato; two-component system.
Figures
Similar articles
-
Genome-wide identification and expression analysis of two-component system genes in switchgrass (Panicum virgatum L.).BMC Plant Biol. 2024 Oct 28;24(1):1014. doi: 10.1186/s12870-024-05687-0. BMC Plant Biol. 2024. PMID: 39465364 Free PMC article.
-
Genome-wide systematic characterization of the bZIP transcriptional factor family in tomato (Solanum lycopersicum L.).BMC Genomics. 2015 Oct 12;16:771. doi: 10.1186/s12864-015-1990-6. BMC Genomics. 2015. PMID: 26459863 Free PMC article.
-
The phosphoenolpyruvate carboxylase gene family identification and expression analysis under abiotic and phytohormone stresses in Solanum lycopersicum L.Gene. 2019 Mar 30;690:11-20. doi: 10.1016/j.gene.2018.12.033. Epub 2018 Dec 26. Gene. 2019. PMID: 30593913
-
Genome-wide identification, phylogeny, duplication, and expression analyses of two-component system genes in Chinese cabbage (Brassica rapa ssp. pekinensis).DNA Res. 2014 Aug;21(4):379-96. doi: 10.1093/dnares/dsu004. Epub 2014 Feb 27. DNA Res. 2014. PMID: 24585003 Free PMC article.
-
The shape of things to come: ovate family proteins regulate plant organ shape.Curr Opin Plant Biol. 2020 Feb;53:98-105. doi: 10.1016/j.pbi.2019.10.005. Epub 2019 Dec 11. Curr Opin Plant Biol. 2020. PMID: 31837627 Review.
Cited by
-
Genome-wide identification and expression analysis of two-component system genes in switchgrass (Panicum virgatum L.).BMC Plant Biol. 2024 Oct 28;24(1):1014. doi: 10.1186/s12870-024-05687-0. BMC Plant Biol. 2024. PMID: 39465364 Free PMC article.
-
Two-Component System Genes in Brassica napus: Identification, Analysis, and Expression Patterns in Response to Abiotic and Biotic Stresses.Int J Mol Sci. 2023 Dec 9;24(24):17308. doi: 10.3390/ijms242417308. Int J Mol Sci. 2023. PMID: 38139141 Free PMC article.
-
Characterization of Two-Component System gene (TCS) in melatonin-treated common bean under salt and drought stress.Physiol Mol Biol Plants. 2023 Nov;29(11):1733-1754. doi: 10.1007/s12298-023-01406-5. Epub 2023 Dec 23. Physiol Mol Biol Plants. 2023. PMID: 38162914 Free PMC article.
-
Comprehensive genomic survey, structural classification and expression analysis of C2H2 zinc finger protein gene family in Brassica rapa L.PLoS One. 2019 May 6;14(5):e0216071. doi: 10.1371/journal.pone.0216071. eCollection 2019. PLoS One. 2019. PMID: 31059545 Free PMC article.
-
Genome-wide identification and expression analysis of two-component system genes in sweet potato (Ipomoea batatas L.).Front Plant Sci. 2023 Jan 12;13:1091620. doi: 10.3389/fpls.2022.1091620. eCollection 2022. Front Plant Sci. 2023. PMID: 36714734 Free PMC article.
References
MeSH terms
Substances
LinkOut - more resources
Full Text Sources
Other Literature Sources
