. 2016 Jul 29:17:526.
doi: 10.1186/s12864-016-2880-2.

Evidence of selection for an accessible nucleosomal array in human

Affiliations

Evidence of selection for an accessible nucleosomal array in human

Guénola Drillon et al. BMC Genomics. .

Abstract

Background: Recently, a physical model of nucleosome formation based on sequence-dependent bending properties of the DNA double-helix has been used to reveal some enrichment of nucleosome-inhibiting energy barriers (NIEBs) nearby ubiquitous human "master" replication origins. Here we use this model to predict the existence of about 1.6 millions NIEBs over the 22 human autosomes.

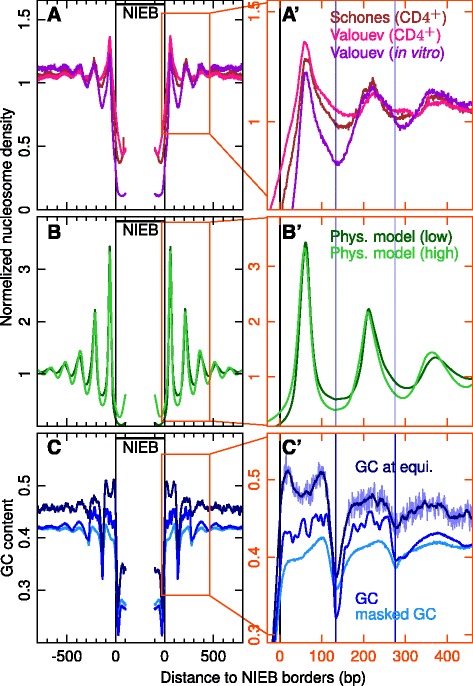
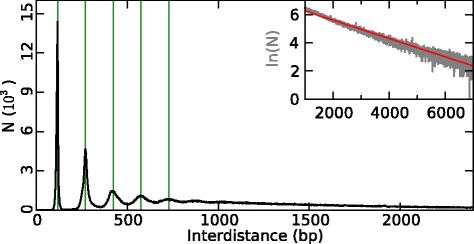
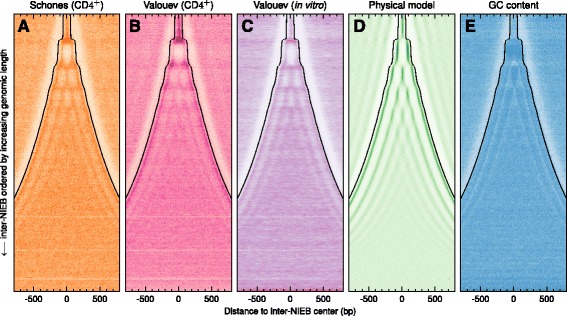
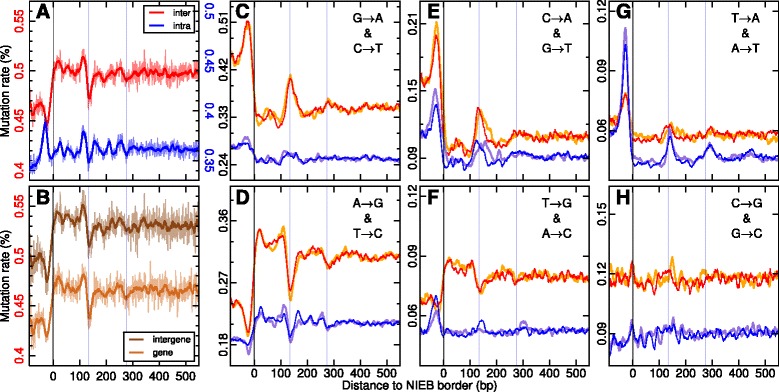
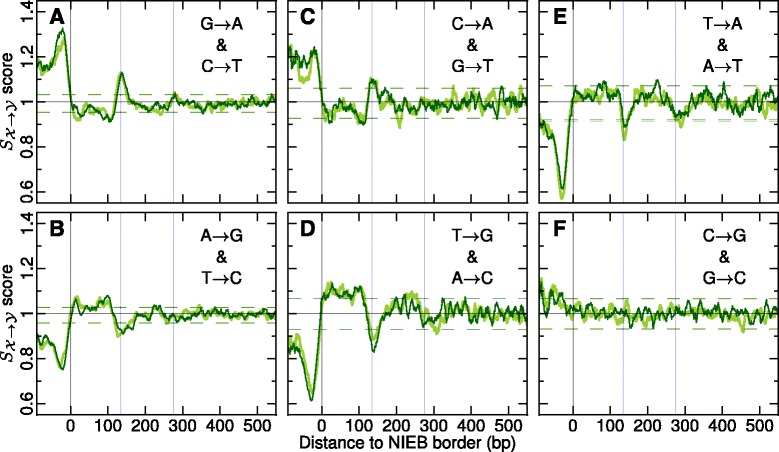
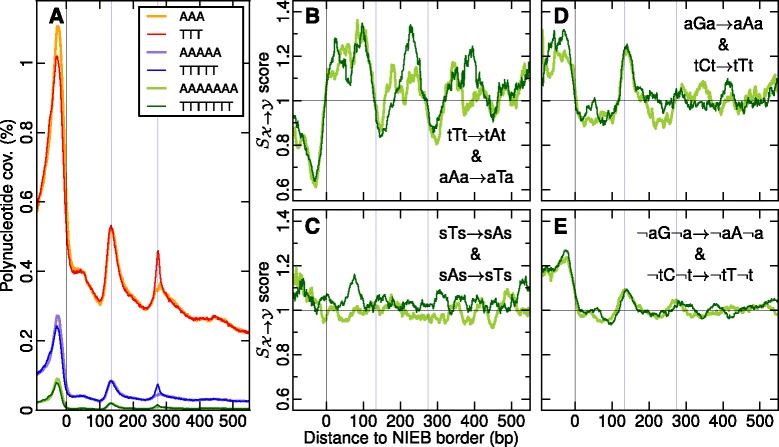
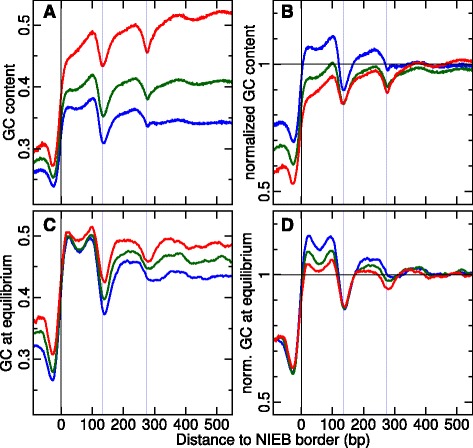
Results: We show that these high energy barriers of mean size 153 bp correspond to nucleosome-depleted regions (NDRs) in vitro, as expected, but also in vivo. On either side of these NIEBs, we observe, in vivo and in vitro, a similar compacted nucleosome ordering, suggesting an absence of chromatin remodeling. This nucleosomal ordering strongly correlates with oscillations of the GC content as well as with the interspecies and intraspecies mutation profiles along these regions. Comparison of these divergence rates reveals the existence of both positive and negative selections linked to nucleosome positioning around these intrinsic NDRs. Overall, these NIEBs and neighboring nucleosomes cover 37.5 % of the human genome where nucleosome occupancy is stably encoded in the DNA sequence. These 1 kb-sized regions of intrinsic nucleosome positioning are equally found in GC-rich and GC-poor isochores, in early and late replicating regions, in intergenic and genic regions but not at gene promoters.

Conclusion: The source of selection pressure on the NIEBs has yet to be resolved in future work. One possible scenario is that these widely distributed chromatin patterns have been selected in human to impair the condensation of the nucleosomal array into the 30 nm chromatin fiber, so as to facilitate the epigenetic regulation of nuclear functions in a cell-type-specific manner.

Keywords: GC content; Human genome; Mutation rates; Nucleosome depleted regions; Nucleosome ordering; Sequence evolution.


Figures

Fig. 1
Fig. 1
Normalized (with respect to genome average) mean nucleosome density on both sides of the 1,581,256 NIEBs predicted by the sequence-dependent physical model. a “Schones” in vivo (brown), “Valouev” in vivo (pink) and “Valouev” in vitro (purple) data (Methods). b Numerical mean profiles predicted by the physical model at low (dark green) and high (light green) genomic nucleosome coverages (Methods). c Mean GC content (blue), repeat-masked GC content (sky blue) and GC content at equilibrium (navy blue). a’,b’,c’ are zooms on the profiles in (a,b,c) on the right-hand side of the in silico NIEBs ; vertical blue lines correspond to local minima of the GC content (they will be reported in Figs. 4, 5, 6 and 7 for comparison). All profiles were computed at 1 bp resolution, except the ‘GC at equilibrium’ which was smoothed over 10 bp windows (its non-smoothed profile is shown as a background in (c’))
Fig. 2
Fig. 2
Histogram of (1,581,005) border to border inter-distances between successive NIEBs. The inset corresponds to a log-lin representation of the tail of this histogram, which puts into light a Poisson-like exponential behavior with a mean interdistance d¯=1,541 bp (red straight line). The green vertical lines mark interdistances d=117+153 k (bp), k=0,1,2,3 and 4
Fig. 3
Fig. 3
Heat map of nucleosome density and GC content in between NIEBs. The 1,581,005 inter-NIEB regions were centered at 0 and ordered vertically from the smallest (top) to the largest (bottom). a “Schones” in vivo data; (b) “Valouev” in vivo data; (c) “Valouev” in vitro data; (d) in silico nucleosome density computed at high nucleosome coverage (Methods); (e) GC content. Only the central part of inter-NIEB regions larger than 1.6 kb were shown to enlighten the absence of nucleosome positioning in these regions. Each horizontal line represents the mean nucleosome coverage over 200 inter-NIEB regions coded from white (0) to full color (1) (Methods)
Fig. 4
Fig. 4
Mean human lineage-specific inter- (red, orange, brown) and intraspecies (blue, purple) divergence rates inside (distance to NIEB border <0) and nearby (distance to NIEB border >0) the 1,581,256 NIEBs. a Overall divergence rates; rate of interspecies (resp. intraspecies) divergence is plotted on the left-hand (resp. right-hand) y-axis. b Interspecies divergence rate in gene (light brown) and intergene (dark brown) regions. c G → A (red, blue) and C → T (orange, purple) substitution rates. d A → G (red, blue) and T → C (orange, purple) substitution rates. e C → A (red, blue) and G → T (orange, purple) substitution rates. f T → G (red, blue) and A → C (orange, purple) substitution rates. g T → A (red, blue) and A → T (orange, purple) substitution rates. h C → G (red, blue) and G → C (orange, purple) substitution rates. The vertical blue lines have the same meaning as in Fig. 1 a’–c’. In (ch), the substitution rate on the right of the 3’ NIEB borders was averaged with its reverse complement on the left of the 5’ NIEB borders. Curves were smoothed over 10 bp windows. Non-smoothed curves are shown as a background in (a) and (b)
Fig. 5
Fig. 5
Evidence of selection in and around the 1,581,256 NIEBs. Ratios SXY of background corrected inter- and intraspecies divergence rates plotted against the position from the closest NIEB border (negative distances correspond to loci inside the NIEBs). The pannels correspond to the substitution rates: (a) G → A and C → T; (b) A → G and T → C; (c) C → A and G → T; (d) T → G and A → C; (e) T → A and A → T; (f) C → G and G → C. In each panel the first (resp. second) substitution is represented in dark green (resp. light green). Curves were smoothed over 10 bp windows. The vertical blue lines have the same meaning as in Fig. 1 a’–c’. The horizontal dark green (resp. light green) dashed lines, mark the 95 % confidence intervals for SXY ratios under the hypothesis of neutral evolution (Methods); the probability for SXY to be above (resp. below) these limits is 0.025
Fig. 6
Fig. 6
a Mean profile of (repeat-masked) polynucleotide coverage in and around the 1,581,256 NIEBs: AAA (orange), TTT (red), AAAAA (purple), TTTTT (blue), AAAAAAA (light green), TTTTTTT (dark green). Ratios SXY of background corrected inter- and intraspecies context-dependent divergence rates plotted against the position from the closest NIEB border. The pannels correspond to the substitution rates: (b) tTt → tAt and aAa → aTa; (c) sTs → sAs and sAs → sTs, where s =(c,g); (d) aGa → aAa and tCt → tTt; (e) ¬aG¬a →¬aA¬a and ¬tC¬t →¬tT¬t, where ¬a=(c,t,g) and ¬t=(a,c,g). In each panel the first (resp. second) substitution is represented in dark green (resp. light green). In (b, c, d, e) curves were smoothed over 30 bp windows. The vertical blue lines have the same meaning as in Fig. 1 a’–c’
Fig. 7
Fig. 7
a Repeat-masked GC content in and around the predicted NIEBs bordering the 945,219 largest (d>0.8 kb) inter-NIEB regions. These barriers were classified according to the repeat-masked GC content computed in the central part of these large inter-NIEB regions: GC <0.38 (blue), 0.38≤ GC <0.46 (green) and 0.46≤ GC (red). b Repeat-masked GC content normalized by its local repeat-masked reference value. c Same as (a) for GC content at equilibrium. d Equilibrium GC content normalized by its local equilibrium reference value. In (c, d) curves were smoothed over 30 bp windows. The vertical blue lines have the same meaning as in Fig. 1 a’–c’

Similar articles

Cited by

References

    1. Arneodo A, Vaillant C, Audit B, Argoul F, d’Aubenton-Carafa Y, Thermes C. Multi-scale coding of genomic information: From DNA sequence to genome structure and function. Phys Rep. 2011;498:45–188. doi: 10.1016/j.physrep.2010.10.001. - DOI
    1. Parker SCJ, Tullius TD. DNA shape, genetic codes, and evolution. Curr Opin Struct Biol. 2011;21(3):342–7. doi: 10.1016/j.sbi.2011.03.002. - DOI - PMC - PubMed
    1. Alberts B, Bray D, Lewis J, Raff M, Roberts K, Watson JD. Molecular Biology of the Cell. New-York: Garland Publishing; 2002.
    1. Graur D, Li WH. Fundamentals of Molecular Evolution. Sunderland: Sinauer Associates; 1999.
    1. Stamatoyannopoulos JA, Adzhubei I, Thurman RE, Kryukov GV, Mirkin SM, Sunyaev SR. Human mutation rate associated with DNA replication timing. Nat Genet. 2009;41(4):393–5. doi: 10.1038/ng.363. - DOI - PMC - PubMed

Publication types

LinkOut - more resources