. 2016 Jul 29;18(1):78.
doi: 10.1186/s13058-016-0737-x.

Quantitative assessment of the spatial heterogeneity of tumor-infiltrating lymphocytes in breast cancer

Affiliations

Quantitative assessment of the spatial heterogeneity of tumor-infiltrating lymphocytes in breast cancer

Nikita L Mani et al. Breast Cancer Res. .

Abstract

Background: Tumor-infiltrating lymphocyte (TIL) count in breast cancer carries prognostic information and represents a potential predictive marker for emerging immunotherapies. However, the distribution of the lymphocyte subpopulations is not well defined. The goals of this study were to examine intratumor heterogeneity in TIL subpopulation counts in different fields of view (FOV) within each section, in different sections from the same biopsy, and between biopsies from different regions of the same cancer using quantitative immunofluorescence (QIF).

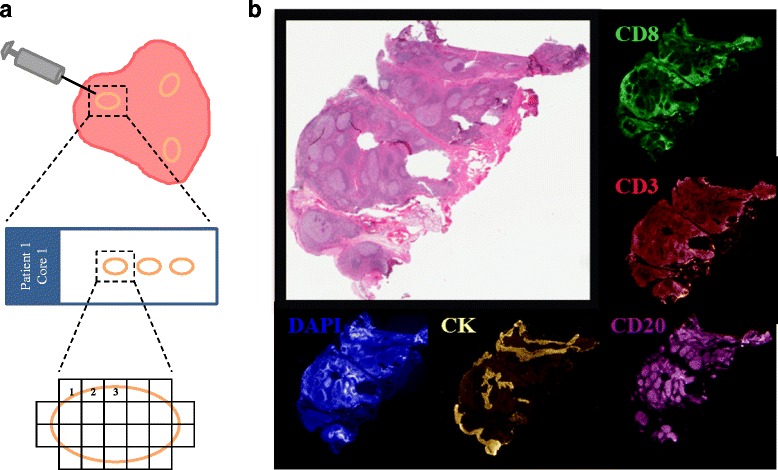
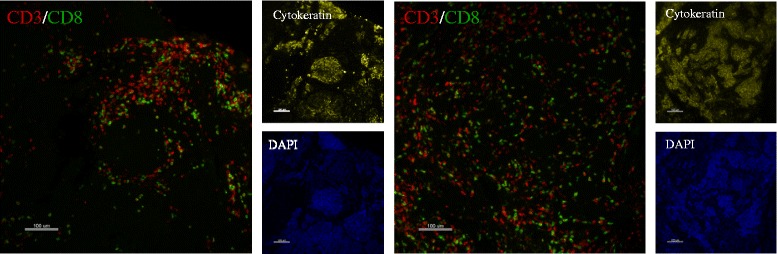
Methods: We used multiplexed QIF to quantify cytokeratin-positive epithelial cells, and CD3-positive, CD8-positive and CD20-positive lymphocytes in tissue sections from multiple biopsies obtained from different areas of 31 surgically resected primary breast carcinomas (93 samples total). Log2-transformed QIF scores or concordance and variance component analyses with linear mixed-effects models were used. Cohen's kappa index [k] of high versus low scores, defined as above and below the median, was used to measure sample similarity between areas.

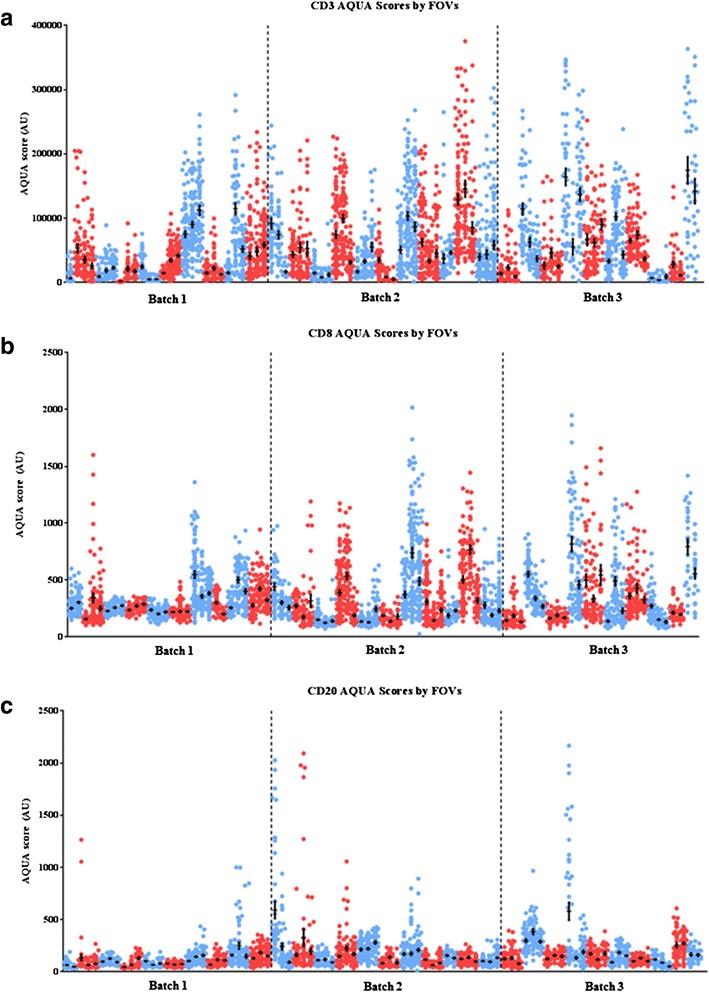
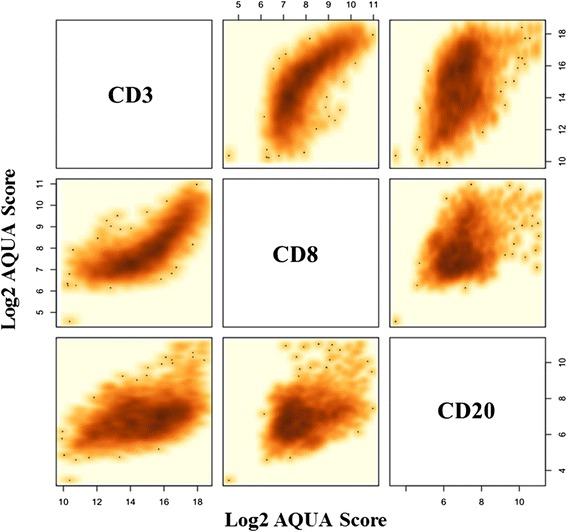
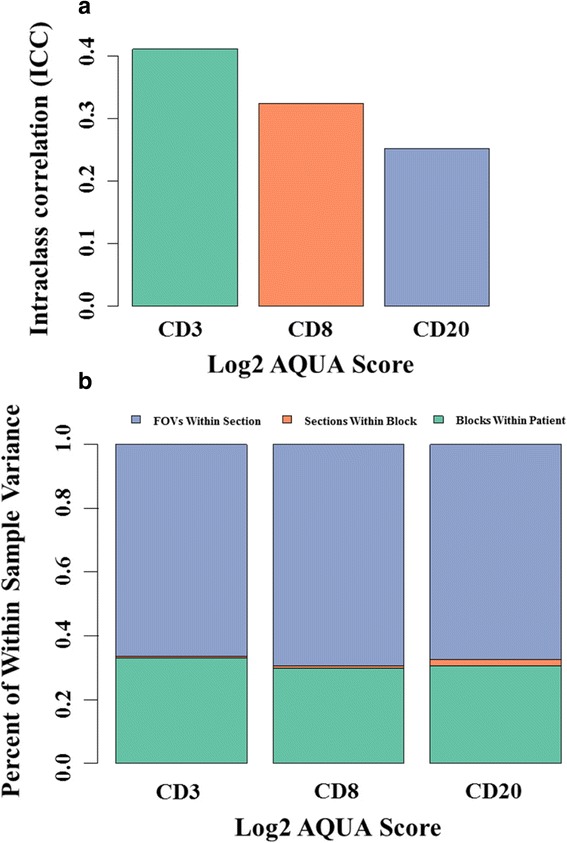
Results: We found a strong positive correlation between CD3 and CD8 levels across all patients (Pearson correlation coefficient [CC] = 0.827). CD3 and CD8 showed a weaker but significant association with CD20 (CC = 0.446 and 0.363, respectively). For each marker, the variation between different FOVs in the same section was higher than the variation between sections or between biopsies of the same cancer. The intraclass correlation coefficients (ICC) were 0.411 for CD3, 0.324 for CD8, and 0.252 for CD20. In component analysis, 66-69 % of the variance was attributable to differences between FOVs in the same section and 30-33 % was due to differences between biopsies from different areas of the same cancer. Section to section differences were negligible. Concordance for low versus high marker status assignment in single biopsies compared to all three biopsies combined yielded k = 0.705 for CD3, k = 0.655 for CD8, and k = 0.603 for CD20.

Conclusions: T and B lymphocytes show more heterogeneity across the dimensions of a single section than between different sections or regions of a given breast tumor. This observation suggests that the average lymphocyte score from a single biopsy of a tumor is reasonably representative of the whole cancer.

Keywords: B cells; Breast cancer; Immunofluorescence; Stroma; T cells; Tumor microenvironment.


Figures

Fig. 1
Fig. 1
Average AQUA® scores for tonsil whole tissue control samples. a Whole tissue serial sections of core biopsies from different regions of the same cancer were prepared and multiple fields of view (FOV) were assessed in each section. b Hematoxylin staining of tumor-infiltrating lymphocytes (TILs) compared to CD3, CD8, CD20, cytokeratin, and DAPI staining under fluorescence microscopy from a multiplexed tonsil control slide
Fig. 2
Fig. 2
Distribution of AQUA® QIF scores of CD3 (T cells, a), CD8 (cytotoxic T cells, b), and CD20 (B lymphocytes, c) markers across three cores from 31 individual breast tumors. The 33 patient cases were randomly distributed into three staining batches completed on consecutive days where all three biopsies per tumor were stained within the same batch. The three core biopsy sets from each tumor are grouped together sequentially and are represented by the same color. Each tumor (three biopsy set) is color-coded with alternating red and blue dots for visual clarity between patients. Each dot represents a QIF score from a single field of view (FOV) from each biopsy. QIF scores are expressed as arbitrary units of fluorescence (AU) using the AQUA® algorithm. The mean score and standard error of the mean (SEM) for each core are indicated with a black dot/bar, respectively
Fig. 3
Fig. 3
Representative immunofluorescence images of CD3 and CD8 in one patient. FOVs were compared between different core biopsies of the same patient. Spatial distribution of CD3+ and CD8+ T cells shows both random distribution of T cells among the various margins between and around epithelial cells and also aggregations of T cells into clusters near tumors
Fig. 4
Fig. 4
Correlation between TIL markers in breast cancer. AQUA® scores for the three markers (CD3, CD8, CD20) were log2 transformed and compared to each other on a FOV basis. Positive correlation exists between all three markers. The strongest correlation was between CD3 and CD8 (Pearson correlation coefficient [CC] = 0.827). The correlation between CD3 and CD20 was 0.446 and between CD8 and CD20 it was 0.363
Fig. 5
Fig. 5
Variance of TILs scores in breast cancer. a The variance for each marker within cores of the same tumor are expressed as intraclass correlation coefficients (ICC). ICC was of 0.411 for CD3, 0.324 for CD8, and 0.252 for CD20. b The analysis included the marker change between FOVs in the same tumor section (blue), between serial sections of the same core (orange) and between cores of the same tumor (green). Variance components of TILs scores from the same cancer indicate that 66–69 % of the variance is attributable to signal differences between fields of view of the same section, 30–33 % is due to differences between biopsies from different areas of the cancer and <2 % is due to differences between serial cuts from the same biopsy

References

    1. Salgado R, Denkert C, Campbell C, Savas P, Nucifero P, Aura C, de Azambuja E, Eidtmann H, Ellis CE, Baselga J, et al. Tumor-infiltrating lymphocytes and associations with pathological complete response and event-free survival in HER2-positive early-stage breast cancer treated with lapatinib and trastuzumab: a secondary analysis of the NeoALTTO Trial. JAMA Oncol. 2015;1(4):448–54. doi: 10.1001/jamaoncol.2015.0830. - DOI - PMC - PubMed
    1. Dieci MV, Mathieu MC, Guarneri V, Conte P, Delaloge S, Andre F, Goubar A. Prognostic and predictive value of tumor-infiltrating lymphocytes in two phase III randomized adjuvant breast cancer trials. Ann Oncol. 2015;26(8):1698–704. doi: 10.1093/annonc/mdv239. - DOI - PMC - PubMed
    1. Schalper KA, Brown J, Carvajal-Hausdorf D, McLaughlin J, Velcheti V, Syrigos KN, Herbst RS, Rimm DL. Objective measurement and clinical significance of TILs in non-small cell lung cancer. J Natl Cancer Inst. 2015;107(3):9. - PMC - PubMed
    1. Liu S, Lachapelle J, Leung S, Gao D, Foulkes WD, Nielsen TO. CD8+ lymphocyte infiltration is an independent favorable prognostic indicator in basal-like breast cancer. Breast Cancer Res. 2012;14(2):R48. doi: 10.1186/bcr3148. - DOI - PMC - PubMed
    1. Tumeh PC, Harview CL, Yearley JH, Shintaku IP, Taylor EJ, Robert L, Chmielowski B, Spasic M, Henry G, Ciobanu V, et al. PD-1 blockade induces responses by inhibiting adaptive immune resistance. Nature. 2014;515(7528):568–71. doi: 10.1038/nature13954. - DOI - PMC - PubMed

Publication types

MeSH terms