. 2016 Oct;22(10):1522-34.
doi: 10.1261/rna.057216.116. Epub 2016 Jul 29.

Identification of new branch points and unconventional introns in Saccharomyces cerevisiae

Affiliations

Identification of new branch points and unconventional introns in Saccharomyces cerevisiae

Genevieve M Gould et al. RNA. 2016 Oct.

Abstract

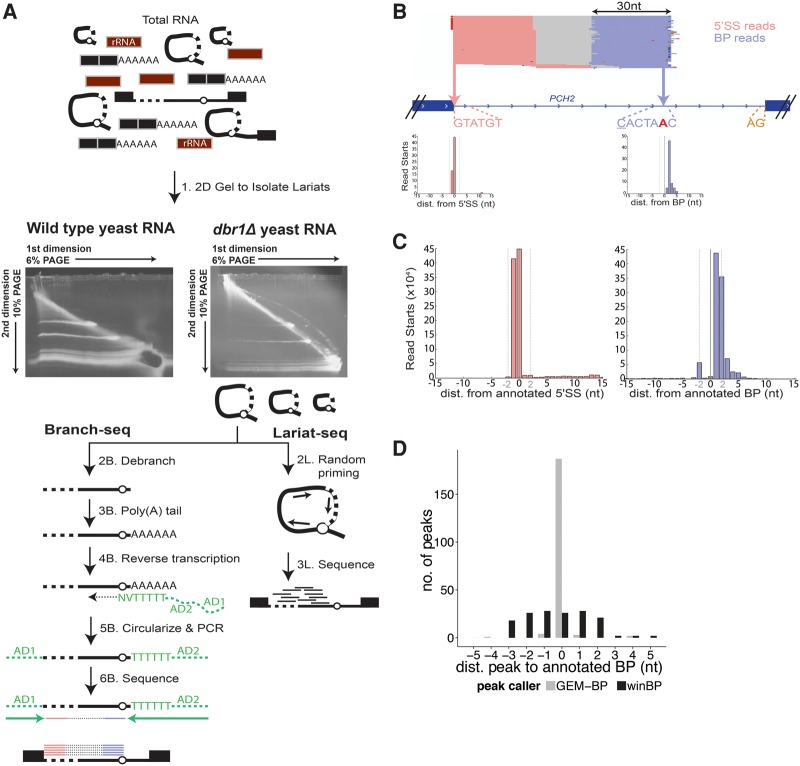
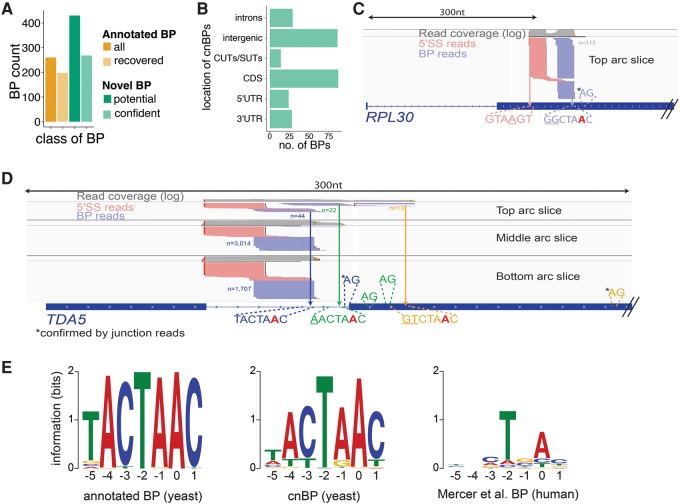
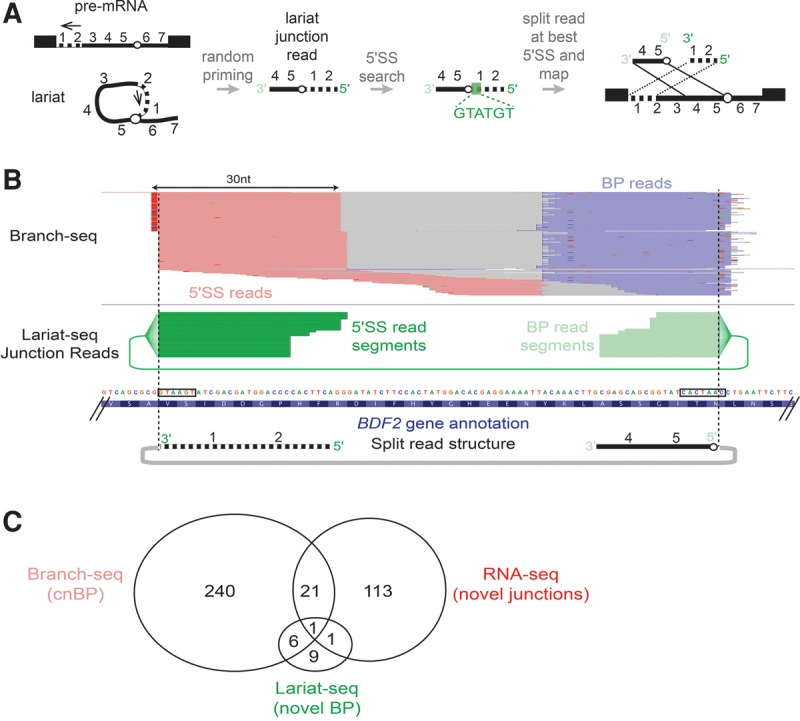
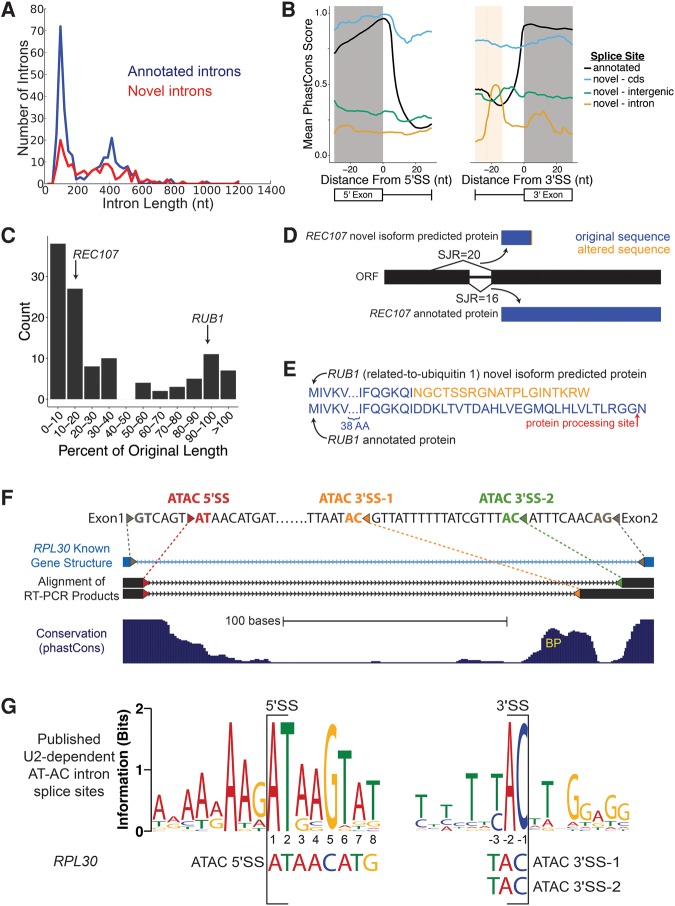
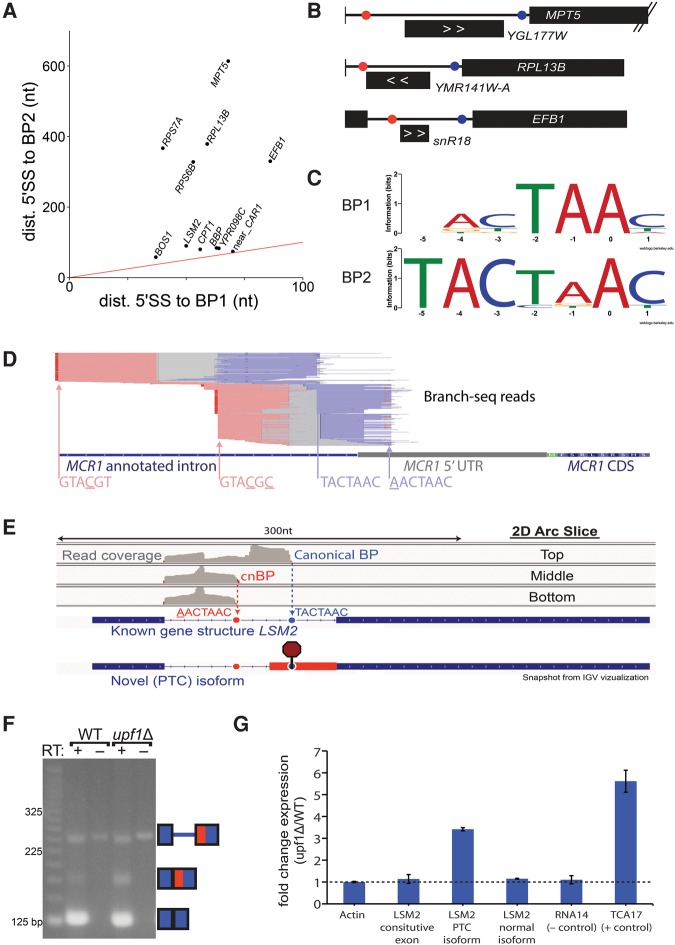
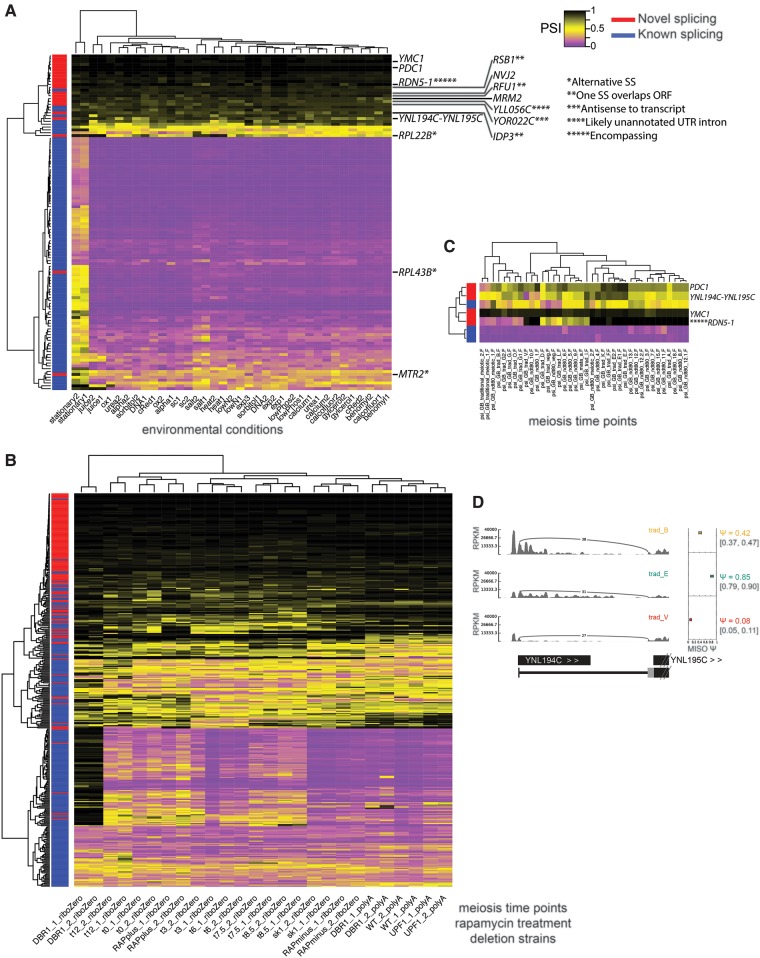
Spliced messages constitute one-fourth of expressed mRNAs in the yeast Saccharomyces cerevisiae, and most mRNAs in metazoans. Splicing requires 5' splice site (5'SS), branch point (BP), and 3' splice site (3'SS) elements, but the role of the BP in splicing control is poorly understood because BP identification remains difficult. We developed a high-throughput method, Branch-seq, to map BPs and 5'SSs of isolated RNA lariats. Applied to S. cerevisiae, Branch-seq detected 76% of expressed, annotated BPs and identified a comparable number of novel BPs. We performed RNA-seq to confirm associated 3'SS locations, identifying some 200 novel splice junctions, including an AT-AC intron. We show that several yeast introns use two or even three different BPs, with effects on 3'SS choice, protein coding potential, or RNA stability, and identify novel introns whose splicing changes during meiosis or in response to stress. Together, these findings show unanticipated complexity of splicing in yeast.

Keywords: branch point sequence; pre-mRNA splicing; stress response.


Figures

FIGURE 1.
FIGURE 1.
Branch-seq accurately identifies BP locations on a genome-wide scale. (A) Schematic of the Branch-seq protocol. Steps labeled with “B” and “L” correspond to Branch-seq and Lariat-seq, respectively. (B) Branch-seq locates the annotated 5′SS (pink) and BP (blue) in the PCH2 intron (Sureau 2001; Wollerton et al. 2004; Robinson et al. 2011). Dashed lines show locations of 5′SS (GTATGT), BP (CACTAAC), and 3′SS (AG) sequences. Mismatches from consensus are underlined. BP nucleotide is red and bold. Mismatches in reads are indicated by small red, green, dark blue, and orange horizontal lines. Inset axes show read start locations for PCH2 intron 5′SS and BP reads where the 0 nt is the 5′SS or BP nucleotide, respectively. (C) Meta 5′SS and BP read start plots as in B but for all annotated 5′SS and BPs. Dotted vertical lines at ±2 nt. (D) Locations of BP peaks called by winBP and GEM-BP relative to annotated BP positions.
FIGURE 2.
FIGURE 2.
Branch-seq locates hundreds of novel BPs. (A) Number of annotated BPs recovered by Branch-seq (light orange) compared to number of computationally predicted BPs (dark orange) (Meyer et al. 2011). The cnBPs (light green) are a subset of all novel BPs (dark green). (B) Genomic locations of the 268 cnBPs. Novel BPs located in CDS (C,D), introns (D), and of the TDA5 and RPL30 genes. Annotated TDA5 BP and 5′SS are blue. Potential AG 3′SS are depicted. 3′SS confirmed by entropy are indicated by asterisk (C,D). Potential BP-3′SS pairing indicated by matching colors (D). (E) Sequence motifs created by MEME of annotated BPs (left) and typical 5′SS cnBP (middle) recovered by Branch-seq and human BP motif (right) for comparison. Position 0 is the BP nucleotide.
FIGURE 3.
FIGURE 3.
Lariat-set junction reads identify BP locations. (A) Schematic of lariat junction read mapping strategy. Green box indicates location of best 5′SS in lariat junction read. (B) Novel intron in BDF2 CDS is supported by Branch-seq reads (top, pink and blue as in Fig. 1) and Lariat-seq junction reads (middle, 5′SS read fragments in dark green, BP read fragments in light green). Black boxes denote novel 5′SS and BP sequences identified by Branch-seq and Lariat-seq reads. (C) Summary of overlaps among novel BPs identified by Lariat-seq JR reads, cnBP identified by Branch-seq, and novel splice junctions identified by RNA-seq.
FIGURE 4.
FIGURE 4.
RNA-seq discovers additional novel introns. (A) Length distribution of annotated (blue) and novel (red) splice junctions. Novel splice junctions include any junction with entropy ≥2 bits. (B) Conservation of splice sites for annotated splice sites (black) and novel splice sites located in annotated CDS (blue), introns (yellow), and outside of ORFs (green). Average predicted BP location for intronic 3′SS is denoted with dotted line, shading is ±1 SD (only plotting −30 to +30 nt around the splice site). For 5′SS, annotated n = 282, CDS n = 14, intron n = 19, intergenic n = 18. For 3′SS, annotated n = 282, CDS n = 34, intron n = 7, intergenic n = 18. (C) Effect on coding length of ORFs from splicing out of novel introns. Predicted change to the coding sequence of REC107 (D) and RUB1 (E) after splicing out novel introns. Red arrow indicates location of RUB1 protein cleavage prior to its addition to substrates. (F) RT-PCR sequence (black) aligns to annotated intron of RPL30 (light blue), SacCer3 genome assembly (Kent 2002). Colored triangles represent splice sites. Gray, annotated splice sites; red, AT-AC 5′SS; orange, AT-AC 3′SS 1; green, AT-AC 3′SS 2. Depending on which AC/ 3′SS is used, the second AUG is either 104 nt or 170 nt downstream from the truncated main ORF. (G) WebLogo of published U2-dependent AT-AC intron 5′SS and 3′SS. RPL30 AT-AC splice sites shown below (Sheth et al. 2006).
FIGURE 5.
FIGURE 5.
Alternative BP usage reveals previously unknown nonsense-mediated mRNA decay splice isoform. (A) Distance from 5′SS to BP for first and second BPs in introns that use two BPs. (Red line) x = y. Two BPs in BBP (MSL5) were also reported by Qin et al. (2016) (B) Three genes from A where novel BP (red) is located close to the 5′SS and far from the annotated BP (blue). Intronic transcript position shown below each intron; direction indicated with white arrows. (C) Motif of upstream BP (top) and downstream BP (bottom) for 11 introns that use two BPs. (D) Branch-seq reads support a novel 5′SS-BP shifted pair in the MCR1 intron with an “atypical” 5′SS motif. (E) Branch-seq read coverage from the top, middle, and bottom sections of the 2D gel arc (Supplemental Fig. S1A) correspond to usage of the canonical LSM2 BP (blue dotted line and circle) and a “new” BP (red dotted line and circle). Potential alternative 3′SS usage would insert a premature termination codon (octagon stop sign). (F) RT-PCR and subsequent sequencing confirmed the novel LSM2 PTC isoform. (G) qPCR verification that LSM2 PTC isoform is up-regulated in upf1 null yeast.
FIGURE 6.
FIGURE 6.
Rare splicing of novel retained introns mirrors splicing patterns of known introns. (A) Clustering of PSI values calculated by MISO for retained introns in RNA-seq data from 18 environmental conditions (Waern and Snyder 2013), including 136 novel introns. PSI ranges from 0 (complete splicing, purple) to 1 (complete retention, black). (*) Alternative splice site. (**) One splice site overlaps gene ORF listed. (***) Antisense to an annotated transcript. (****) Intron likely in unannotated UTR. (*****) Intron encompasses gene. (YLL056C) 5′UTR supported by RNA-seq. (IDP3) 5′SS inside ORF. (RFU1 and RSB1) 3′SS inside ORF. Conditions are listed in Supplemental Methods. (B) Clustering of PSI of retained introns and alternative splice sites from RNA-seq of a meiosis time course, rapamycin treatment, and deletion strains, including additional novel introns. (C) Clustering of retained intron PSI from ribosome footprint profiling data from a meiosis time course (Brar et al. 2012). (D) Sashimi plot (Katz et al. 2010) depiction of ribosome footprint profiling splice junction reads from B joining YNL194 and YNL195 transcripts at a few stages of meiosis.

References

    1. Aebi M, Hornig H, Padgett RA, Reiser J, Weissmann C. 1986. Sequence requirements for splicing of higher eukaryotic nuclear pre-mRNA. Cell 47: 555–565. - PubMed
    1. Awan AR, Manfredo A, Pleiss JA. 2013. Lariat sequencing in a unicellular yeast identifies regulated alternative splicing of exons that are evolutionarily conserved with humans. Proc Natl Acad Sci 110: 12762–12767. - PMC - PubMed
    1. Beggs JD. 2005. Lsm proteins and RNA processing. Biochem Soc Trans 33: 433–438. - PubMed
    1. Berchowitz LE, Gajadhar AS, van Werven FJ, De Rosa AA, Samoylova ML, Brar GA, Xu Y, Xiao C, Futcher B, Weissman JS, et al. 2013. A developmentally regulated translational control pathway establishes the meiotic chromosome segregation pattern. Genes Dev 27: 2147–2163. - PMC - PubMed
    1. Bitton DA, Rallis C, Jeffares DC, Smith GC, Chen YYC, Codlin S, Marguerat S, Bahler J. 2014. LaSSO, a strategy for genome-wide mapping of intronic lariats and branch points using RNA-seq. Genome Res 24: 1169–1179. - PMC - PubMed

Substances