. 2016 Oct 1;1648(Pt A):181-192.
doi: 10.1016/j.brainres.2016.07.035. Epub 2016 Jul 26.

Lipopolysaccharide (LPS) and tumor necrosis factor alpha (TNFα) blunt the response of Neuropeptide Y/Agouti-related peptide (NPY/AgRP) glucose inhibited (GI) neurons to decreased glucose

Affiliations

Lipopolysaccharide (LPS) and tumor necrosis factor alpha (TNFα) blunt the response of Neuropeptide Y/Agouti-related peptide (NPY/AgRP) glucose inhibited (GI) neurons to decreased glucose

Lihong Hao et al. Brain Res. .

Abstract

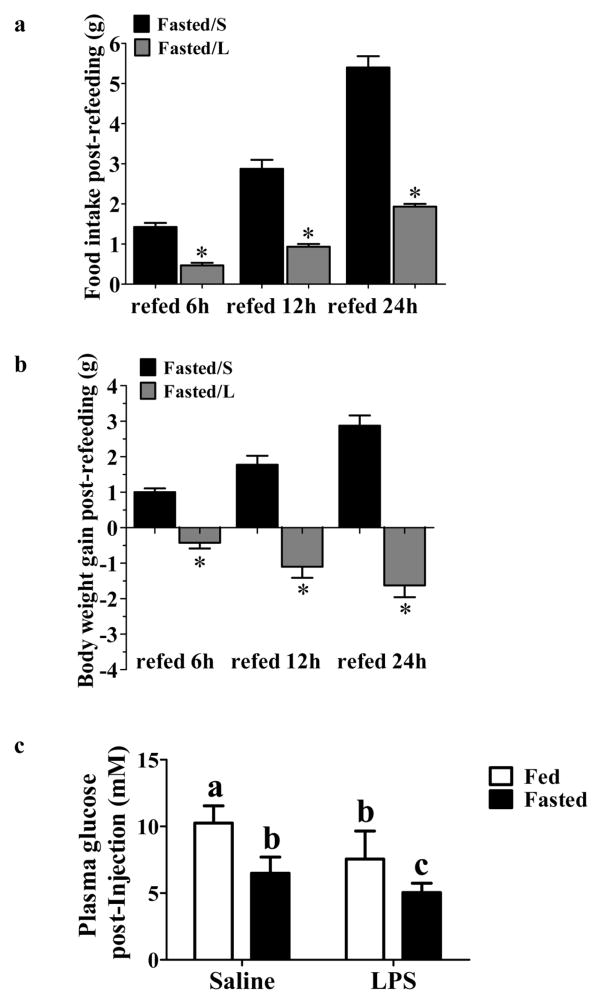
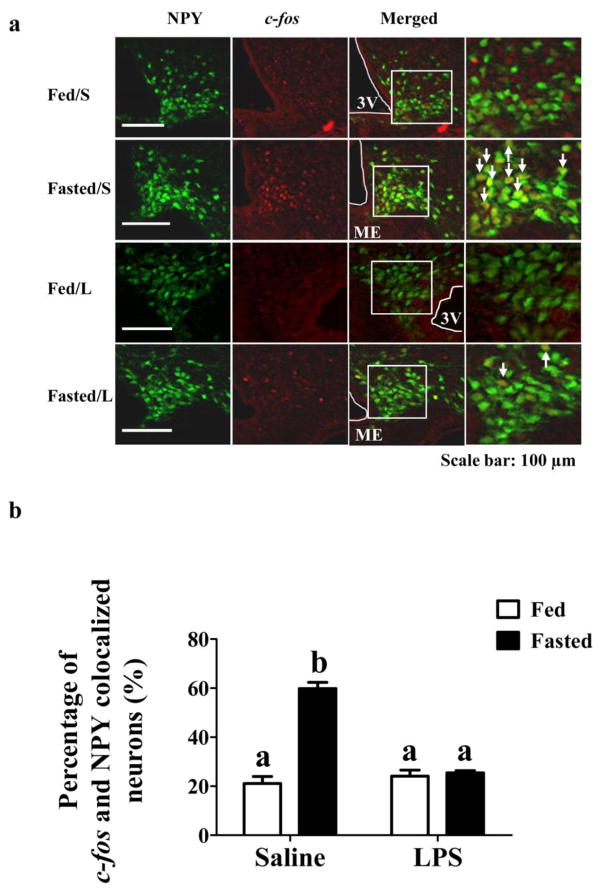
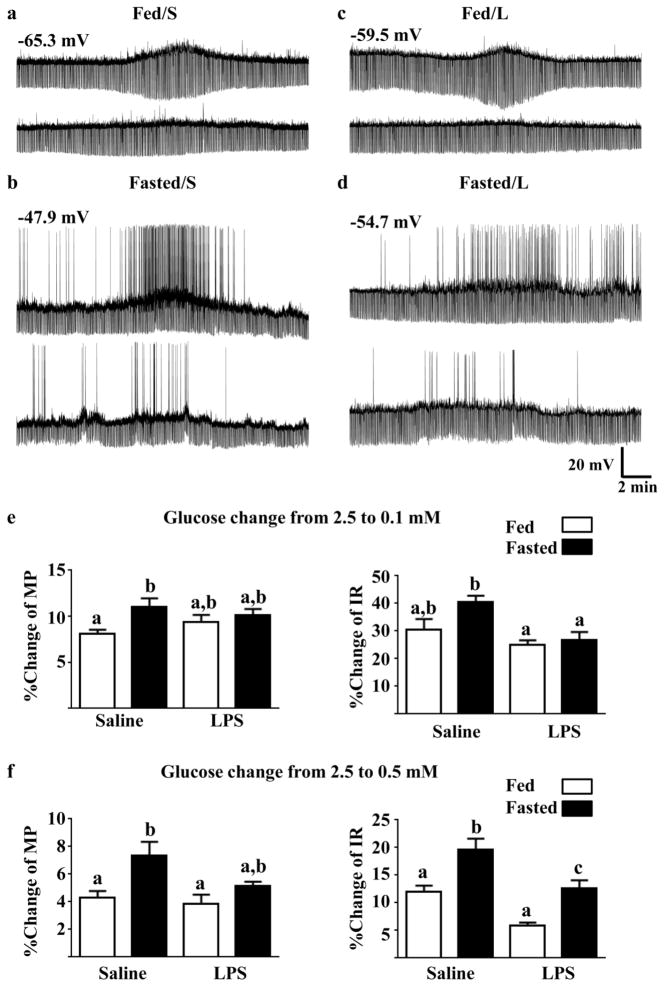
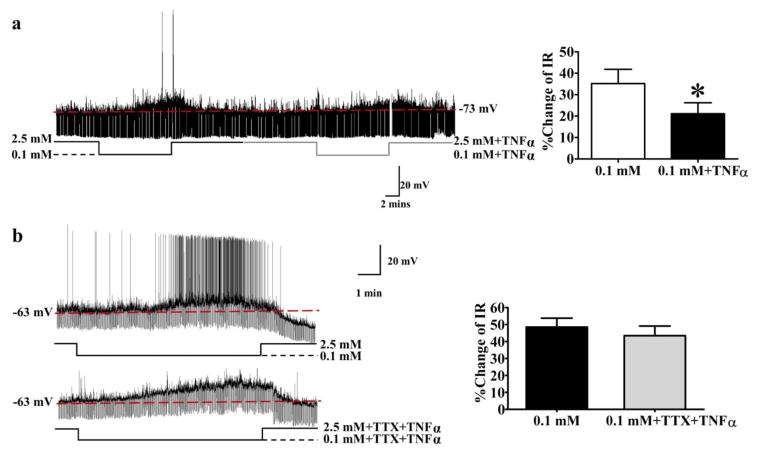
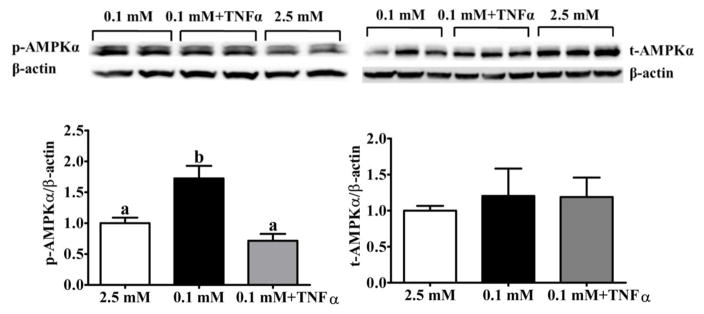
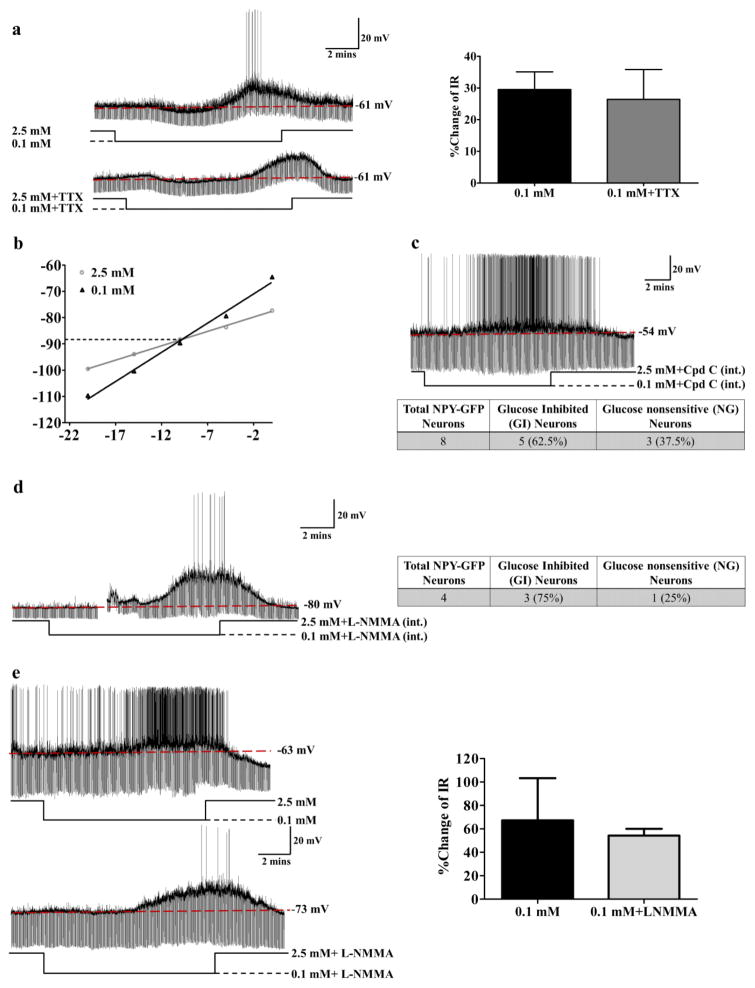
A population of Neuropeptide Y (NPY) neurons which co-express Agouti-related peptide (AgRP) in the arcuate nucleus of the hypothalamus (ARC) are inhibited at physiological levels of brain glucose and activated when glucose levels decline (e.g. glucose-inhibited or GI neurons). Fasting enhances the activation of NPY/AgRP-GI neurons by low glucose. In the present study we tested the hypothesis that lipopolysaccharide (LPS) inhibits the enhanced activation of NPY/AgRP-GI neurons by low glucose following a fast. Mice which express green fluorescent protein (GFP) on their NPY promoter were used to identify NPY/AgRP neurons. Fasting for 24h and LPS injection decreased blood glucose levels. As we have found previously, fasting increased c-fos expression in NPY/AgRP neurons and increased the activation of NPY/AgRP-GI neurons by decreased glucose. As we predicted, LPS blunted these effects of fasting at the 24h time point. Moreover, the inflammatory cytokine tumor necrosis factor alpha (TNFα) blocked the activation of NPY/AgRP-GI neurons by decreased glucose. These data suggest that LPS and TNFα may alter glucose and energy homeostasis, in part, due to changes in the glucose sensitivity of NPY/AgRP neurons. Interestingly, our findings also suggest that NPY/AgRP-GI neurons use a distinct mechanism to sense changes in extracellular glucose as compared to our previous studies of GI neurons in the adjacent ventromedial hypothalamic nucleus.

Keywords: Anorexia; Fasting; GI neurons; LPS; NPY/AgRP neurons; TNFα.


Conflict of interest statement

There is no Conflict of interest.

Figures

Figure 1
Figure 1. LPS decreased refeeding, body weight and glycemia
(a–b): 4–6 week old male wild-type mice were injected subcutaneously (s.c.) with saline or LPS (40 μg/mouse) prior to food removal. After 24 hours food was returned. Food intake (a) and body weight (b) were measured at 6h, 12h and 24h post-refeeding. LPS decreased food intake and body weight gain at all-time points. Bar graphs represent the food intake or body weight gain post-refeeding at each time point. n=4 for Fasted/S group, n=3 for Fasted/L group. *p<0.01 compared to the saline group as determined by student’s t-test. (c) 4–6 week old male wild-type mice were separated into fed or fasted groups and injected with saline or LPS (40 μg/mouse, s.c). Food was removed from the fasted groups immediately post-LPS injection. Blood glucose level was measured 24 hours later. Fasting and LPS significantly decreased blood glucose level, and LPS resulted in a further decrease fasted mice. Different letters indicate statistical significance among the four groups determined by two-way ANOVA followed by Tukey’s multiple comparison test (p<0.05; Fed/Saline, n=21; Fasted/Saline, n=21; Fasted/LPS, n=21; Fed/LPS, n=9). Bars with the same letter are not statistically different (p>0.05).
Figure 2
Figure 2. LPS blunted fasting induced c-fos activation in NPY-GFP mice
(a) Fasting increased c-fos expression in NPY neurons (Fasted/S vs Fed/S); while LPS blocked fasting-induced c-fos expression in NPY/AgRP neurons at the 24 hour time point (Fasted/L). LPS had no effect on c-fos expression in fed mice (Fed/L). White arrows indicate cells in which NPY/AgRP and c-fos are colocalized. (b) Bar graphs represent the percentage of c-fos and GFP colocalized cells. Different letters indicate statistical significance among the four groups determined by two-way ANOVA followed by Tukey’s multiple comparison test (p<0.05; n=3 mice/group).Scale bar: 100 μM. 3V: 3rd cerebral ventricle. Bars with the same letter are not statistically different (p>0.05). ME: Median Eminence. The data are presented as mean ± standard error of the mean (SEM).
Figure 3
Figure 3. LPS blunted the effect of fasting on the response of NPY-GI neurons to decreased glucose
(a–d) Representative whole cell current-clamp recordings from NPY-GI neurons. The top trace from each of the four groups shows the response of an NPY/AgRP-GI neuron to a glucose decrease from 2.5 mM to 0.1 mM. The bottom trace from each group shows the response of the same neuron to a glucose decrease from 2.5 mM to 0.5 mM. The resting membrane potential is given above the first trace for each group. The percent change of membrane potential and input resistance relative to that in 2.5 mM glucose was used to quantify changes in the response to a glucose decrease from 2.5 to 0.1 (e) and 0.5 mM (f). Data were analyzed by 2 way ANOVA followed by Tukey’s multiple comparison test. Different letters represent statistical differences (p<0.05; N values ranged from 6–8 neurons from a minimum of 5 mice for each of the measurements). Bars with the same letter are not statistically different (p>0.05). There was a significant increase in depolarization in response to both glucose decreases in the neurons from fasted saline-treated mice compared to fed saline-treated mice. In contrast, the membrane potential response was not enhanced in the fasted vs fed LPS-treated mice. The increase in input resistance in response to decreased glucose was greater in neurons from fasted saline-treated vs LPS-treated mice. The two-way ANOVA results are as follows. Membrane potential 0.1 mM glucose: feeding state F(1,23) = 7.01 (p = 0.01); treatment F(1,23) = 0.07 (p = 0.79); interaction F(1,23) = 2.38 (p = 0.13). Input resistance 0.1 mM glucose: feeding state F(1,23) = 4.076 (0.055); treatment F(1,23) = 10.85 (p = 0.003); interaction F(1,23) = 2.04 (p = 0.16). Membrane potential 0.5 mM glucose: feeding state F(1,24) = 10.56 (p = 0.003); treatment F(1,24) = 3.93 (p = 0.06); interaction F(1,24) = 1.85 (p = 0.19). Input resistance 0.5 mM glucose: feeding state F(1,24) = 22.00 (p < 0.0001); treatment F(1,24) =26.74 (P<0.0001); interaction F(1,24) = 0.11 (p = 0.74).
Figure 4
Figure 4. TNFα blunted the response of NPY-GI neurons to decreased glucose through a presynaptic mechanism
Representative current clamp recordings of NPY-GI neurons (a, b; left panels). a) In response to decreased glucose from 2.5 to 0.1 mM, this NPY-GFP neuron depolarized and increased its input resistance (IR; left panel). TNFα attenuated depolarization and increased IR of this NPY-GI neuron in response to decreased glucose. The bar graph shows %change of IR compared to that in 2.5 mM glucose (right panel). *p<0.05, determined by paired student’s t-test; n=5 neurons evaluated in the presence and absence of TNFα. b) In the presence of the sodium channel blocker tetrodotoxin (TTX), the effect of TNFα on the % change of IR was abolished. n=6 neurons evaluated for an effect of TNFα in the presence and absence of TTX. ns: no significant difference, determined by paired student’s t-test (p<0.05). The data are presented as mean ± standard error of the mean. Neurons were obtained from 4 – 5 different mice for each experiment.
Figure 5
Figure 5. TNFα suppressed VMH AMPKα phosphorylation
VMH slices were exposed to decreased glucose from 2.5 to 0.1 mM in the presence or absence of TNFα (40 ng/ml) for 30 mins. Control slices were maintained in 2.5 mM. Decreasing the glucose concentration increased p-AMPKα; this was blocked by TNFα. t-AMPKα was not affected by low glucose or TNFα (p<0.05; n=5 mice/group). Representative western blots are shown at the top and bar graphs representing group averages are shown at the bottom of the figure. Results were presented as the percentage of loading control by normalization to β-actin. The data are presented as mean ± standard error of the mean (SEM). Note that the groups in the representative blot do not follow the order of the bar graph. SEM).
Figure 6
Figure 6. NPY-GI neurons use a distinct glucose sensing mechanism
(a) There was no significant difference in the increased IR in response to decreased glucose from 2.5 to 0.1 mM in the presence or absence of TTX suggesting that low glucose directly activates NPY-GI neurons. The traces are representative whole cell current clamp recordings from an NPY-GI neuron in a brain slice. TTX blocks action potentials as shown in lower trace. The bar graphs represent %change of IR compared to that in 2.5 mM glucose (ns: no significant difference, determined by paired student’s t-test; n=6 neurons from 6 different mice evaluated for the effect of 0.1 mM glucose in the presence and absence of TTX). The data are presented as mean ± standard error of the mean (SEM). (b) Hyperpolarizing pulses from −5 to −50 pA in −5 pA steps were injected in 2.5 mM glucose and at the end of each treatment with 0.1 mM glucose. The membrane voltage measured at each pulse was used to plot the voltage-current relationship. A representative voltage-current relationship is shown. The reversal potential for this NPY-GI neurons is around −89 mV which is close to the potassium equilibrium potential (EK=−99.27) in our solutions. (c) Dialysis of NPY-GFP neurons with Compound C (Cpd C) in the patch pipette solution did not block the response of NPY neurons to decreased glucose. The trace represents the response of an NPY-GI neuron to decreased glucose after intracellular dialysis with the AMPK inhibitor Compound C. Approximately 60% (5 out of 8) of NPY neurons were recorded to be GI neurons (2 mice) after dialysis with intracellular Compound C (int.). This is identical to the expected percentage of NPY-GI neurons in the untreated population (d) Dialysis of an NPY/AgRP-GFP neuron with L-NMMA in pipette solution did not abolish the response of the NPY/AgRP neuron to decreased glucose from 2.5 mM to 0.1 mM. As shown in the table, 3 of 4 NPY/AgRP-GFP neurons (75%; 3 mice) were activated by low glucose after dialysis with intracellular L-NMMA (int.). This is similar to the expected percentage of NPY-GI neurons in the untreated population. The gap in the trace is a mechanical artifact. (e) Bath application of L-NMMA (0.1 mM) did not block the response of this NPY/AgRP-GI neuron to decreased glucose. The bar graphs represent %change of IR compared to that in 2.5 mM glucose. There is no significant difference in the % change IR in response to low glucose in the presence and absence of L-NMMA (n=3 neurons from 3 mice).

Similar articles

Cited by

References

    1. Amitani M, Asakawa A, Amitani H, Inui A. Control of food intake and muscle wasting in cachexia. The International Journal of Biochemistry & Cell Biology. 2013;45:2179–2185. - PubMed
    1. Anderson ST, Commins S, Moynagh PN, Coogan AN. Lipopolysaccharide-induced sepsis induces long-lasting affective changes in the mouse. Brain, Behavior, and Immunity. 2015;43:98–109. - PubMed
    1. Aponte Y, Atasoy D, Sternson SM. AGRP neurons are sufficient to orchestrate feeding behavior rapidly and without training. Nat Neurosci. 2011;14:351–355. - PMC - PubMed
    1. Arruda AP, Milanski M, Romanatto T, Solon C, Coope A, Alberici LC, Festuccia WT, Hirabara SM, Ropelle E, Curi R, Carvalheira JB, Vercesi AE, Velloso LA. Hypothalamic Actions of Tumor Necrosis Factor α Provide the Thermogenic Core for the Wastage Syndrome in Cachexia. Endocrinology. 2010;151:683–694. - PubMed
    1. Arsenijevic D, Montani J-P. Uninephrectomy in rats on a fixed food intake potentiates both anorexia and circulating cytokine subsets in response to LPS. Frontiers in Immunology. 2015;6 - PMC - PubMed

Publication types

MeSH terms