

Noise-induced hearing loss: Neuropathic pain via Ntrk1 signaling
- PMID: 27473923
- PMCID: PMC5002254
- DOI: 10.1016/j.mcn.2016.07.005
Noise-induced hearing loss: Neuropathic pain via Ntrk1 signaling
Abstract
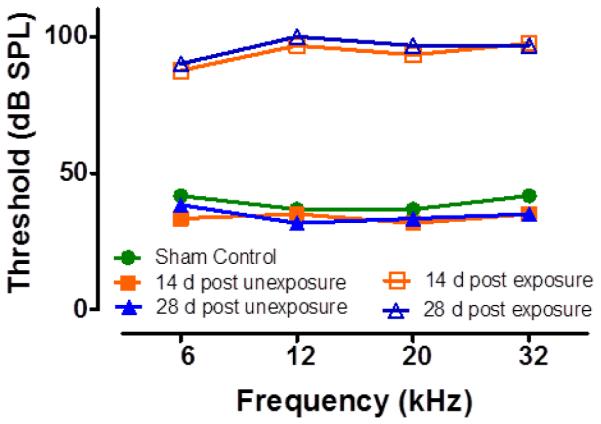
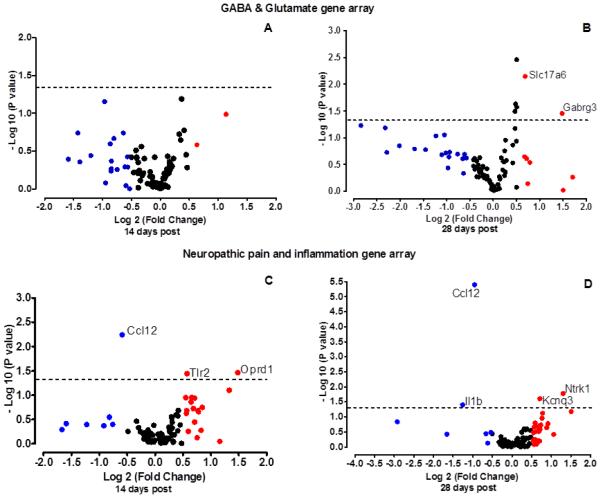
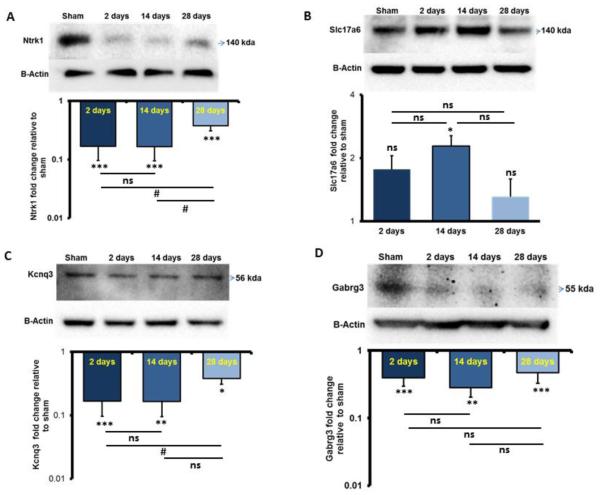
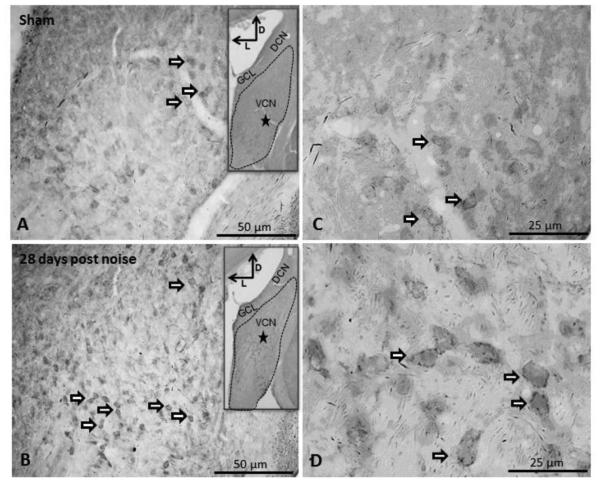
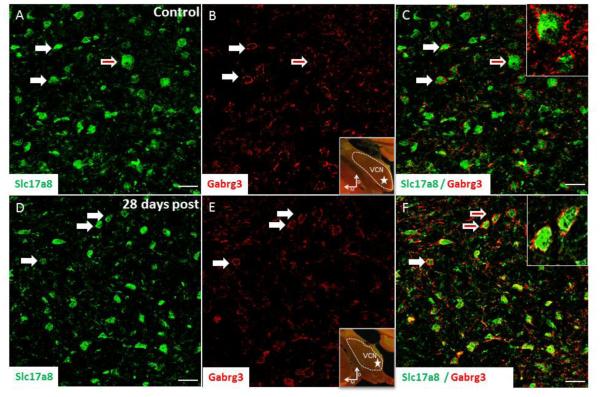
Severe noise-induced damage to the inner ear leads to auditory nerve fiber degeneration thereby reducing the neural input to the cochlear nucleus (CN). Paradoxically, this leads to a significant increase in spontaneous activity in the CN which has been linked to tinnitus, hyperacusis and ear pain. The biological mechanisms that lead to an increased spontaneous activity are largely unknown, but could arise from changes in glutamatergic or GABAergic neurotransmission or neuroinflammation. To test this hypothesis, we unilaterally exposed rats for 2h to a 126dB SPL narrow band noise centered at 12kHz. Hearing loss measured by auditory brainstem responses exceeded 55dB from 6 to 32kHz. The mRNA from the exposed CN was harvested at 14 or 28days post-exposure and qRT-PCR analysis was performed on 168 genes involved in neural inflammation, neuropathic pain and glutamatergic or GABAergic neurotransmission. Expression levels of mRNA of Slc17a6 and Gabrg3, involved in excitation and inhibition respectively, were significantly increased at 28days post-exposure, suggesting a possible role in the CN spontaneous hyperactivity associated with tinnitus and hyperacusis. In the pain and inflammatory array, noise exposure upregulated mRNA expression levels of four pain/inflammatory genes, Tlr2, Oprd1, Kcnq3 and Ntrk1 and decreased mRNA expression levels of two more genes, Ccl12 and Il1β. Pain/inflammatory gene expression changes via Ntrk1 signaling may induce sterile inflammation, neuropathic pain, microglial activation and migration of nerve fibers from the trigeminal, cuneate and vestibular nuclei into the CN. These changes could contribute to somatic tinnitus, hyperacusis and otalgia.
Keywords: Cochlear nucleus; GABA; Gene array; Glutamate; Neuropathic pain; Noise exposure; Sterile inflammation.
Published by Elsevier Inc.
Figures
Similar articles
-
Relationship between noise-induced hearing-loss, persistent tinnitus and growth-associated protein-43 expression in the rat cochlear nucleus: does synaptic plasticity in ventral cochlear nucleus suppress tinnitus?Neuroscience. 2011 Oct 27;194:309-25. doi: 10.1016/j.neuroscience.2011.07.056. Epub 2011 Jul 28. Neuroscience. 2011. PMID: 21821100 Free PMC article.
-
Tracking the expression of excitatory and inhibitory neurotransmission-related proteins and neuroplasticity markers after noise induced hearing loss.PLoS One. 2012;7(3):e33272. doi: 10.1371/journal.pone.0033272. Epub 2012 Mar 12. PLoS One. 2012. PMID: 22428005 Free PMC article.
-
Synaptic Reorganization Response in the Cochlear Nucleus Following Intense Noise Exposure.Neuroscience. 2019 Feb 10;399:184-198. doi: 10.1016/j.neuroscience.2018.12.023. Epub 2018 Dec 26. Neuroscience. 2019. PMID: 30593923 Free PMC article.
-
Advances in the neurobiology of hearing disorders: recent developments regarding the basis of tinnitus and hyperacusis.Prog Neurobiol. 2013 Dec;111:17-33. doi: 10.1016/j.pneurobio.2013.08.002. Epub 2013 Sep 6. Prog Neurobiol. 2013. PMID: 24012803 Review.
-
Activity-dependent plasticity in the adult auditory brainstem.Audiol Neurootol. 2001 Nov-Dec;6(6):319-45. doi: 10.1159/000046844. Audiol Neurootol. 2001. PMID: 11847462 Review.
Cited by
-
Candidate Key Proteins in Tinnitus: A Bioinformatic Study of Synaptic Transmission in Spiral Ganglion Neurons.Cell Mol Neurobiol. 2023 Nov;43(8):4189-4207. doi: 10.1007/s10571-023-01405-w. Epub 2023 Sep 22. Cell Mol Neurobiol. 2023. PMID: 37736859 Free PMC article.
-
Unraveling the molecular landscape of lead-induced cochlear synaptopathy: a quantitative proteomics analysis.Front Cell Neurosci. 2024 Jul 22;18:1408208. doi: 10.3389/fncel.2024.1408208. eCollection 2024. Front Cell Neurosci. 2024. PMID: 39104440 Free PMC article.
-
Effects of Noise Exposure on the Vestibular System: A Systematic Review.Front Neurol. 2020 Nov 25;11:593919. doi: 10.3389/fneur.2020.593919. eCollection 2020. Front Neurol. 2020. PMID: 33324332 Free PMC article. Review.
-
Interaction of auditory and pain pathways: Effects of stimulus intensity, hearing loss and opioid signaling.Hear Res. 2020 Aug;393:108012. doi: 10.1016/j.heares.2020.108012. Epub 2020 Jun 4. Hear Res. 2020. PMID: 32554129 Free PMC article.
-
Candidate Key Proteins in Tinnitus-A Bioinformatic Study of Synaptic Transmission in the Cochlear Nucleus.Biomedicines. 2024 Jul 19;12(7):1615. doi: 10.3390/biomedicines12071615. Biomedicines. 2024. PMID: 39062188 Free PMC article.
References
Publication types
MeSH terms
Substances
Grants and funding
LinkOut - more resources
Full Text Sources
Other Literature Sources
