. 2016 Sep 1;197(5):1957-67.
doi: 10.4049/jimmunol.1500686. Epub 2016 Jul 29.

Bimodal Expansion of the Lymphatic Vessels Is Regulated by the Sequential Expression of IL-7 and Lymphotoxin α1β2 in Newly Formed Tertiary Lymphoid Structures

Affiliations

Bimodal Expansion of the Lymphatic Vessels Is Regulated by the Sequential Expression of IL-7 and Lymphotoxin α1β2 in Newly Formed Tertiary Lymphoid Structures

Saba Nayar et al. J Immunol. .

Abstract

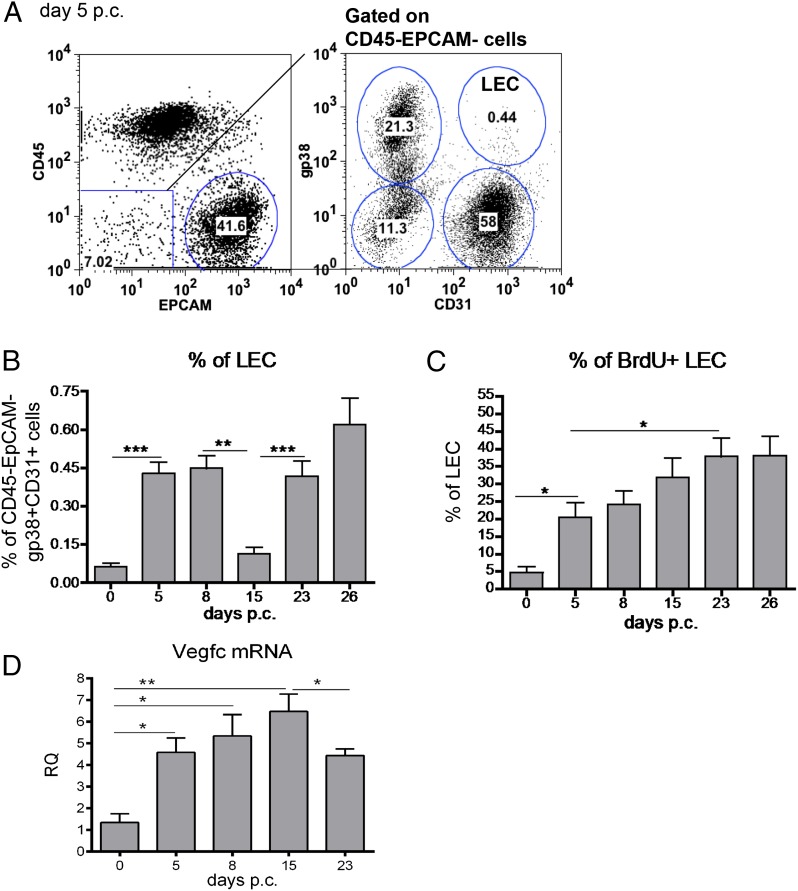
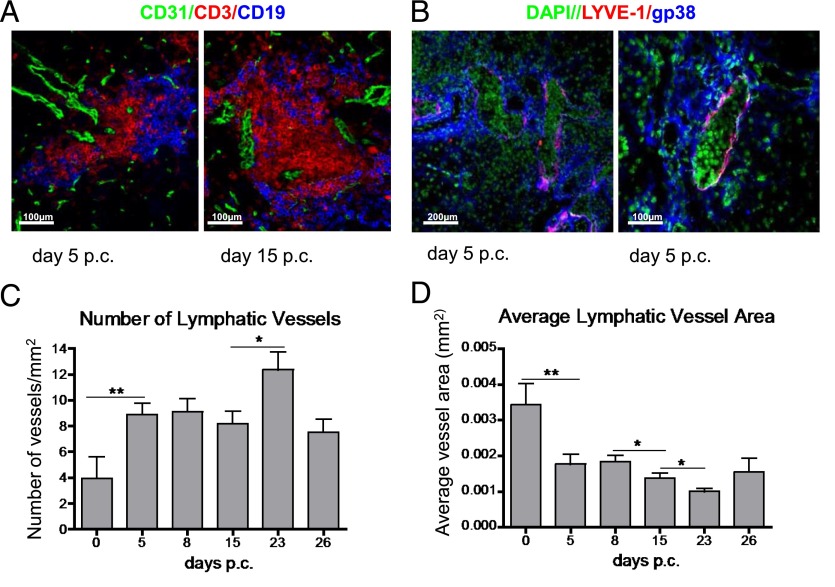
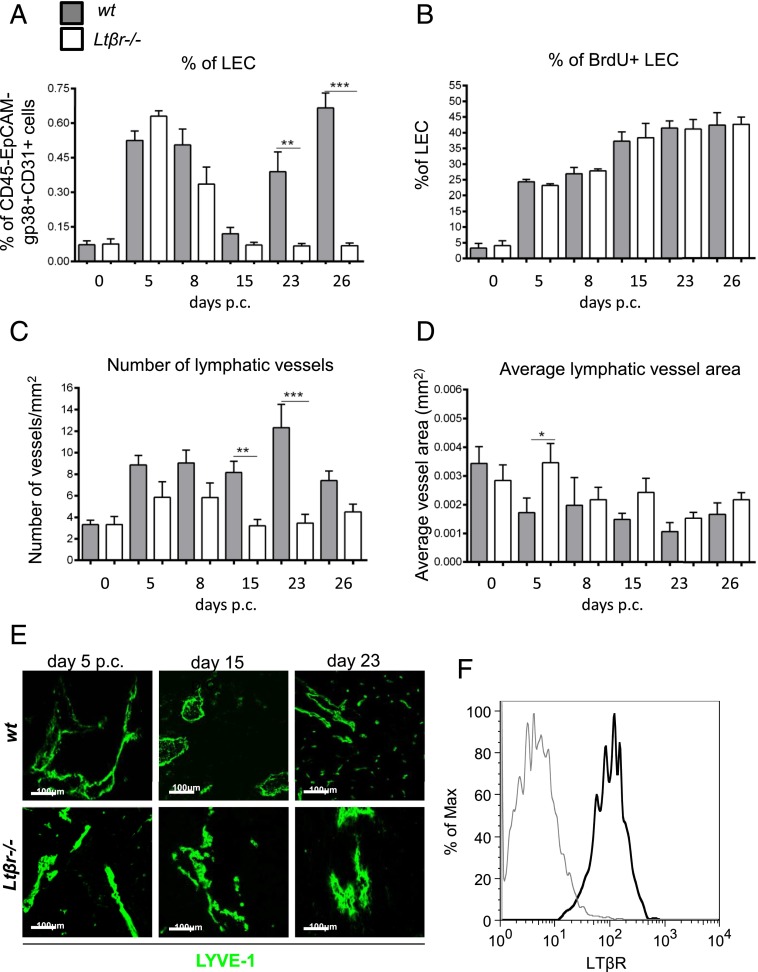
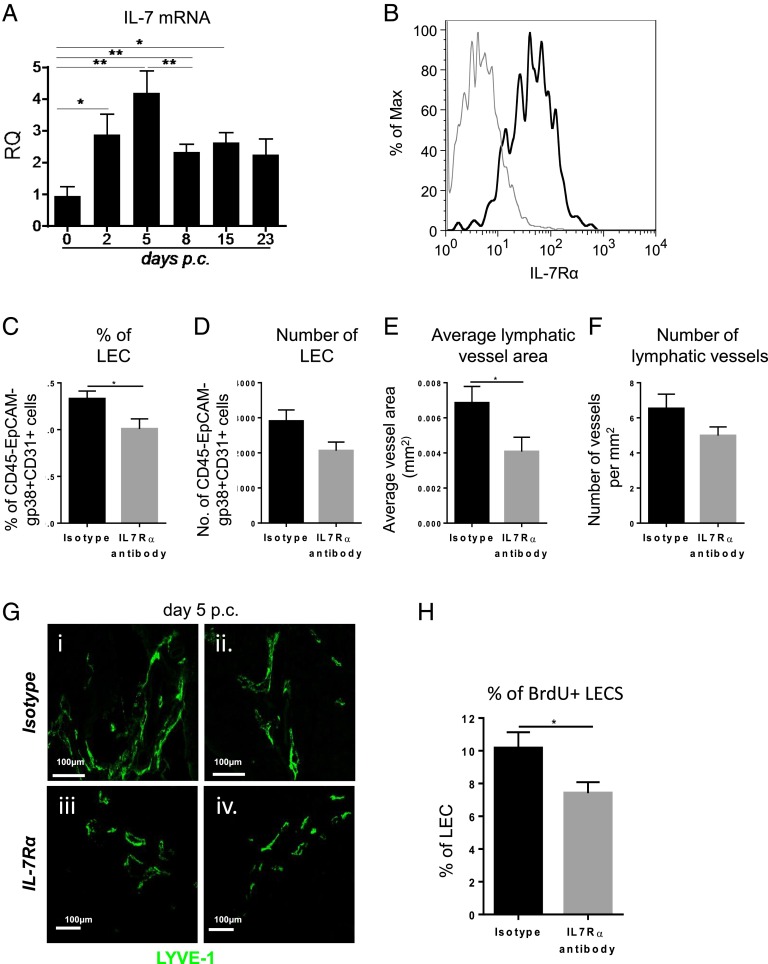
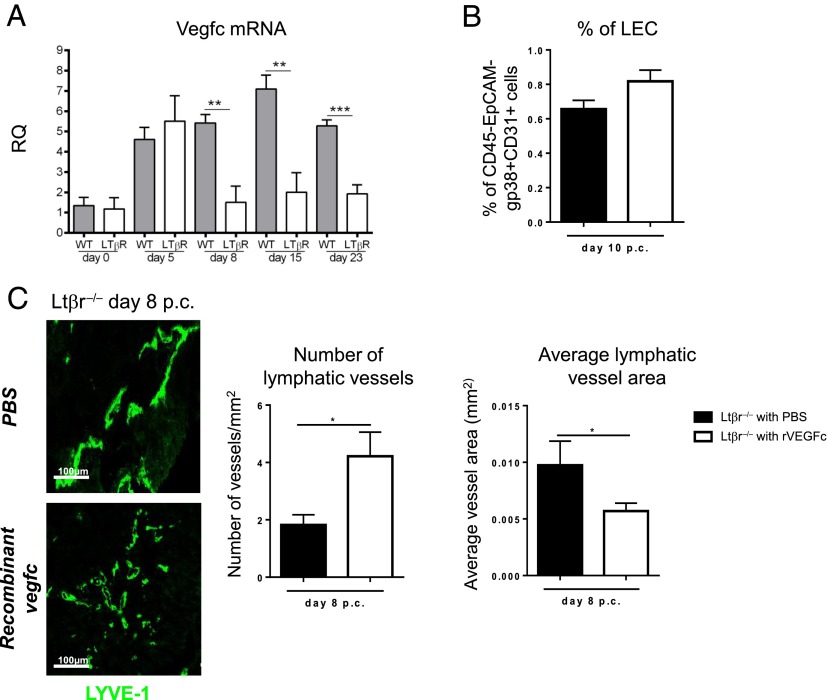
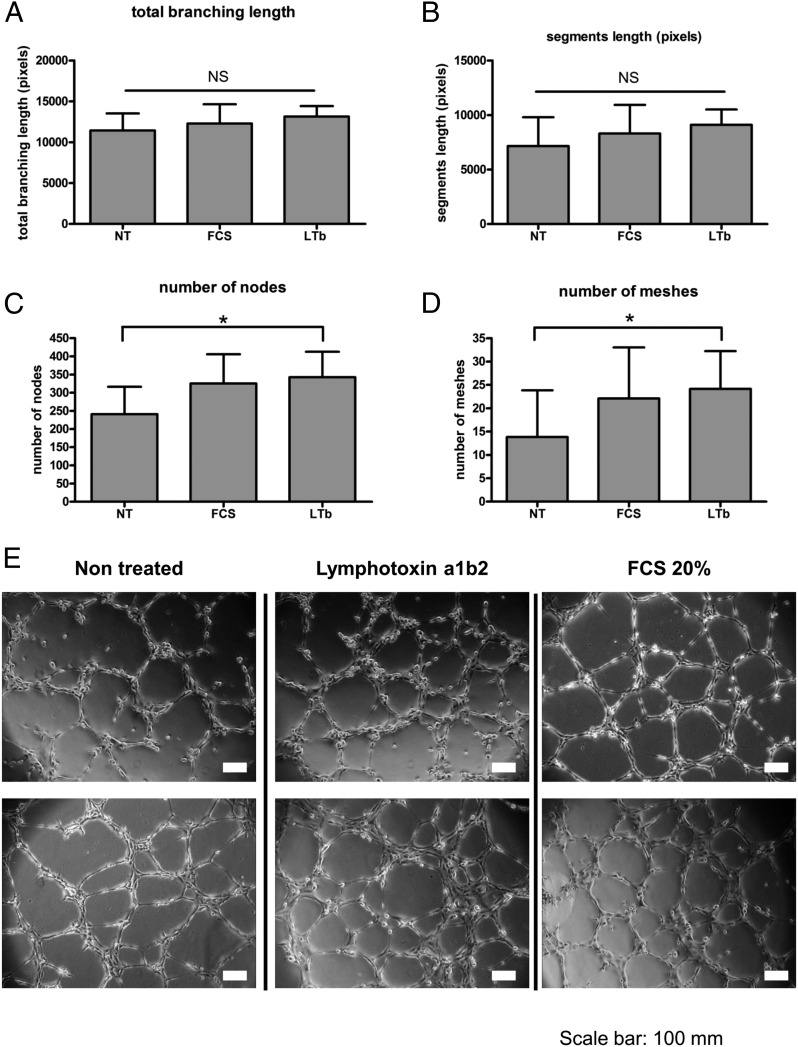
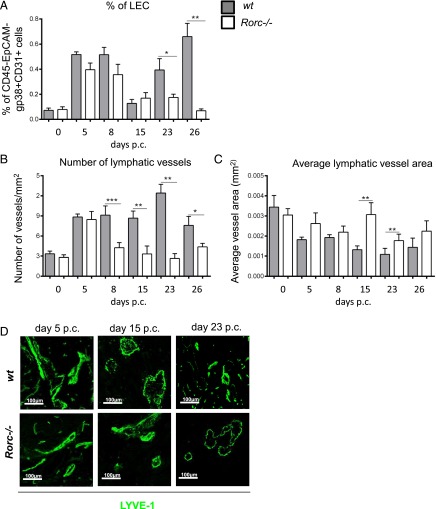
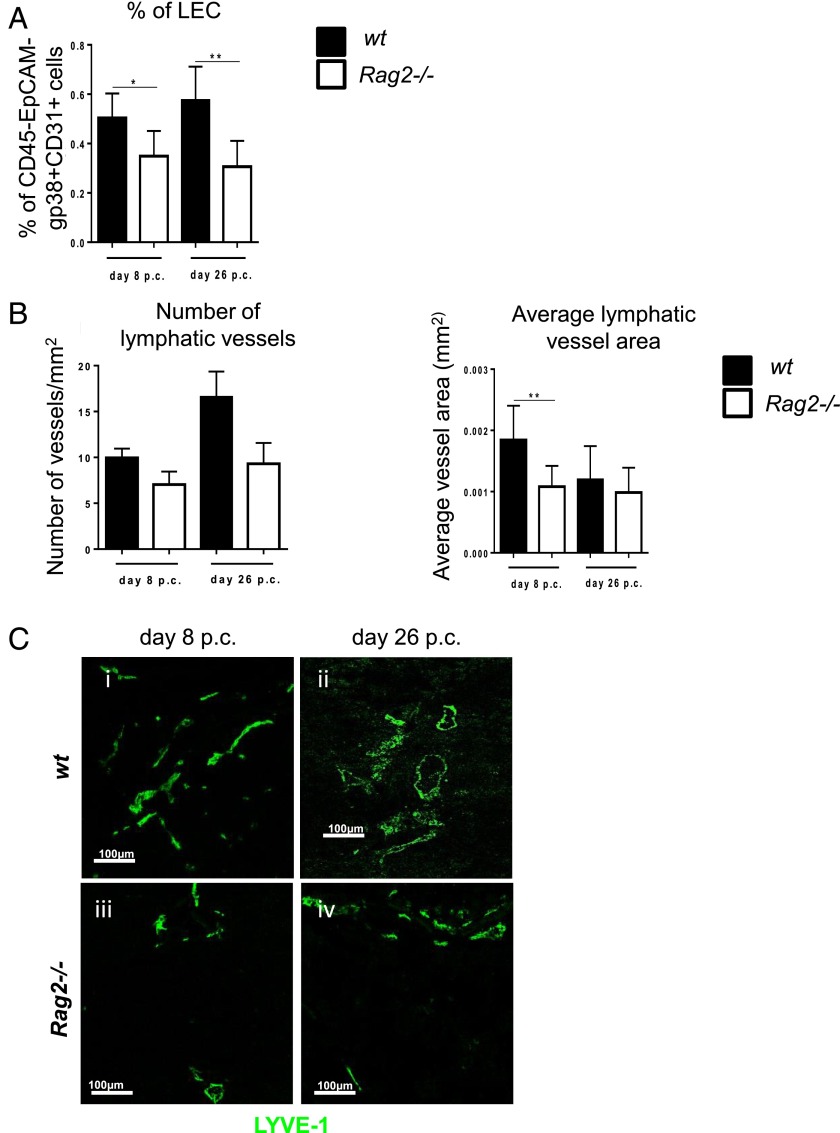
Lymphangiogenesis associated with tertiary lymphoid structure (TLS) has been reported in numerous studies. However, the kinetics and dynamic changes occurring to the lymphatic vascular network during TLS development have not been studied. Using a viral-induced, resolving model of TLS formation in the salivary glands of adult mice we demonstrate that the expansion of the lymphatic vascular network is tightly regulated. Lymphatic vessel expansion occurs in two distinct phases. The first wave of expansion is dependent on IL-7. The second phase, responsible for leukocyte exit from the glands, is regulated by lymphotoxin (LT)βR signaling. These findings, while highlighting the tight regulation of the lymphatic response to inflammation, suggest that targeting the LTα1β2/LTβR pathway in TLS-associated pathologies might impair a natural proresolving mechanism for lymphocyte exit from the tissues and account for the failure of therapeutic strategies that target these molecules in diseases such as rheumatoid arthritis.


Figures

FIGURE 1.
FIGURE 1.
Bimodal expansion of the lymphatic bed during TLS development. (A) Representative dot plots showing flow cytometry staining for gp38 and CD31 in the CD45EpCAM cells from salivary glands isolated at day 5 after viral cannulation. The LECs are identified as gp38+CD31+ cells. (B) Time course of LEC expansion during the inflammatory process determined by flow cytometry (percentage of gp38+CD31+ population in the CD45EpCAM component) from infected wt mice at days 0, 5, 8, 15, 23, and 26 p.c. Data are presented as means of five independent experiments. **p < 0.01, ***p < 0.001, unpaired t test, comparing LEC population at each time point with day 0 p.c. LEC. (C) Graphs showing summary of analysis for percentage of proliferating (BrdU+) gp38+CD31+ LECs in the CD45EpCAM stromal fraction. BrdU was administered from day 0 continuously. *p < 0.05, **p < 0.01 versus day 0 p.c. for wt mice. (D) Quantitative RT-PCR analysis of mRNA transcript for Vegfc in wt mice at days 0, 5, 8, 15, and 23 p.c. Transcripts were normalized to housekeeping gene β-actin. The RQ expression values were calibrated with day 0 p.c. salivary gland values. Data are representative of three to four independent experiments with six to eight glands analyzed per group. Data are shown as mean ± SEM. *p < 0.05, **p < 0.01.
FIGURE 2.
FIGURE 2.
Remodeling of the lymphatic network during TLS development. (A) Photomicrograph of lymphoid aggregates from infected salivary glands (days 5 and 15 p.c.) from wt mice stained for CD3 (red), CD19 (blue), and CD31 (green). Original magnification, ×25. (B) Photomicrograph of lymphatic vessels in infected salivary glands (day 5 p.c.) from wt mice stained for LYVE-1 (red), gp38 (blue), and DAPI (green). Original magnification, ×10 and ×25. (C and D) Graphs summarizing image analysis in salivary gland tissue sections at different time points of the inflammatory process to identify changes observed in lymphatic vessel expansion. The graphs show the number of lymphatic vessels/mm2 of tissue area (C) and average vessel area expressed in mm2 (D). Data are representative of three to four independent experiments with four to six glands analyzed per group. Data shown as mean ± SEM. *p < 0.05, **p < 0.01 versus day 0 p.c. for wt mice.
FIGURE 3.
FIGURE 3.
Lack of LTβ affects lymphangiogenesis in TLS. (A) Graph showing flow cytometry analysis of LEC expansion in wt mice (filled bars) compared with LtβR−/− (open bars) mice. *p < 0.05, **p < 0.01, unpaired t test, comparing gp38+CD31+ LEC population in infected knockout mice at various time points to their wt counterparts. (B) Graphs showing summary of analysis for percentage of proliferating (BrdU+) gp38+CD31+ LEC within the CD45EpCAM stromal fraction in wt mice (filled bars) compared with LtβR−/− (open bars) mice. (C and D) Summarizing image analysis results showing differences observed in the number of lymphatic vessels/mm2 of tissue area (C) and average vessel area (mm2) (D) in wt mice (filled bars) compared with LtβR−/− mice (open bars). Data are representative of three independent experiments with four to six glands analyzed per group. Data are shown as mean ± SEM. *p < 0.05, **p < 0.01, ***p < 0.001, unpaired t test, comparing LYVE-1+ vessels in infected knockout mice at various time points to their wt counterparts. (E) Representative photomicrograph of lymphatic vessels in infected salivary glands (days 5, 15, and day 23 p.c.) from Ltβr−/− mice in comparison with wt mice stained for LYVE-1 (green). Scale bars, 100 μm. (F) Histogram showing LTβR expression (black) and isotype control (gray) on LECs in salivary glands at day 5 p.c.
FIGURE 4.
FIGURE 4.
The early phase of lymphatic vessels remodeling is dependent on IL-7. (A) Quantitative RT-PCR analysis of mRNA transcript for il-7 in wt mice at days 0, 2, 5, 8, 15, and 23 p.c. Transcripts were normalized to housekeeping gene pdgfrß. The RQ expression values were calibrated with day 0 p.c. salivary gland values. Data are representative means ± SEM of three to four experiments with six to four glands analyzed per group. *p < 0.05, **p < 0.01. (B) Histogram showing IL-7Rα expression (black) and isotype control (gray) on LECs in salivary glands at day 5 p.c. (C) Graph showing flow cytometry analysis of percentage of LEC in wt mice treated with isotype Ab (black bars) as compared with IL-7Ra blocking Ab–treated mice (gray bars) mice. Data are represented as mean ± SEM. *p < 0.05. (D) Graph showing flow cytometry analysis of absolute number of LEC in wt mice treated with isotype Ab (black bars) as compared with IL-7Ra blocking Ab–treated mice (gray bars) mice. Data are represented as mean ± SEM. (E and F) Graphs summarizing image analysis results showing differences observed in the number of lymphatic vessels/mm2 of tissue area and average vessel area (mm2) in wt mice treated with IL-7Rα blocking Ab (gray bars) compared with isotype treated mice (black bars). Data are representative of two independent experiments with four to six glands analyzed per group. Data are shown as mean ± SEM. *p < 0.05, unpaired t test. (G) Representative photomicrograph of lymphatic vessels in infected salivary glands (day 5 p.c.) from IL-7Rα blocking Ab–treated mice (i and ii) in comparison with wt mice treated with isotype (iii and iv) stained for LYVE-1 (green). Scale bars, 100 μm. (H) Graphs showing summary of analysis for percentage of proliferating (BrdU+) gp38+CD31+ LEC within the CD45EpCAM stromal fraction in wt mice treated with isotype Ab (black bars) as compared with IL-7Rα blocking Ab–treated mice (gray bars) mice. Data are represented as mean ± SEM. *p < 0.05.
FIGURE 5.
FIGURE 5.
LTα1β2 induces the formation of complex lymphatic networks in vitro. (A) Quantitative RT-PCR analysis of mRNA transcript for Vegfc in LtβR−/− mice (open bars) in comparison with their wt counterparts (filled bars) at days 0, 5, 8, 15, and 23 p.c. Transcripts were normalized to housekeeping gene β-actin. The RQ expression values were calibrated with day 0 p.c. salivary gland values. *p < 0.05, **p < 0.01 versus wt mice. Data are representative of mean ± SEM of three to four experiments with six to four glands analyzed per group. (B) Graph showing flow cytometry analysis of percentage of LECs in LtβR−/− mice treated with recombinant VEGF-C (open bars) as compared with PBS-treated mice (filled bars) mice. Data are represented as mean ± SEM. (C) Representative photomicrograph of lymphatic vessels in infected salivary glands (day 8 p.c.) from recombinant vegfc-treated mice in comparison with PBS-treated LtβR−/− mice stained for LYVE-1 (green). Scale bars, 100 μm. Summarizing image analysis results show differences observed in the number of lymphatic vessels/mm2 of tissue area and average vessel area (mm2) in LtβR−/− mice treated with recombinant vegfc (open bars) as compared with PBS-treated mice (filled bars) mice. Data are representative of two independent experiments with four to six glands analyzed per group. Data are shown as mean ± SEM. *p < 0.05, unpaired t test.
FIGURE 6.
FIGURE 6.
LTα1β2 induces the formation of complex lymphatic networks. In vitro analysis of the effect of LTα1β2 stimulation on lymphatic endothelial cell tube formation assay showing (A) total branching length, (B) segment length (pixels), (C) number of nodes, and (D) number of meshes. (E) Representative photomicrographs of nontreated, FCS-treated, and LTα1β2-treated lymphatic endothelial cells. Data are representative of three independent experiments. *p < 0.05 after one-way repeated measurements ANOVA analysis.
FIGURE 7.
FIGURE 7.
Lymphatic vessel formation is influenced by the expression of LTβ by Rorγ+ cells. (A) Graph showing flow cytometry analysis of LEC expansion in wt mice (filled bars) compared with Rorc−/− mice (open bars). Data are represented as mean ± SEM of two independent experiments. *p < 0.05, **p < 0.01, unpaired t test, comparing gp38+CD31+ LEC population in infected knockout mice at various time points to their wt counterparts. (B) Graphs showing the number of lymphatic vessels/mm2 of tissue in wt mice (filled bars) compared with Rorc−/− (open bars) mice. Data are representative of mean ± SEM of three independent experiments with four to six glands analyzed per group. *p < 0.05, **p < 0.01, ***p < 0.001, unpaired t test, comparing LYVE-1+ vessels in infected knockout mice at various time points to their wt counterparts. (C) Graphs showing average vessel area (mm2) in wt mice (filled bars) compared with Rorc−/− mice (open bars). Data are representative of mean ± SEM of three independent experiments with four to six glands analyzed per group. *p < 0.05, **p < 0.01, ***p < 0.001, unpaired t test, comparing LYVE-1+ vessels in infected knockout mice at various time points to their wt counterparts. (D) Representative photomicrograph of lymphatic vessels in infected salivary glands (days 5, 15, and day 23 p.c.) from Rorc−/− mice in comparison with wt mice stained for LYVE-1 (green). Scale bars, 100 μm.
FIGURE 8.
FIGURE 8.
Lack of lymphocytes affects both phases of lymphatic vessel expansion. (A) Graph showing flow cytometry analysis of LEC expansion in wt mice (filled bars) compared with Rag2−/− mice (open bars) at days 8 and 26 p.c. Data are represented as mean ± SEM of two independent experiments. *p < 0.05, **p < 0.01, unpaired t test, comparing gp38+CD31+ LEC population in infected knockout mice at various time points to their wt counterparts. (B) Graphs showing number of lymphatic vessels and average vessel area (mm2) in wt mice (filled bars) compared with Rag2−/− mice (open bars). Data are representative of mean ± SEM of three independent experiments with four to six glands analyzed per group. **p < 0.01, unpaired t test, comparing LYVE-1+ vessels in infected knockout mice at various time points to their wt counterparts. (C) Representative photomicrograph of lymphatic vessels in infected salivary glands (days 8 and 26 p.c.) from Rag2−/− mice at day 8 p.c. (iii) and day 26 p.c. (iv) in comparison with wt mice at day 8 p.c. (i) and day 26 p.c. (ii) stained for LYVE-1 (green). Scale bars, 100 μm.

References

    1. Acton S. E., Farrugia A. J., Astarita J. L., Mourão-Sá D., Jenkins R. P., Nye E., Hooper S., van Blijswijk J., Rogers N. C., Snelgrove K. J., et al. 2014. Dendritic cells control fibroblastic reticular network tension and lymph node expansion. Nature 514: 498–502. - PMC - PubMed
    1. Liao S., Ruddle N. H. 2006. Synchrony of high endothelial venules and lymphatic vessels revealed by immunization. J. Immunol. 177: 3369–3379. - PubMed
    1. Kim H., Kataru R. P., Koh G. Y. 2012. Regulation and implications of inflammatory lymphangiogenesis. Trends Immunol. 33: 350–356. - PubMed
    1. Huggenberger R., Siddiqui S. S., Brander D., Ullmann S., Zimmermann K., Antsiferova M., Werner S., Alitalo K., Detmar M. 2011. An important role of lymphatic vessel activation in limiting acute inflammation. Blood 117: 4667–4678. - PMC - PubMed
    1. Kataru R. P., Jung K., Jang C., Yang H., Schwendener R. A., Baik J. E., Han S. H., Alitalo K., Koh G. Y. 2009. Critical role of CD11b+ macrophages and VEGF in inflammatory lymphangiogenesis, antigen clearance, and inflammation resolution. Blood 113: 5650–5659. - PubMed

Publication types

MeSH terms

Substances

LinkOut - more resources