. 2016 Sep 1;197(5):1762-75.
doi: 10.4049/jimmunol.1600648. Epub 2016 Jul 29.

Antibodies That Efficiently Form Hexamers upon Antigen Binding Can Induce Complement-Dependent Cytotoxicity under Complement-Limiting Conditions

Affiliations

Antibodies That Efficiently Form Hexamers upon Antigen Binding Can Induce Complement-Dependent Cytotoxicity under Complement-Limiting Conditions

Erika M Cook et al. J Immunol. .

Abstract

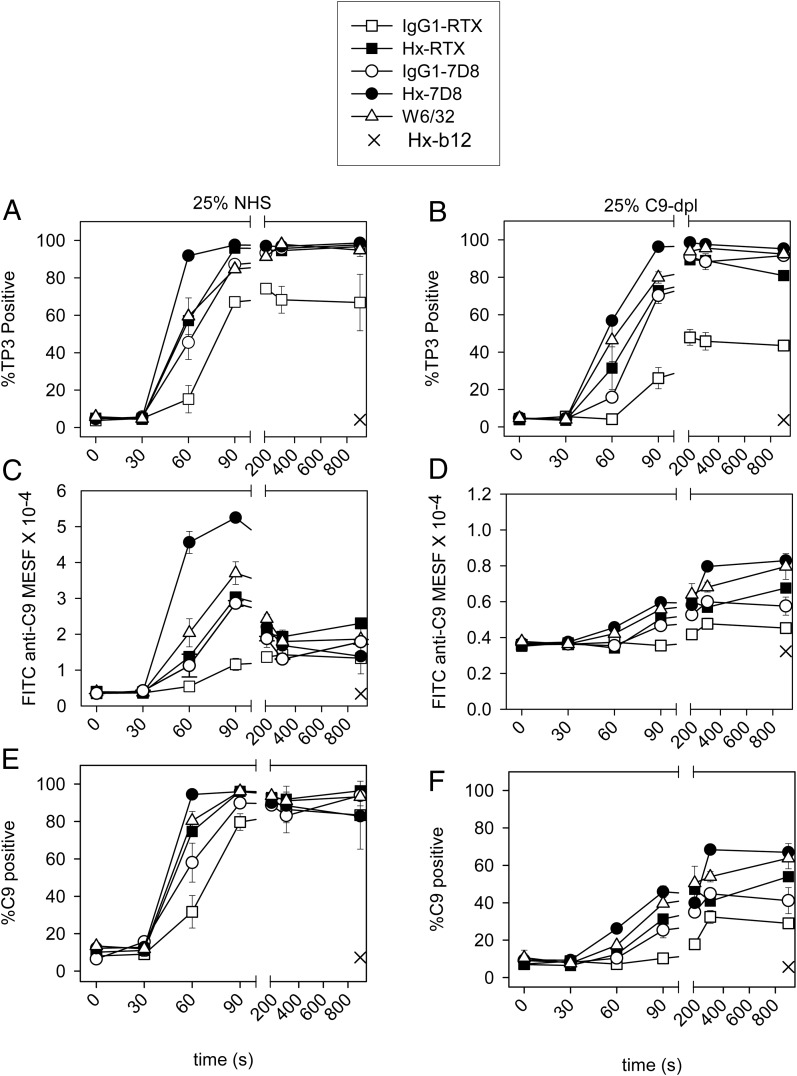
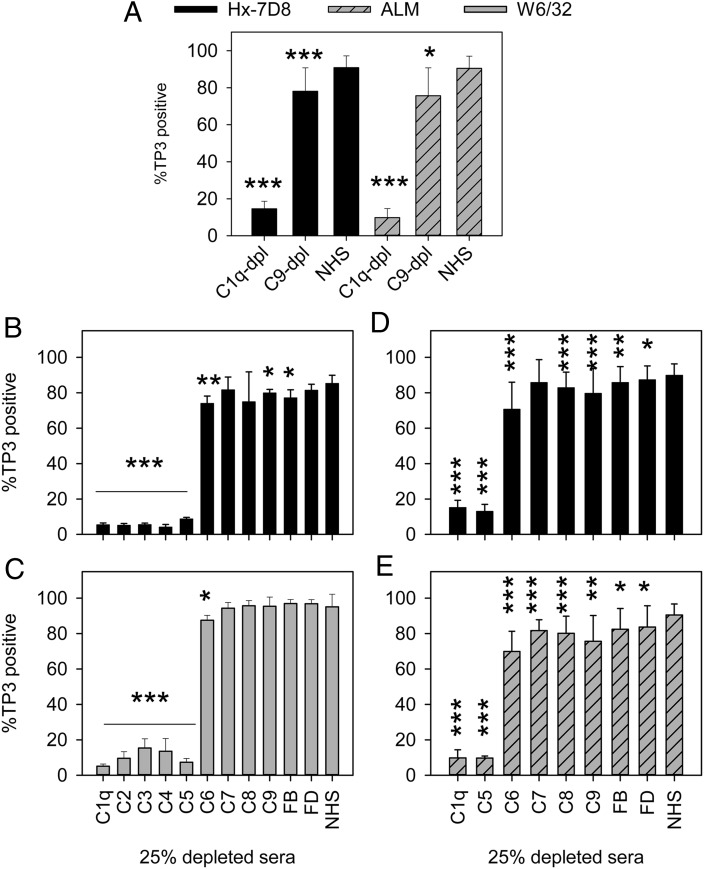
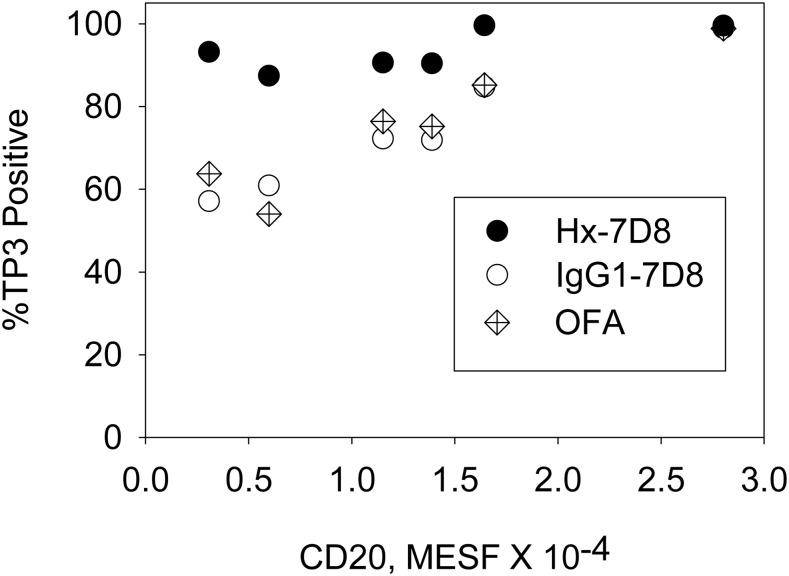
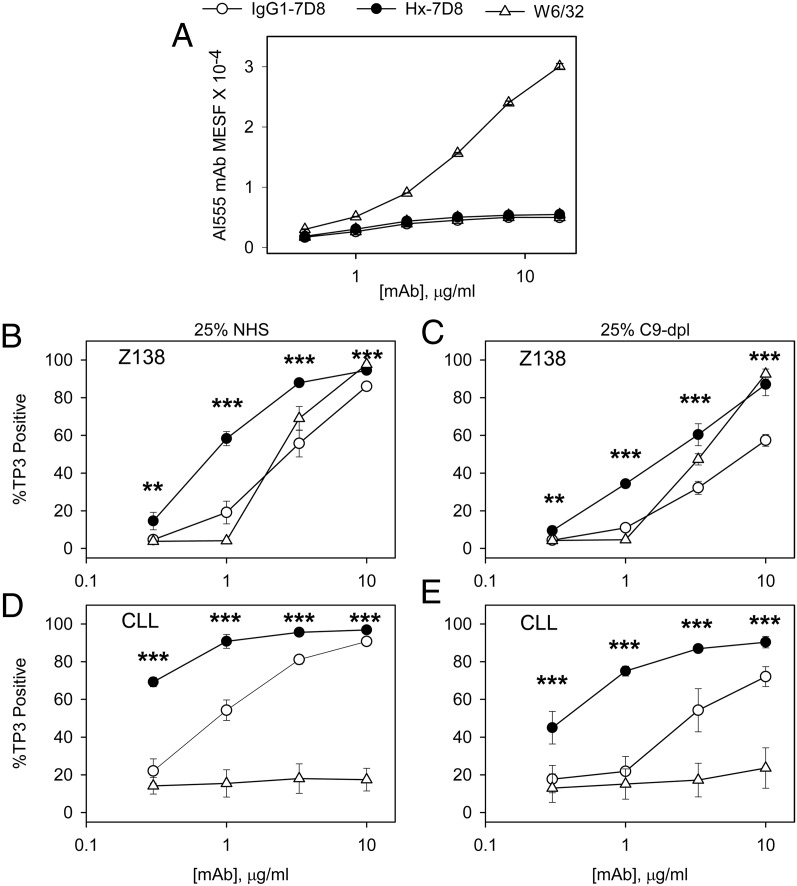
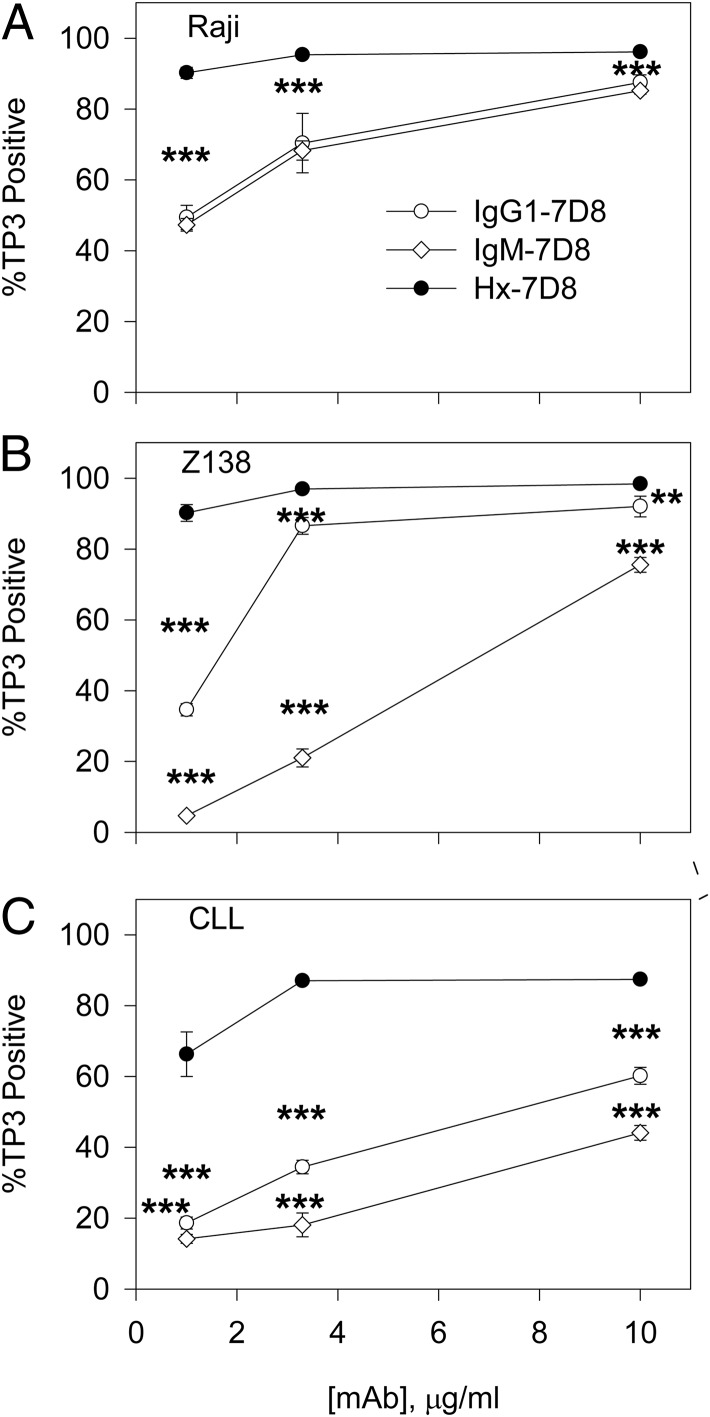
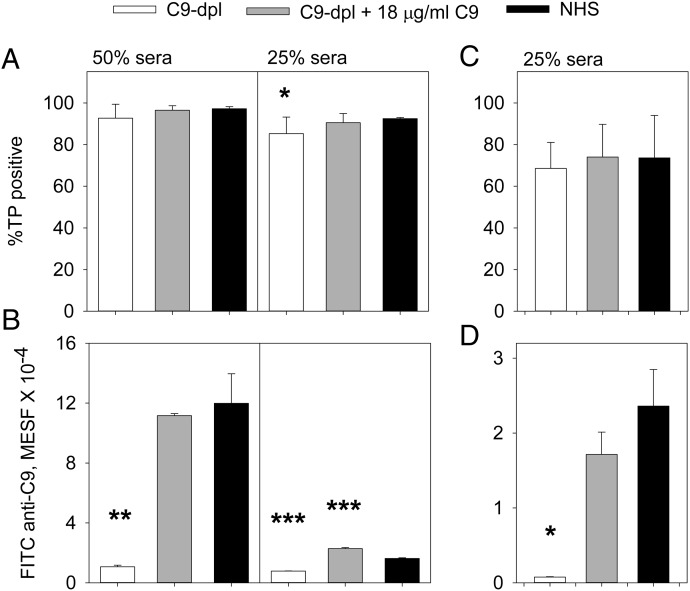
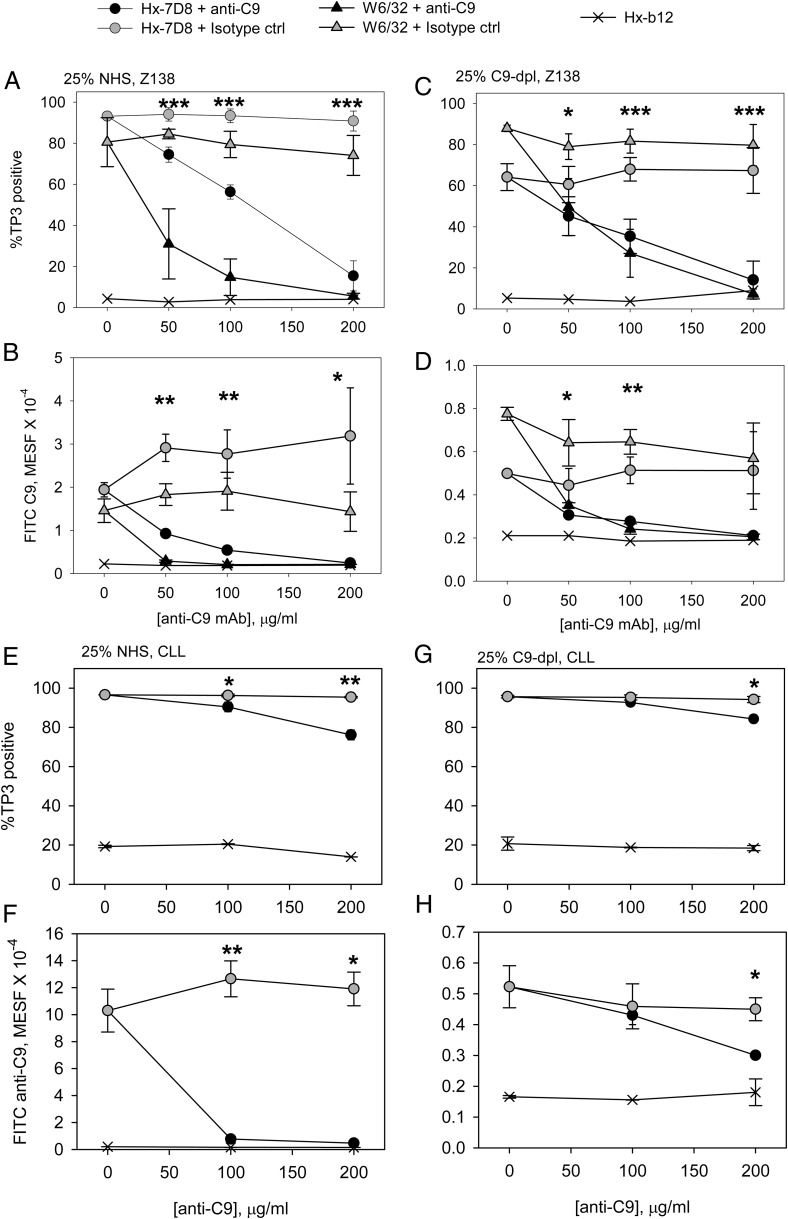
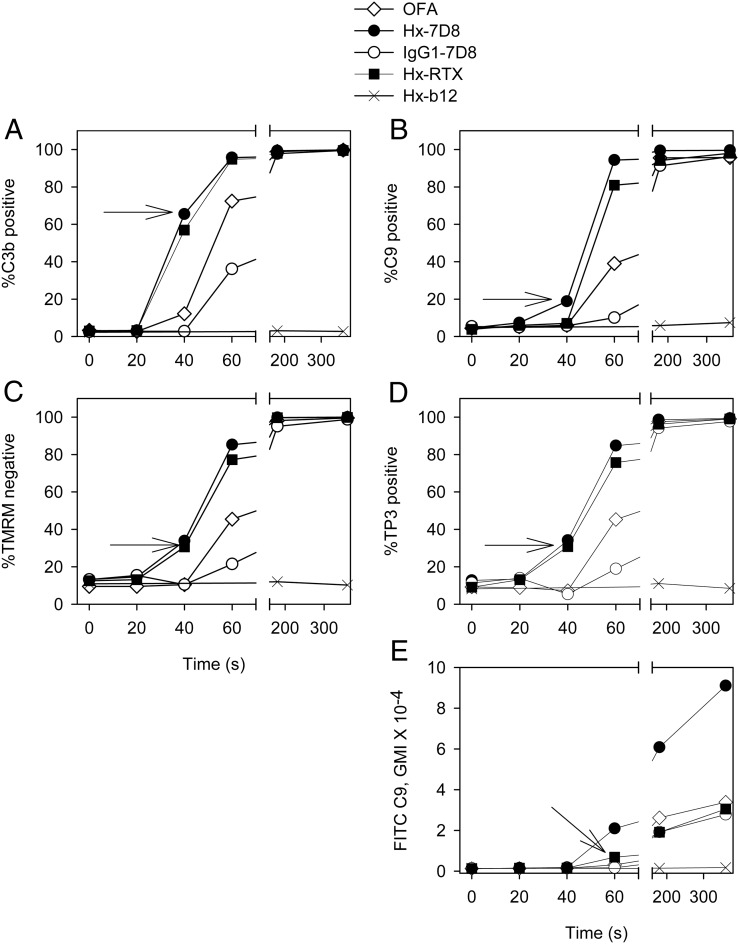
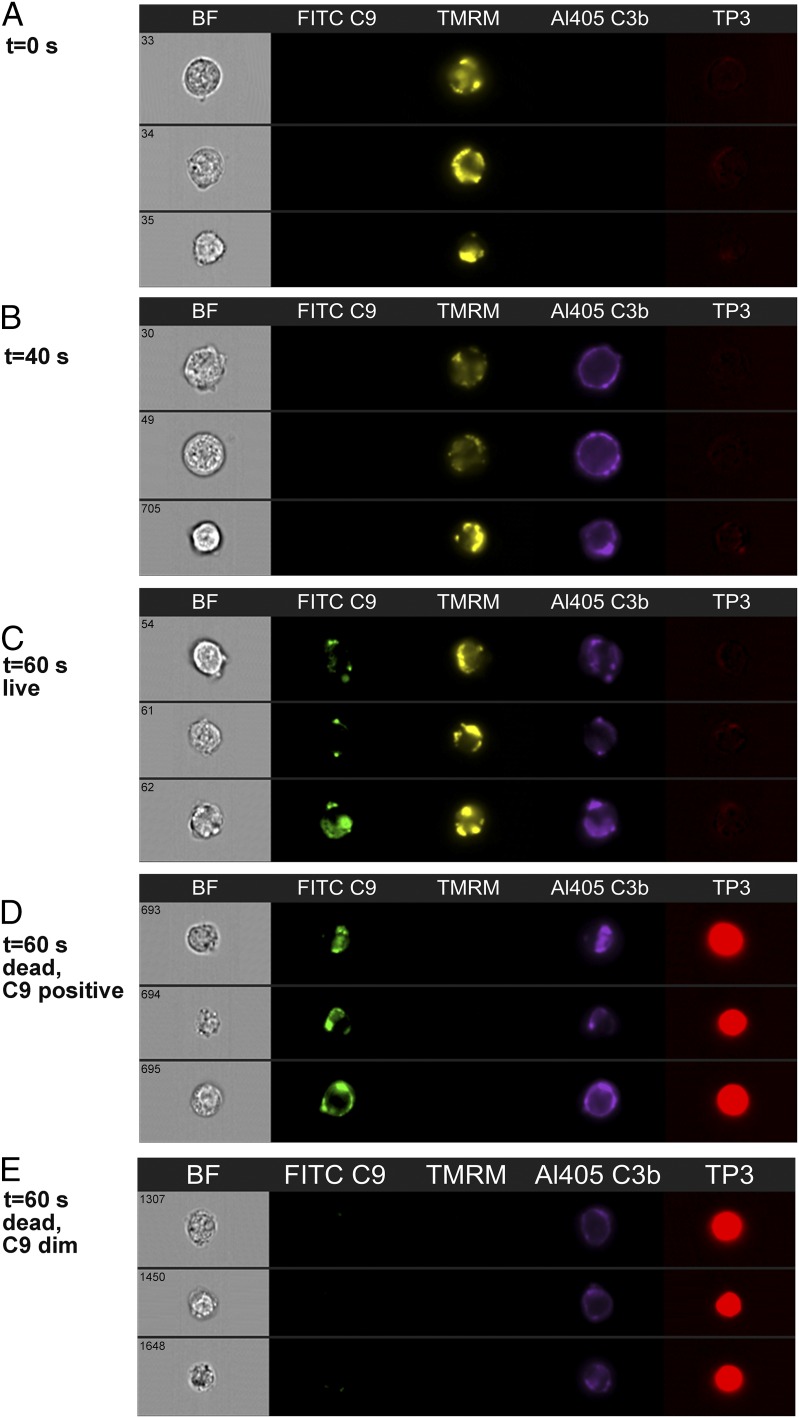
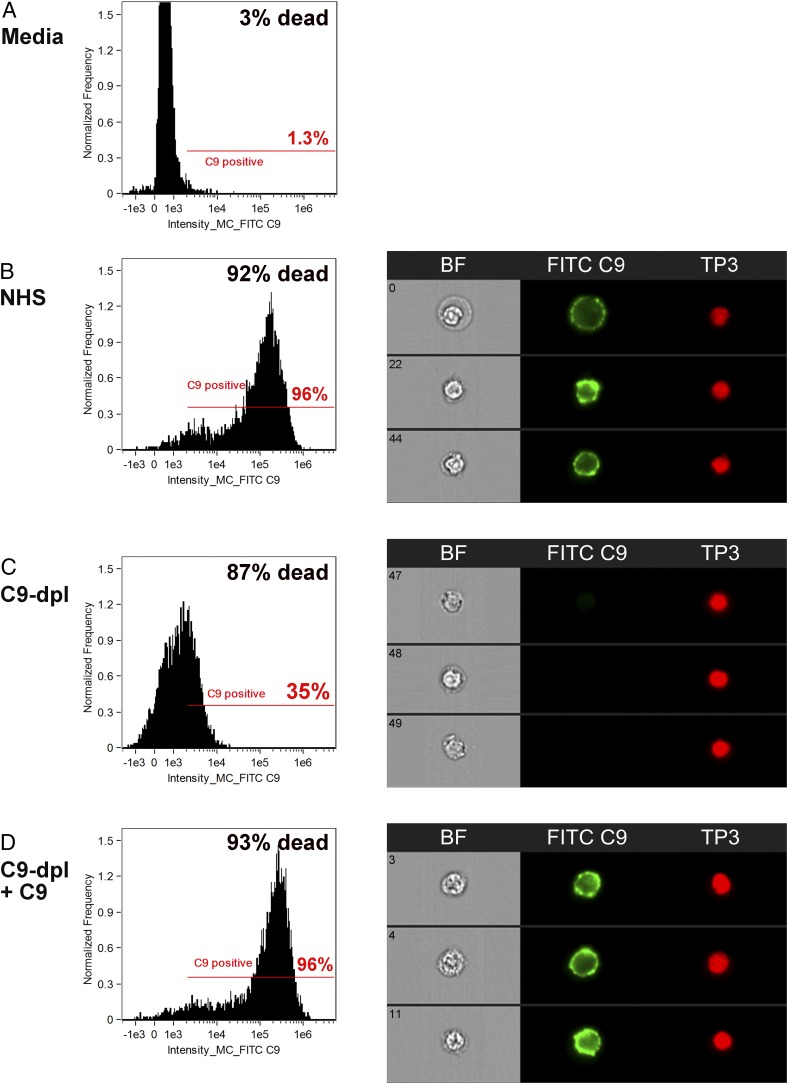
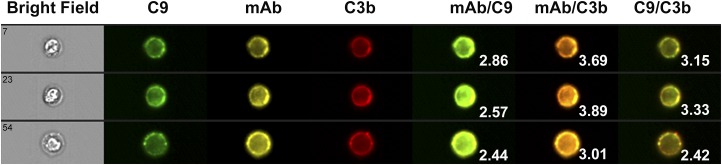
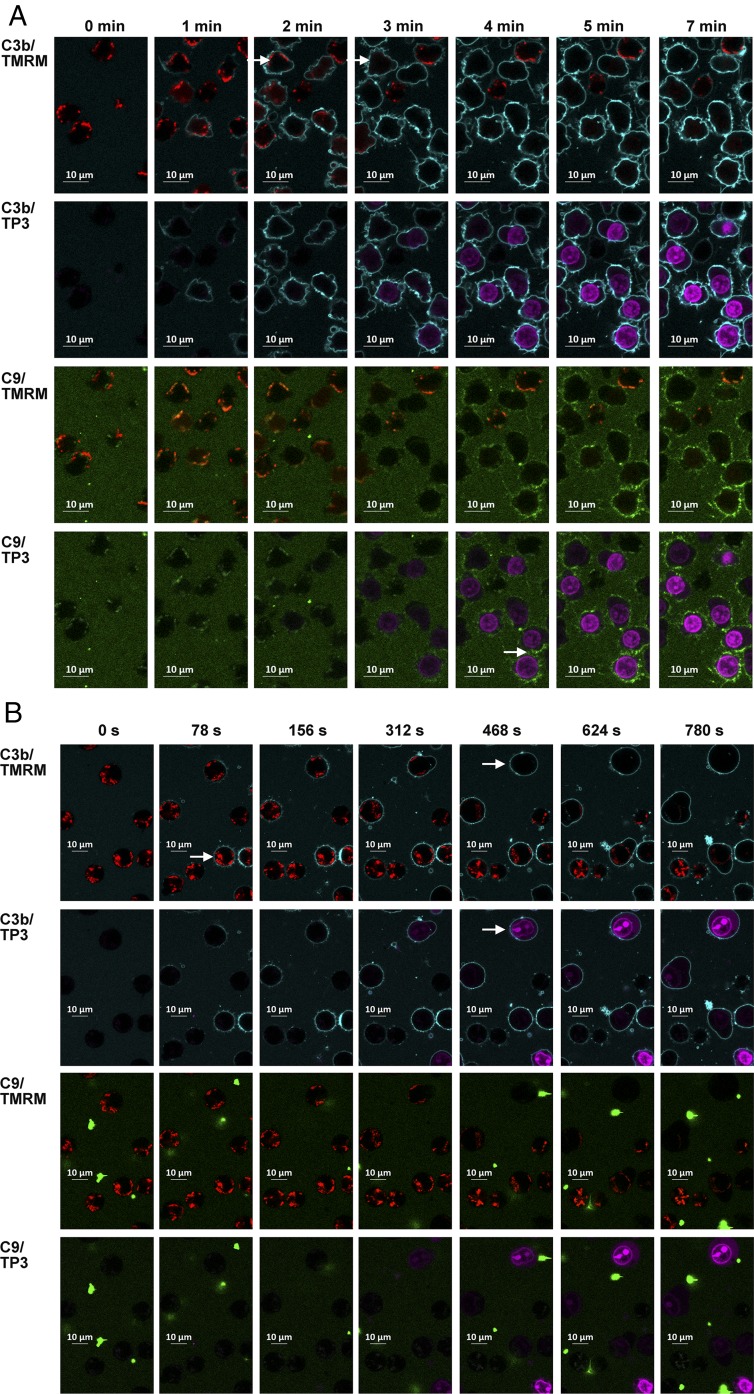
Recently, we demonstrated that IgG Abs can organize into ordered hexamers after binding their cognate Ags expressed on cell surfaces. This process is dependent on Fc:Fc interactions, which promote C1q binding, the first step in classical pathway complement activation. We went on to engineer point mutations that stimulated IgG hexamer formation and complement-dependent cytotoxicity (CDC). The hexamer formation-enhanced (HexaBody) CD20 and CD38 mAbs support faster, more robust CDC than their wild-type counterparts. To further investigate the CDC potential of these mAbs, we used flow cytometry, high-resolution digital imaging, and four-color confocal microscopy to examine their activity against B cell lines and primary chronic lymphocytic leukemia cells in sera depleted of single complement components. We also examined the CDC activity of alemtuzumab (anti-CD52) and mAb W6/32 (anti-HLA), which bind at high density to cells and promote substantial complement activation. Although we observed little CDC for mAb-opsonized cells reacted with sera depleted of early complement components, we were surprised to discover that the Hexabody mAbs, as well as ALM and W6/32, were all quite effective at promoting CDC in sera depleted of individual complement components C6 to C9. However, neutralization studies conducted with an anti-C9 mAb verified that C9 is required for CDC activity against cell lines. These highly effective complement-activating mAbs efficiently focus activated complement components on the cell, including C3b and C9, and promote CDC with a very low threshold of MAC binding, thus providing additional insight into their enhanced efficacy in promoting CDC.


Figures

FIGURE 1.
FIGURE 1.
Z138 cells reacted with Hx-7D8, IgG1-7D8, Hx-RTX, or W6/32 in NHS or in C9-dpl sera are very rapidly killed by CDC, but much more MAC is demonstrable bound to cells reacted in complete NHS than in C9-dpl sera. Less CDC is seen for cells reacted with RTX. (A and B) The percentage of CDC is defined by uptake of TP3. For incubation times of either 90 or 900 s, in NHS or C9-dpl sera, p < 0.001 for Hx-RTX versus IgG1-RTX, and for Hx-7D8 versus IgG1-7D8 (n = 8 in each case). (C and D) MAC binding is determined by probing with FITC mAb aE11, specific for a neoepitope of C9 expressed in the MAC. (E and F) The percentage of all cells that has an FITC mAb aE11 signal above background. Most cells reacted in C9-dpl sera score as weakly positive for C9. mAb Hx-b12 serves as a background control. Also see Supplemental Fig. 1.
FIGURE 2.
FIGURE 2.
Sera depleted of one of several terminal (but not upstream) classical pathway complement components support CDC mediated by several different mAbs. (A) mAbs Hx-7D8 and ALM promote robust CDC of CLL cells after reaction for 15 min in 25% NHS or C9-dpl sera. The results are the average for duplicate determinations on cells from eight different CLL patients for Hx-7D8 and the average for cells from four of the eight patients for ALM; means and SD are displayed. No CDC is observed if Hx-7D8 or ALM is reacted with CLL cells in C1q-dpl sera. Differences between C1q-dpl and C9-dpl versus NHS are significant, as illustrated. (B and C) Both Hx-7D8 and W6/32 mediate CDC of Z138 cells in sera depleted of terminal pathway components or of complement factor B (fB) or complement factor D (fD). n = 4–6. Significant differences versus NHS are noted. (D and E) Both Hx-7D8 and ALM mediate CDC of CLL cells in sera depleted of terminal pathway components or of fB or fD. The averaged results for duplicate determinations on cells from eight different CLL patients are provided. The results for C1q dpl, C9-dpl, and NHS are the same as in (A), and are repeated to allow for ready inspection and comparison with the other depleted sera. *p < 0.05, **p < 0.01, ***p < 0.001.
FIGURE 3.
FIGURE 3.
Hx-7D8 promotes high levels of CDC on CLL B cells regardless of CD20 density. CLL B cells from six untreated patients were subjected to CDC mediated by Hx-7D8, IgG1-7D8, or OFA. Hx-7D8 was considerably more effective than the other two mAbs in promoting CDC (n = 6, p < 0.01). Relative CD20 levels were determined as described in Materials and Methods.
FIGURE 4.
FIGURE 4.
In both NHS and in C9-dpl sera, Hx-7D8 has considerably more CDC activity at low concentrations than IgG1-7D8 or W6/32. (A) Binding isotherms for Al555-labeled mAbs reacted with Z138 cells in BSA-PBS. All three mAbs had F/P ratios of ∼4.5. The x-axis is plotted on a log scale, but the data gave a good fit in a binding isotherm (see text). At saturation, considerably more W6/32 binds to the cells than do the CD20 mAbs, which bind with higher avidity. (B and C) Dose-response CDC of Z138 cells (n = 4). (D and E) Dose-response tests for duplicate determinations of CDC of CLL cells from three patients (averages and SD). In (B)–(E), differences in CDC for cells reacted with Hx-7D8 versus IgG1-7D8 are highly significant. **p < 0.01, ***p < 0.001.
FIGURE 5.
FIGURE 5.
Hx-7D8 has a much higher level of CDC activity than either IgM-7D8 or IgG1-7D8. mAb dose-response tests with Raji cells (A), with Z138 cells (B) and with primary CLL cells from one patient (C). All CDC tests were performed in quadruplicate for 15 min at 37°C in 25% NHS; comparable results were obtained in 50% NHS (data not shown). ***p < 0.001.
FIGURE 6.
FIGURE 6.
Reaction of Z138 cells or CLL cells with Hx-7D8 in C9-dpl sera supplemented with C9 leads to only modest effects on CDC, but supplementation leads to a large increase in deposition of the MAC on the cells. (A) The percentage of CDC for Z138 cells is defined by uptake of TP3. n = 4 in 50% NHS, and n = 8 in 25% NHS. (B) MAC binding is defined based on probing with FITC-labeled mAb aE11; n = 2. (C) As in (A), based on duplicate determinations for CLL cells from four patients reacted with Hx-7D8. (D) The results for only one CLL patient are illustrated because there were very large differences between patients in the amount of C9 binding. However, in three of four CLL patients, p < 0.05 for C9-dpl versus NHS. *p < 0.05, **p < 0.01, ***p < 0.001.
FIGURE 7.
FIGURE 7.
(AD) Addition of neutralizing anti-C9 mAb 22 reduces CDC of Z138 cells and MAC binding, mediated by Hx-7D8 or W6/32, to background levels in both NHS and in C9-dpl sera. (A and C) The percentage of CDC is defined by uptake of TP3; n = 4. Significant differences are evident for cells reacted with Hx-7D8, and the isotype control versus cells reacted with Hx-7D8 and the anti-C9 mAb. Comparable differences are evident for cells reacted with W6/32, but the statistical analyses are omitted for clarity. (B and D) MAC binding is defined based on probing with FITC mAb aE11. Control experiments with an isotype control in place of mAb 22 showed almost no changes. Background signals were determined on reaction with Hx-b12, in the presence of anti-C9 mAb 22. Results for only one experiment (n = 2) are shown because there were often substantial differences in absolute MESF values between experiments. (EH) Addition of neutralizing anti-C9 mAb 22 has only modest effects on CDC of CLL B cells mediated by Hx-7D8 in both NHS and in C9-dpl sera (E–G). However, mAb 22 reduces measureable MAC binding to the CLL cells to close to background levels (F–H). The results of duplicate measurements on CLL cells of a single patient are illustrated, but the same patterns were evident for a second patient (data not shown). *p < 0.05, **p < 0.01, ***p < 0.001.
FIGURE 8.
FIGURE 8.
Reaction of TMRM-dyed Z138 cells with CD20 mAbs in 50% NHS leads to rapid CDC, which is marked first by C3b deposition (A), which is then rapidly followed by binding of C9 (BE), quenching of the TMRM signal (C), and cell death (D). Data were obtained based on multispectral high-resolution fluorescence imaging by flow cytometry. The arrows in (A)–(D) at 40 s emphasize that the deposition of C3b begins prior to binding of C9 or cell death. The arrow is placed in (E) to emphasize that the absolute signal for bound C9 is weak for cells reacted with Hx-RTX after 60 s, but the results in the other panels demonstrate that the majority of the cells have already reacted and were killed. In a small-scale replicate study, after 360 s, mAb 7D8 mediated 98% CDC (TP3 positive), 99% of the cells were TMRM negative, 98% were C3b positive, and 92% were C9 positive, in excellent agreement with the data illustrated in the figure. Background levels for cells reacted mAb Hx-b12 were also quite low, as expected.
FIGURE 9.
FIGURE 9.
Distinct cellular steps in the CDC pathway are illustrated with representative images from the experiment described in Fig. 6 with Hx-7D8. (A) At zero time, cells are alive (TMRM positive, TP3 negative). (B) After 40 s, C3b has deposited, but the cells are still alive, based on the positive TMRM signal and the lack of staining by TP3. (C and D) After 60 s, C9 has bound to the cells. Note that both live (C) and dead (D) (TP3 positive, TMRM negative) C9-positive cells can be seen. (E) After 60 s, 8.6% of dead cells are C9 dim.
FIGURE 10.
FIGURE 10.
CLL cells reacted with Hx-7D8 are killed by CDC in NHS as well as in C9-dpl sera and in C9-dpl sera supplemented with C9. Data were obtained based on multispectral high-resolution fluorescence imaging by flow cytometry. Histograms for FITC C9 binding and representative images are displayed. (A) Unreacted cells. Three percent of the cells are dead, and 1.3% are C9 positive. (B) After reaction for 4 min with Hx-7D8 in NHS, 92% of the CLL cells are dead, and 96% are positive for C9. GMI 7.8 × 10⁴. (C) After reaction for 8 min with Hx-7D8 in C9-dpl-sera, 87% of the CLL cells are dead, and 35% are weakly positive for C9. GMI 1.4 × 10³. (D) After reaction for 4 min with Hx-7D8 in C9-dpl sera supplemented with 20 μg/ml C9, 93% of the CLL cells are dead, and 96% are positive for C9. GMI 12.2 × 10⁴. Similar results were obtained in a separate experiment with CLL B cells from a different patient. After reaction with mAb Hx-7D8 for 8 min: in NHS, 78% of the cells were dead, and 91% were positive for C9; in C9-dpl-sera, 54% of the cells were dead, and 6% were weakly positive for C9; in C9-dpl-sera supplemented with C9, 58% of the cells were dead, and 74% were positive for C9.
FIGURE 11.
FIGURE 11.
C3b and C9 are colocalized on B cells with opsonizing mAb Hx-7D8 after reaction for brief periods in 50% NHS. Data were obtained based on multispectral high-resolution fluorescence imaging by flow cytometry. CLL cells were reacted with Al546 Hx-7D8 in NHS for 8 min and after two washes were probed with both FITC mAb aE11 and with Al594 3E7 (for C3b/iC3b). Images representative of triple-positive cells are shown. BDSS values for the merged images of the individual cells are given. A very high degree of colocalization of Hx-7D8 with C3b is evident, and colocalization of the mAb with C9 is also observed.
FIGURE 12.
FIGURE 12.
Four-color confocal fluorescence microscopy analyses of the kinetics of CDC of Z138 cells with an emphasis on MAC binding: (A) CDC mediated by Hx-7D8 at room temperature in NHS. Images are derived from Supplemental Video 1A–D. Images displayed are based on analyses with two colors at advancing times during the reaction. Upper panel, Al405 mAb 3E7 (C3b/iC3b, light blue) and TMRM (viable mitochondria, red). The arrows at 2 and 3 min indicate C3b deposition, followed by TMRM quenching, respectively. Middle panel, Al405 mAb 3E7 (C3b/iC3b) and TP3 (dead cells, bright purple). Lower panel, FITC anti-C9 (green) and TMRM (viable mitochondria, red). Bottom panel, FITC anti-C9 (green) and TP3 (dead cells, bright purple). The arrow at 4 min denotes the first appearance of FITC mAb aE11 binding. (B) CDC mediated by Hx-7D8 at 37°C in C9-dpl sera. The images are derived from Supplemental Video 2A–D. Fluophores as in (A). The arrow in the upper panel at 78 s denotes C3b deposition. The arrows at 468 s in the upper and next panel denote TMRM quenching and cell killing, respectively. Representative of at least three movies each for Supplemental Videos 1 and 2.

Similar articles

Cited by

References

    1. Glennie M. J., French R. R., Cragg M. S., Taylor R. P. 2007. Mechanisms of killing by anti-CD20 monoclonal antibodies. Mol. Immunol. 44: 3823–3837. - PubMed
    1. Nimmerjahn F., Ravetch J. V. 2012. Translating basic mechanisms of IgG effector activity into next generation cancer therapies. Cancer Immun. 12: 13–20. - PMC - PubMed
    1. Melis J. P. M., Strumane K., Ruuls S. R., Beurskens F. J., Schuurman J., Parren P. W. H. I. 2015. Complement in therapy and disease: regulating the complement system with antibody-based therapeutics. Mol. Immunol. 67(2 Pt A): 117–130. - PubMed
    1. Golay J., Introna M. 2012. Mechanism of action of therapeutic monoclonal antibodies: promises and pitfalls of in vitro and in vivo assays. Arch. Biochem. Biophys. 526: 146–153. - PubMed
    1. Weiner G. J. 2015. Building better monoclonal antibody-based therapeutics. Nat. Rev. Cancer 15: 361–370. - PMC - PubMed

Publication types

MeSH terms