. 2016 Oct 1;473(19):3031-47.
doi: 10.1042/BCJ20160610. Epub 2016 Jul 29.

Inositol hexakisphosphate kinase 1 (IP6K1) activity is required for cytoplasmic dynein-driven transport

Affiliations

Inositol hexakisphosphate kinase 1 (IP6K1) activity is required for cytoplasmic dynein-driven transport

Manasa Chanduri et al. Biochem J. .

Abstract

Inositol pyrophosphates, such as diphosphoinositol pentakisphosphate (IP7), are conserved eukaryotic signaling molecules that possess pyrophosphate and monophosphate moieties. Generated predominantly by inositol hexakisphosphate kinases (IP6Ks), inositol pyrophosphates can modulate protein function by posttranslational serine pyrophosphorylation. Here, we report inositol pyrophosphates as novel regulators of cytoplasmic dynein-driven vesicle transport. Mammalian cells lacking IP6K1 display defects in dynein-dependent trafficking pathways, including endosomal sorting, vesicle movement, and Golgi maintenance. Expression of catalytically active but not inactive IP6K1 reverses these defects, suggesting a role for inositol pyrophosphates in these processes. Endosomes derived from slime mold lacking inositol pyrophosphates also display reduced dynein-directed microtubule transport. We demonstrate that Ser51 in the dynein intermediate chain (IC) is a target for pyrophosphorylation by IP7, and this modification promotes the interaction of the IC N-terminus with the p150(Glued) subunit of dynactin. IC-p150(Glued) interaction is decreased, and IC recruitment to membranes is reduced in cells lacking IP6K1. Our study provides the first evidence for the involvement of IP6Ks in dynein function and proposes that inositol pyrophosphate-mediated pyrophosphorylation may act as a regulatory signal to enhance dynein-driven transport.

Keywords: dynactin; dynein; inositol hexakisphosphate kinase 1; inositol pyrophosphates; protein pyrophosphorylation.


Figures

Figure 1.
Figure 1.. IP6K1 activity regulates Tfn trafficking.
(A) MEFs of indicated genotypes were pulsed for 1 h with Alexa Fluor 488 Tfn (green), and the location of the endocytosed Tfn relative to the nucleus (blue) was examined. Arrows indicate cells showing Tfn accumulation in the perinuclear ERC and arrowheads indicate cells which do not show clear perinuclear Tfn accumulation. Scale bars, 20 µm. (B) The percentage of cells with Tfn accumulation in perinuclear ERC-like structures in (A) was calculated for each experiment. Data are mean ± SEM from three independent experiments (total number of cells analyzed were 174 and 232 cells, respectively, for Ip6k1+/+ and Ip6k1−/− MEFs, and 154 and 285 cells, respectively, for Ip6k1−/− MEFs expressing active or inactive forms of IP6K1). Data were analyzed using one-way ANOVA with Tukey's multiple comparison post hoc test; **P ≤ 0.01. (C) Ip6k1+/+ and Ip6k1−/− MEFs were serum-starved for 1 h and pulsed with Alexa Fluor 488-labeled Tfn for 5 min. Scale bars, 5 µm. (D) Quantification of fluorescence intensity in (C), represented in arbitrary units (a.u.). Data (mean ± SEM, n = 55 and 51 cells, respectively, for Ip6k1+/+ and Ip6k1−/− MEFs) are representative of three independent experiments and were analyzed using a two-tailed Mann–Whitney test; ns, not significant, P > 0.05. (E) Flow cytometry-based measurement of Alexa Fluor 488-labeled Tfn uptake in 5 min, represented in a.u.. Data (mean ± SEM of the median fluorescence from 10 000 cells) are compiled from three independent experiments and were analyzed using a two-tailed unpaired Student's t-test; ns, not significant, P > 0.05. Images in (C) were subjected to ‘levels’ adjustment in Adobe Photoshop to improve visualization.
Figure 2.
Figure 2.. Tfn is held back in early endosomes in cells lacking IP6K1.
(A) MEFs of indicated genotypes were pulsed with Alexa Fluor 488-labeled Tfn (green) for 1 h and immunostained with an antibody directed against the early endosome marker, EEA1 (red). Representative images show costaining of Tfn and EEA1. Scale bars, 5 µm. To visualize the overlap of Tfn with EEA1-positive structures distributed in the cytoplasm, the area within the white square in the merge panel is enlarged in the colocalization panel. (B) Quantification of EEA1 staining intensity in (A). Data (mean ± SEM, n = 58 and 77 cells, respectively, for Ip6k1+/+ and Ip6k1−/− MEFs) are representative of two independent experiments and were analyzed using a two-tailed Mann–Whitney test; ns, not significant, P > 0.05. (C) Colocalization of EEA1-positive structures with Tfn calculated as the percentage of colocalized pixels with respect to the total number of EEA1-positive pixels per cell. Data (mean ± SEM; n = 58 and 77 cells, respectively, for Ip6k1+/+ and Ip6k1−/− MEFs; n = 51 and 52 cells, respectively, for Ip6k1−/− MEFs expressing active or inactive forms of IP6K1) are representative of two independent experiments and were analyzed using one-way ANOVA with Tukey's multiple comparison post hoc test; ***P ≤ 0.001. Images in (A) were subjected to ‘levels’ adjustment in Adobe Photoshop to improve visualization.
Figure 3.
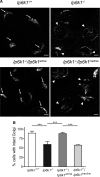
Figure 3.. IP6K1 activity is required to maintain Golgi morphology.
(A) MEFs of indicated genotypes were stained for GM130, a cis-Golgi marker. Arrows indicate cells with intact Golgi morphology and arrowheads indicate cells with fragmented Golgi. Scale bars, 20 µm. (B) Percentage of cells with intact Golgi morphology in (A) was calculated for each experiment. Data are mean ± SEM from three independent experiments (total number of cells analyzed were 100 and 103 cells, respectively, for Ip6k1+/+ and Ip6k1−/− MEFs, and 88 and 92 cells, respectively, for Ip6k1−/− MEFs expressing active or inactive forms of IP6K1). Data were analyzed using one-way ANOVA with Tukey's multiple comparison post hoc test; ***P ≤ 0.001.
Figure 4.
Figure 4.. Slower vesicle motility in cells with reduced levels of inositol pyrophosphates.
(A) Representative images of Ip6k1+/+ and Ip6k1−/− MEFs bound to Alexa Fluor 594-conjugated CT-B. Scale bar, 5 μm. (B) Quantification of fluorescence intensity of CT-B per cell in (A) after 1 h binding on ice. Data (mean ± SEM, n = 25 cells for Ip6k1+/+ and Ip6k1−/− MEFs) are representative of two independent experiments and were analyzed using a two-tailed Mann–Whitney test; ns, not significant, P > 0.05. (CF) Representative tracks of Supplementary Videos S1–S4 of CT-B movement as analyzed using the manual tracking plugin in ImageJ (upper panel) and enlarged tracks from different fields within the same cell (lower panel). Scale bar, 10 μm. (G) Distance moved in 1 min by CT-B containing vesicles in MEFs of indicated genotypes (see Supplementary Videos S1–S4). Data (mean ± SEM; n = 111 and 102 vesicles, respectively, for Ip6k1+/+ and Ip6k1−/− MEFs; n = 95 and 102 vesicles, respectively, for Ip6k1−/− MEFs expressing active or inactive forms of IP6K1) are compiled from three independent experiments and were analyzed using one-way ANOVA with Tukey's multiple comparison post hoc test; ***P ≤ 0.001.
Figure 5.
Figure 5.. Phagosomal motility requires IP6K1.
(A) Peritoneal macrophages isolated from Ip6k1+/+ and Ip6k1−/− mice were pulsed with 750 nm latex beads for 1 h, washed and incubated in serum-containing medium for 1 h, and imaged by DIC microscopy to assess the localization of beads. The figure shows three representative cells of each genotype. The white dotted line indicates the cell outline and the yellow dotted line shows the nucleus outline. Scale bar, 10 μm. (B) The fractional distance of each phagocytosed bead from the nuclear centroid was calculated as described in the Materials and Methods section. Data (mean ± SEM; n = 910 beads in 36 cells for Ip6k1+/+ and 604 beads in 34 cells for Ip6k1−/− macrophages) are compiled from two independent experiments and were analyzed using a two-tailed Mann–Whitney test; ***P ≤ 0.001. (C) Contingency table showing cell-based quantification of data in (A). Beads with a fractional distance of ≤0.4 were classified as ‘perinuclear’, and each cell was categorized as having either ≥60 or <60% perinuclear beads. Data were analyzed by a two-tailed Fisher's exact test, P ≤ 0.001.
Figure 6.
Figure 6.. Inositol pyrophosphates pyrophosphorylate dynein IC.
(A) Bacterially expressed and purified IC(1–111) was phosphorylated in vitro by CK2, and phosphosite identification was contracted out to the Taplin Mass Spectrometry Facility, Harvard Medical School. The MS/MS spectrum is shown for the doubly phosphorylated peptide corresponding to residues 42–55 of mouse IC-2C (EAAVpSVQEEpSDLEK). The sequence shows the peptide fragmentation pattern, and the table shows masses of all b and y ions, highlighting the ions obtained in the spectrum. Arrows indicate fragment ions containing phosphorylated Ser residues. The mass of fragment y5 indicates phosphorylation of Ser51, and the masses of y10 and b10 correspond to phosphorylation of Ser46 and Ser51. (B) Bacterially expressed and purified GST or GST-tagged IC(1–70), IC(1–111), and IC(1–111)S51A were prephosphorylated with CK2 and unlabeled ATP and incubated with 5[β-32P]IP7. Proteins were resolved using NuPAGE and transferred to a PVDF membrane. Pyrophosphorylation was detected by phosphorimager scanning (right) and the proteins were detected by Ponceau S staining (left). The phosphorimager scan was subjected to ‘levels’ adjustment in Adobe Photoshop to improve visualization. The image intensity of the pyrophosphorylated protein was normalized to the corresponding total protein. The pyrophosphorylation intensity of each IC fragment was compared with GST. Data are mean ± range from two independent experiments. (C) Back-pyrophosphorylation of endogenous dynein IC by IP7. Dynein IC immunoprecipitated from Ip6k1+/+ and Ip6k1−/− MEFs was incubated with 5[β-32P]IP7, resolved by NuPAGE, and transferred to a PVDF membrane. Pyrophosphorylation was detected by phosphorimager scanning (right), and proteins were detected by western blotting (left). The image intensity of the pyrophosphorylated protein was normalized to the corresponding immunoprecipitated protein. The fold change in the extent of pyrophosphorylation of IC in Ip6k1−/− compared with Ip6k1+/+ MEFs is indicated. Data are mean ± SEM from three independent experiments. (D) Back-phosphorylation of endogenous dynein IC by CK2. Dynein IC immunoprecipitated from Ip6k1+/+ and Ip6k1−/− MEFs was incubated with CK2 and [γ-32P]ATP. Proteins were resolved and detected as in (C). The fold change in phosphorylation was calculated as in (C). Data are mean ± range from two independent experiments.
Figure 7.
Figure 7.. Pyrophosphorylation of IC regulates its interaction with p150Glued.
(A) Blots representative of two independent experiments showing the effect of IP6, 5-IP7, or 5-PCP-IP5 on the ability of prephosphorylated GST IC(1–111) to pull down endogenous p150Glued from HEK293T cell lysates. (B and C) Coimmunoprecipitation of dynein IC and p150Glued from Ip6k1+/+ and Ip6k1−/− MEFs. Protein extracts were cross-linked with a thiol-cleavable cross-linker, followed by immunoprecipitation of p150Glued and IC. Representative immunoblots of coimmunoprecipitation of IC with p150Glued (B) and p150Glued with IC (C). The levels of coimmunoprecipitated IC or p150Glued were normalized to the level of the immunoprecipitated partner. The fold change in the extent of coimmunoprecipitation in Ip6k1−/− compared with Ip6k1+/+ MEFs is indicated as mean ± SEM from three (B) and four (C) independent experiments. A higher extent of cross-linking led to more smearing of bands in (C) compared with (B) due to differences in the methods used for lysis. (D) Representative blots of subcellular fractions from Ip6k1+/+ and Ip6k1−/− MEFs prepared by differential centrifugation were resolved on a 4–12% NuPAGE gel and immunoblotted to detect dynein IC and p150Glued in TH, PNS, and MP. An increased amount of protein was loaded in the Ip6k1−/− fractions to enable visualization of the dynein IC. GM130 was used as a membrane marker and α-tubulin was used as a loading control. The level of each protein in the MP fraction was normalized to its levels in TH. The fold change in protein levels in Ip6k1−/− compared with Ip6k1+/+ MEFs is indicated below each blot. Data are mean ± SEM from three independent experiments. (E) HeLa cells were cotransfected with EYFP-Golgi (green) and vector control or IC(1–111) or IC(1–111)S51A, and nuclei were stained with DAPI (blue). Two representative fields from the same experiment are shown. Red arrows indicate intact Golgi, white arrows indicate partially dispersed Golgi, and yellow arrows indicate fragmented Golgi morphology. (F) Quantification of (E). EYFP-positive cells were categorized as shown in (E) according to their Golgi morphology, and the percentage of cells in each category was calculated for each experiment. Data are mean ± SEM of four independent experiments (total EYFP-positive cells analyzed were 154 for control cells; 241 and 194 for cells overexpressing IC(1–111) and IC(1–111)S51A, respectively). Data were analyzed using one-way ANOVA with Tukey's multiple comparison post hoc test; **P ≤ 0.01.

Comment in

References

    1. Stephens L., Radenberg T., Thiel U., Vogel G., Khoo K.H., Dell A. et al. (1993) The detection, purification, structural characterization, and metabolism of diphosphoinositol pentakisphosphate(s) and bisdiphosphoinositol tetrakisphosphate(s). J. Biol. Chem. 268, 4009–4015 PMID: - PubMed
    1. Menniti F.S., Miller R.N., Putney J.W. Jr and Shears S.B. (1993) Turnover of inositol polyphosphate pyrophosphates in pancreatoma cells. J. Biol. Chem. 268, 3850–3856 PMID: - PubMed
    1. Thota S.G. and Bhandari R. (2015) The emerging roles of inositol pyrophosphates in eukaryotic cell physiology. J. Biosci. 40, 593–605 doi:10.1007/s12038-015-9549-x - DOI - PubMed
    1. Wundenberg T. and Mayr G.W. (2012) Synthesis and biological actions of diphosphoinositol phosphates (inositol pyrophosphates), regulators of cell homeostasis. Biol. Chem. 393, 979–998 doi:10.1515/hsz-2012-0133 - DOI - PubMed
    1. Saiardi A., Erdjument-Bromage H., Snowman A.M., Tempst P. and Snyder S.H. (1999) Synthesis of diphosphoinositol pentakisphosphate by a newly identified family of higher inositol polyphosphate kinases. Curr. Biol. 9, 1323–1326 doi:10.1016/S0960-9822(00)80055-X - DOI - PubMed

Publication types