. 2016 Sep 16;82(19):6010-8.
doi: 10.1128/AEM.01299-16. Print 2016 Oct 1.

Transcriptional Control in Marine Copiotrophic and Oligotrophic Bacteria with Streamlined Genomes

Affiliations

Transcriptional Control in Marine Copiotrophic and Oligotrophic Bacteria with Streamlined Genomes

Matthew T Cottrell et al. Appl Environ Microbiol. .

Abstract

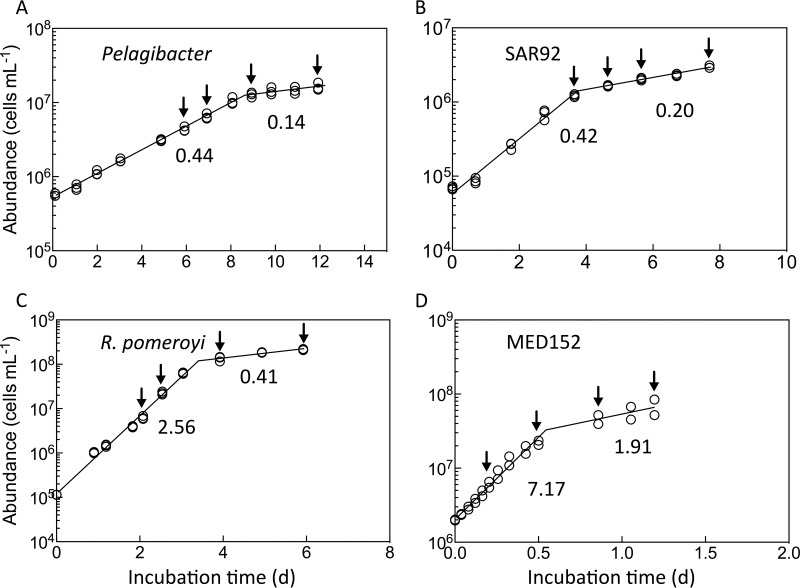
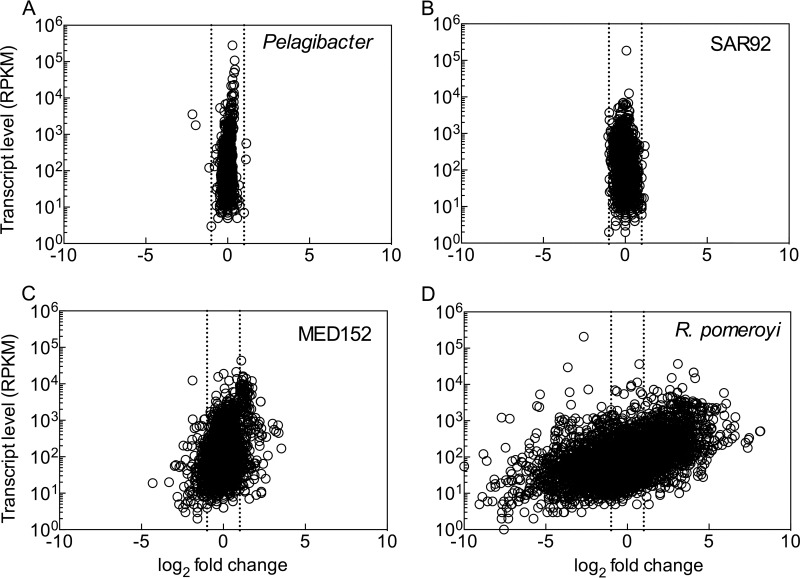
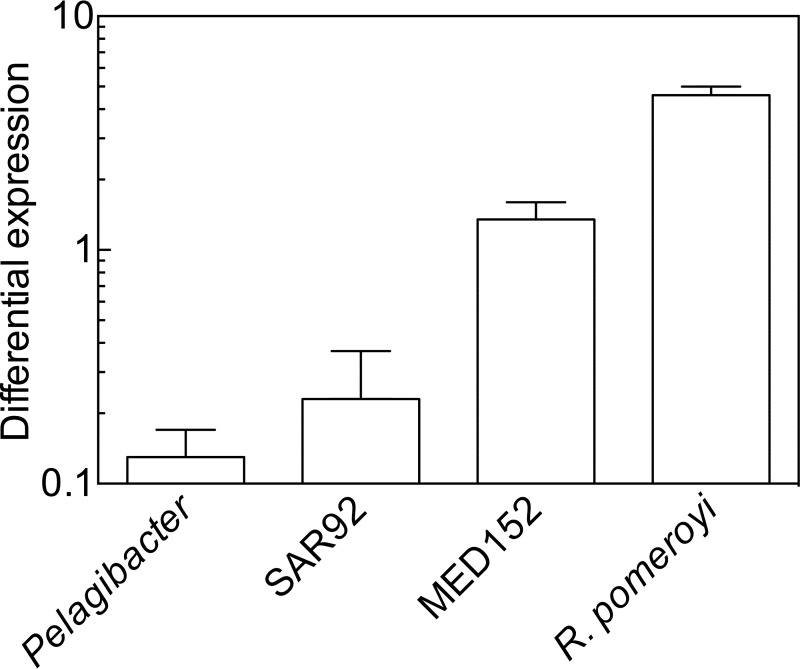
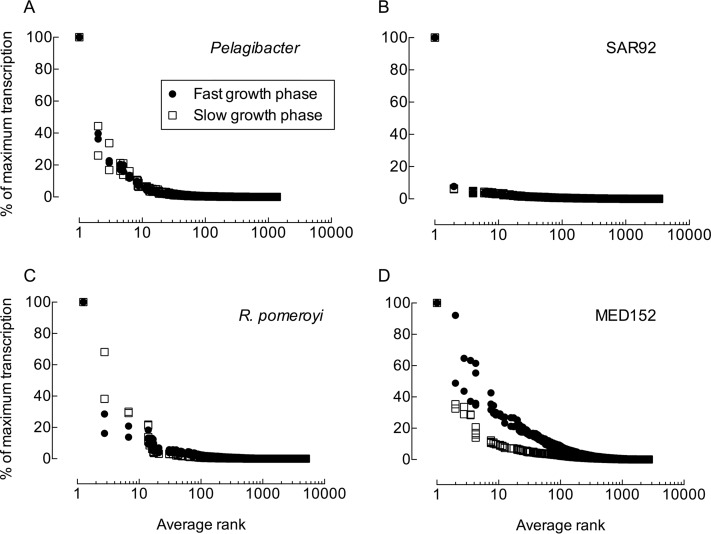
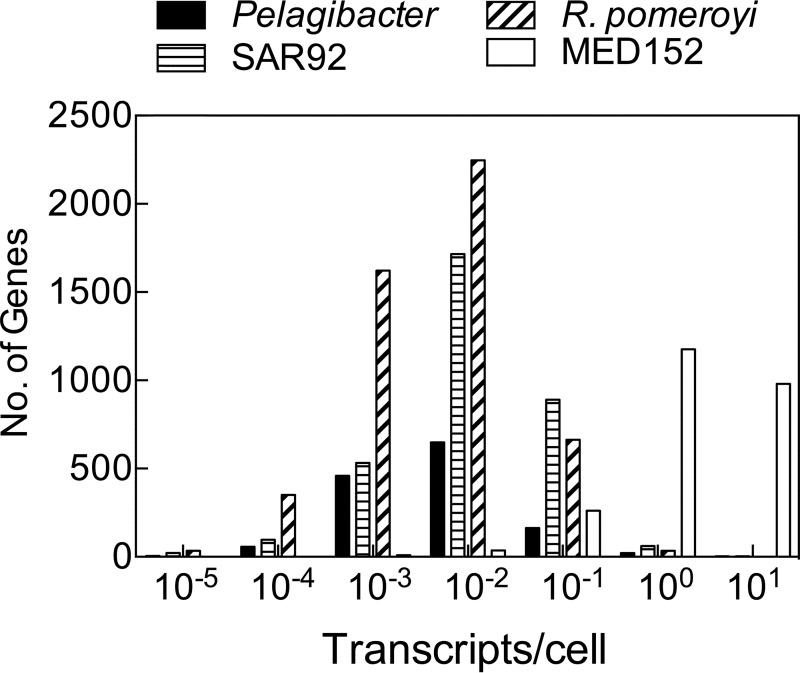
Bacteria often respond to environmental stimuli using transcriptional control, but this may not be the case for marine bacteria such as "Candidatus Pelagibacter ubique," a cultivated representative of the SAR11 clade, the most abundant organism in the ocean. This bacterium has a small, streamlined genome and an unusually low number of transcriptional regulators, suggesting that transcriptional control is low in Pelagibacter and limits its response to environmental conditions. Transcriptome sequencing during batch culture growth revealed that only 0.1% of protein-encoding genes appear to be under transcriptional control in Pelagibacter and in another oligotroph (SAR92) whereas >10% of genes were under transcriptional control in the copiotrophs Polaribacter sp. strain MED152 and Ruegeria pomeroyi When growth levels changed, transcript levels remained steady in Pelagibacter and SAR92 but shifted in MED152 and R. pomeroyi Transcript abundances per cell, determined using an internal RNA sequencing standard, were low (<1 transcript per cell) for all but a few of the most highly transcribed genes in all four taxa, and there was no correlation between transcript abundances per cell and shifts in the levels of transcription. These results suggest that low transcriptional control contributes to the success of Pelagibacter and possibly other oligotrophic microbes that dominate microbial communities in the oceans.

Importance: Diverse heterotrophic bacteria drive biogeochemical cycling in the ocean. The most abundant types of marine bacteria are oligotrophs with small, streamlined genomes. The metabolic controls that regulate the response of oligotrophic bacteria to environmental conditions remain unclear. Our results reveal that transcriptional control is lower in marine oligotrophic bacteria than in marine copiotrophic bacteria. Although responses of bacteria to environmental conditions are commonly regulated at the level of transcription, metabolism in the most abundant bacteria in the ocean appears to be regulated by other mechanisms.


Figures

FIG 1
FIG 1
Abundance of four marine bacterial taxa, including Pelagibacter (A), gammaproteobacterium SAR92 (B), R. pomeroyi (C), and Polaribacter MED152 (D). Abundances were determined in triplicate (A, B, and C) or duplicate (D) cultures. Arrows indicate the times when transcripts were sampled. Fast-growth and slow-growth phases of the batch cultures are distinguished by the change in slope of the solid line, which was calculated by segmented regression analysis. Pelagibacter, R. pomeroyi, and MED152 were sampled twice during the fast and slow phases of growth. SAR92 was sampled once during the fast phase of growth and three times during the slow phase of growth. Values adjacent to the growth curves are growth rates (per day [d−1]) calculated for the fast and slow phases of growth.
FIG 2
FIG 2
Transcript levels in the fast-growth and slow-growth phases of batch culture in four marine bacterial taxa, including Pelagibacter (A), gammaproteobacterium SAR92 (B), Polaribacter MED152 (C), and R. pomeroyi (D). Transcript levels during the fast-growth phase are plotted versus the log2 fold change in transcript level between the fast-growth phase and slow-growth phase of batch culture growth. Transcript level data represent the numbers of reads mapping to a gene normalized by the gene length and the total numbers of mapped reads (RPKM). The dotted lines indicate a 2-fold change in the level of transcription between the fast- and slow-growth phases.
FIG 3
FIG 3
Percentage of protein-encoding genes normalized to shifts in growth rate in four marine bacterial taxa transcribed at significantly (false-discovery rate [FDR] < 0.05) higher (2-fold) levels during the fast-growth phase compared to the slow-growth phase of batch culture. Error bars are standard deviations (SD); n = 3 cultures.
FIG 4
FIG 4
Rank abundance of (A) Pelagibacter, (B) gammaproteobacterium SAR92, (C) R. pomeroyi, and (D) Polaribacter MED152 transcripts during the fast-growth and slow-growth phases of batch culture. The rank for each transcript was determined from the average abundance determined for four samples collected during the fast-growth and slow-growth phases of batch culture for Pelagibacter, R. pomeroyi, and MED152. The SAR92 culture was sampled once during the fast-growth phase and three times during the slow-growth phase. Maximum transcription was set to 100% for the transcript with a rank value of 1.
FIG 5
FIG 5
Frequency distribution of transcript abundance per cell for protein-encoding genes in Pelagibacter, gammaproteobacterium SAR92, R. pomeroyi, and Polaribacter MED152. Values are averages (n = 4) for the entire growth curve. The numbers on the x axis indicate the upper limit for each bin.

References

    1. Asakura H, Ishiwa A, Arakawa E, Makino SI, Okada Y, Yamamoto S, Igimi S. 2007. Gene expression profile of Vibrio cholerae in the cold stress-induced viable but non-culturable state. Environ Microbiol 9:869–879. doi:10.1111/j.1462-2920.2006.01206.x. - DOI - PubMed
    1. Delpin MW, Goodman AE. 2009. Nutrient regime regulates complex transcriptional start site usage within a Pseudoalteromonas chitinase gene cluster. ISME J 3:1053–1063. doi:10.1038/ismej.2009.54. - DOI - PubMed
    1. Morris AR, Visick KL. 2010. Control of biofilm formation and colonization in Vibrio fischeri: a role for partner switching? Environ Microbiol 12:2051–2059. - PMC - PubMed
    1. Thiele S, Fuchs BM, Amann R, Iversen MH. 2015. Colonization in the photic zone and subsequent changes during sinking determine bacterial community composition in marine snow. Appl Environ Microbiol 81:1463–1471. doi:10.1128/AEM.02570-14. - DOI - PMC - PubMed
    1. Wear EK, Carlson CA, James AK, Brzezinski MA, Windecker LA, Nelson CE. 2015. Synchronous shifts in dissolved organic carbon bioavailability and bacterial community responses over the course of an upwelling-driven phytoplankton bloom. Limnol Oceanogr 60:657–677. doi:10.1002/lno.10042. - DOI

Publication types