. 2017 May;232(5):1053-1068.
doi: 10.1002/jcp.25508. Epub 2016 Sep 21.

Functional Effects of Cigarette Smoke-Induced Changes in Airway Smooth Muscle Mitochondrial Morphology

Affiliations

Functional Effects of Cigarette Smoke-Induced Changes in Airway Smooth Muscle Mitochondrial Morphology

Bharathi Aravamudan et al. J Cell Physiol. 2017 May.

Abstract

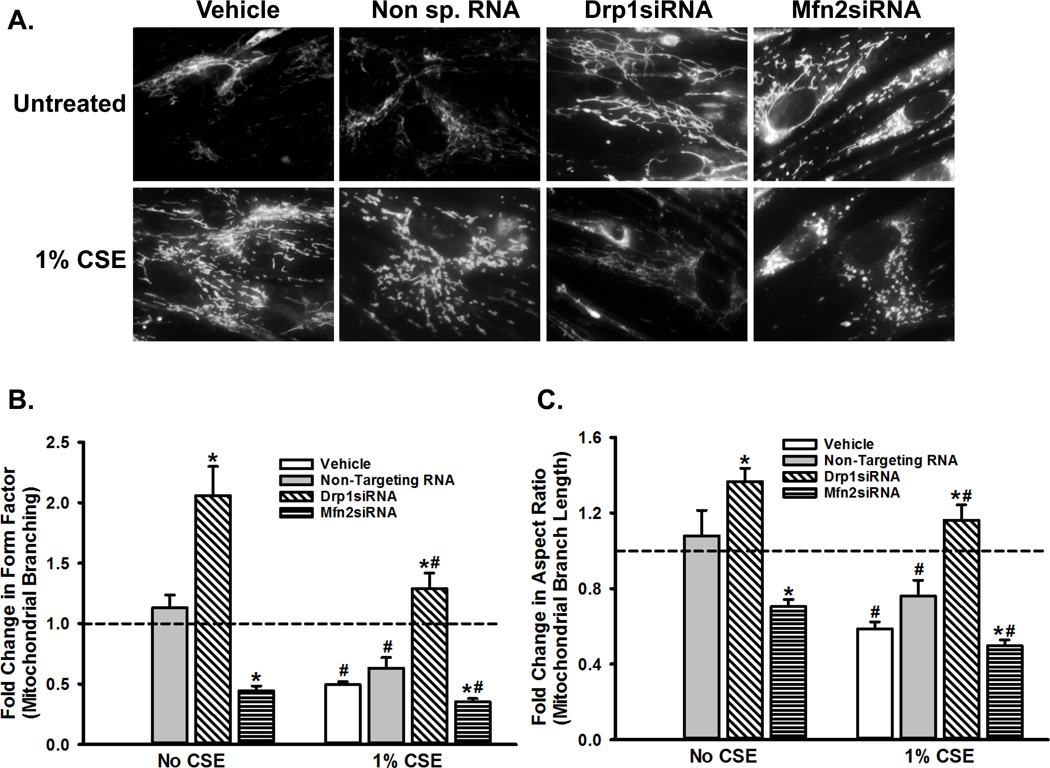
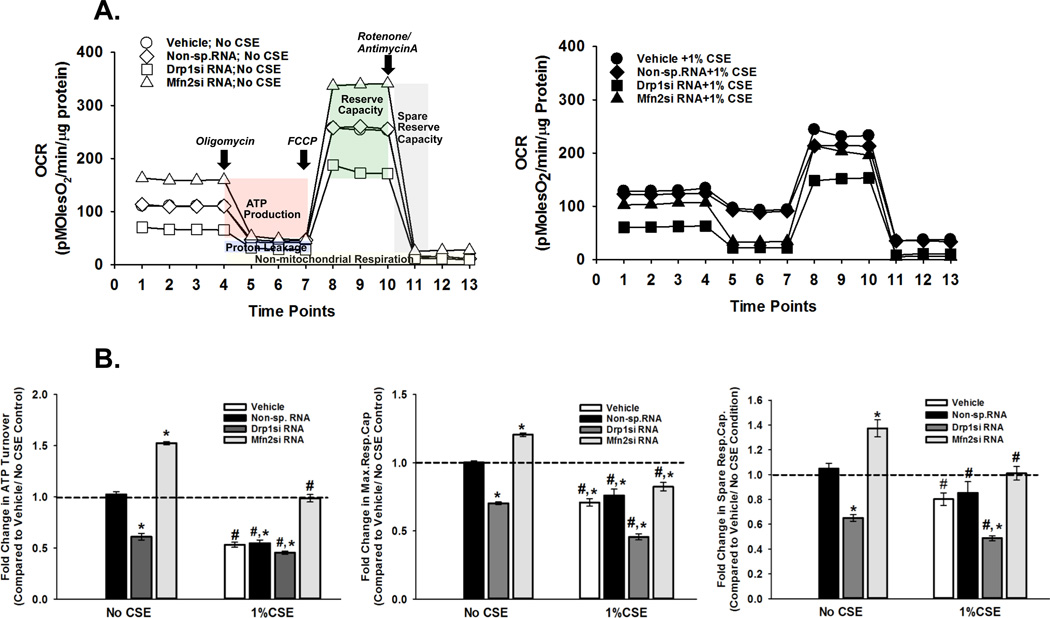
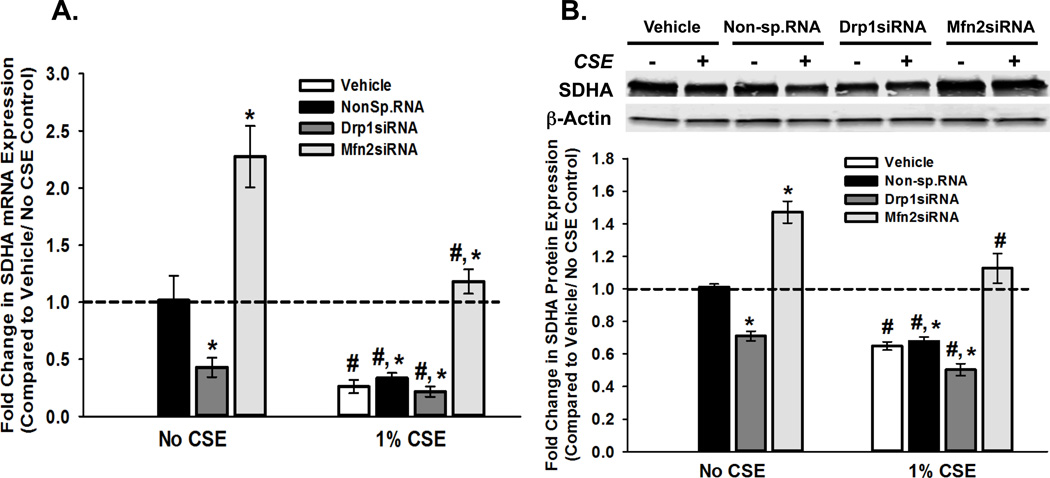
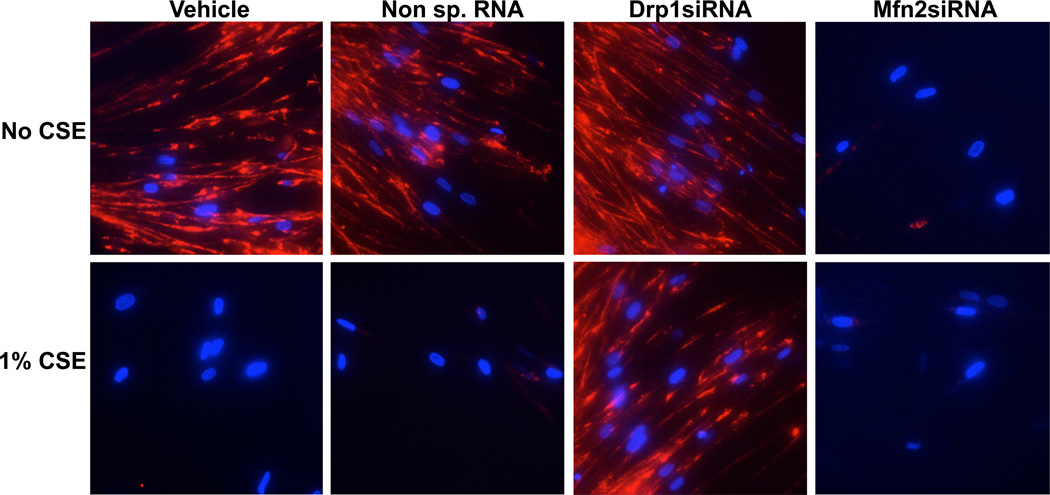
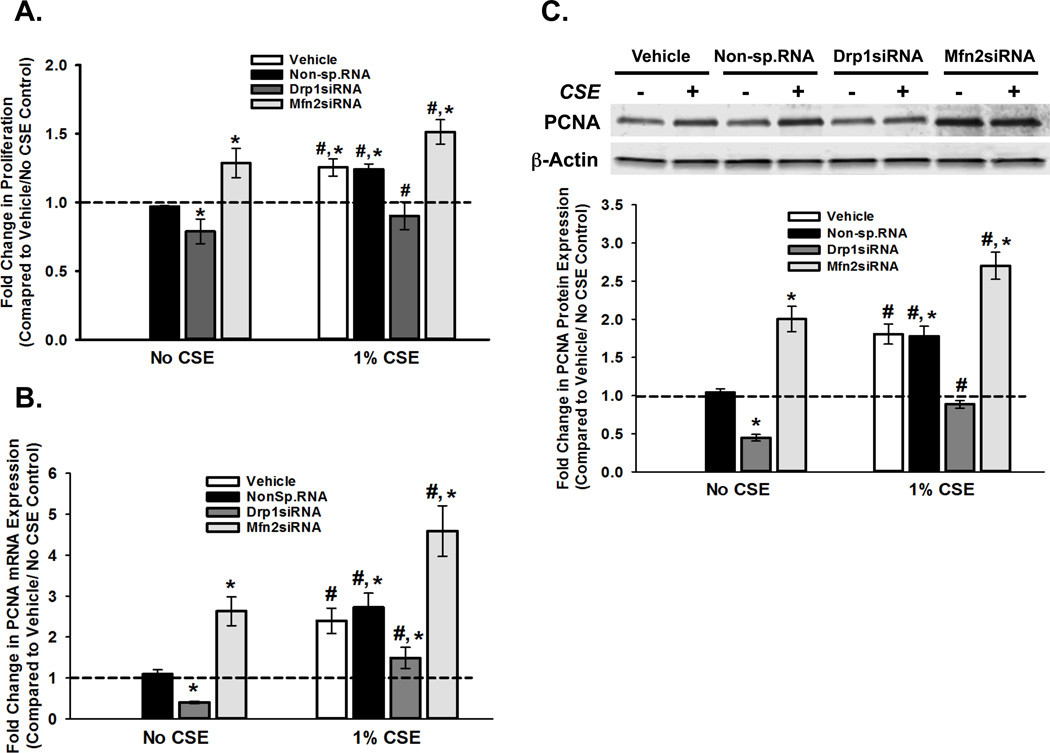
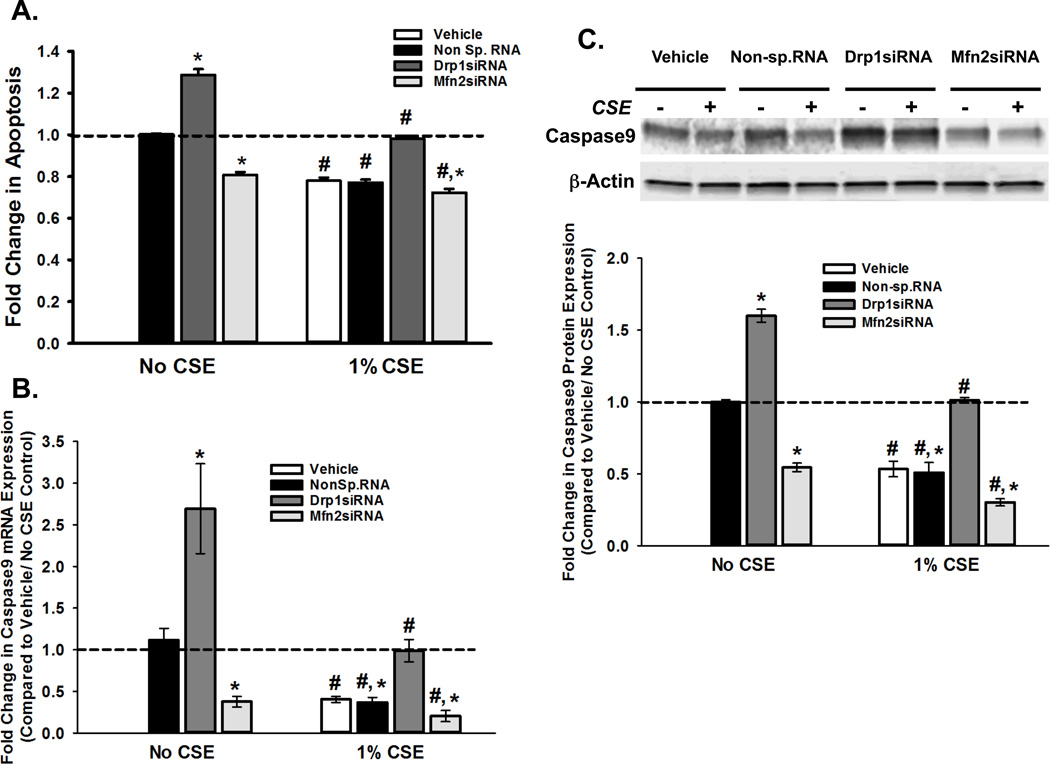
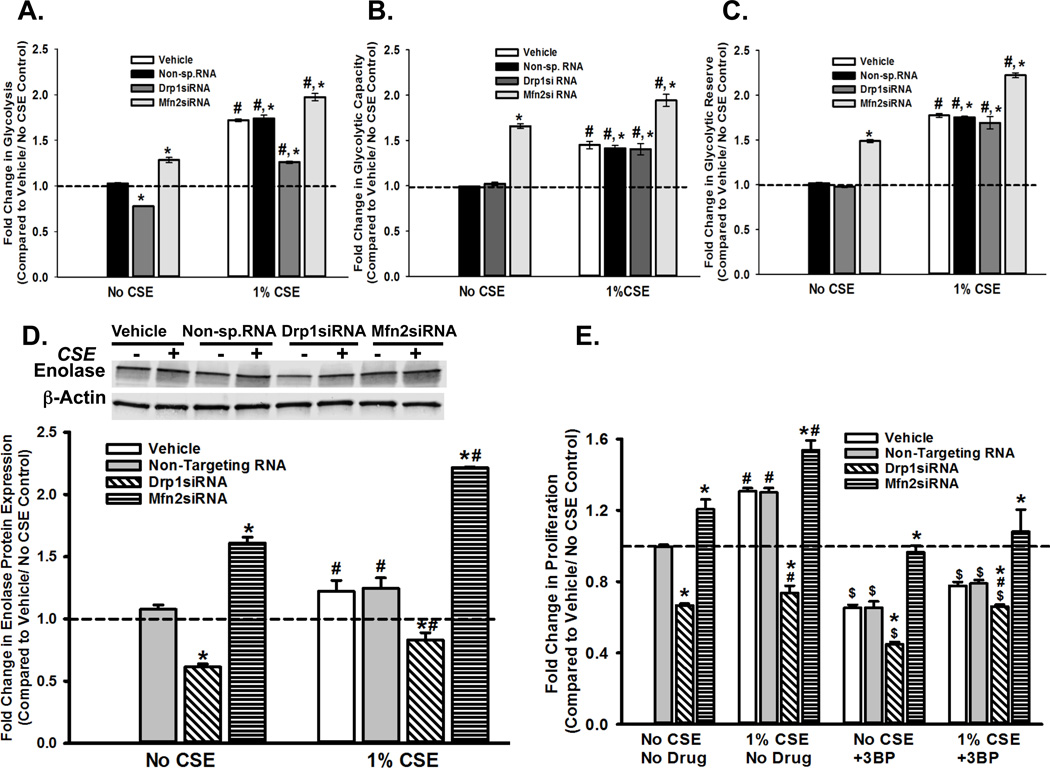
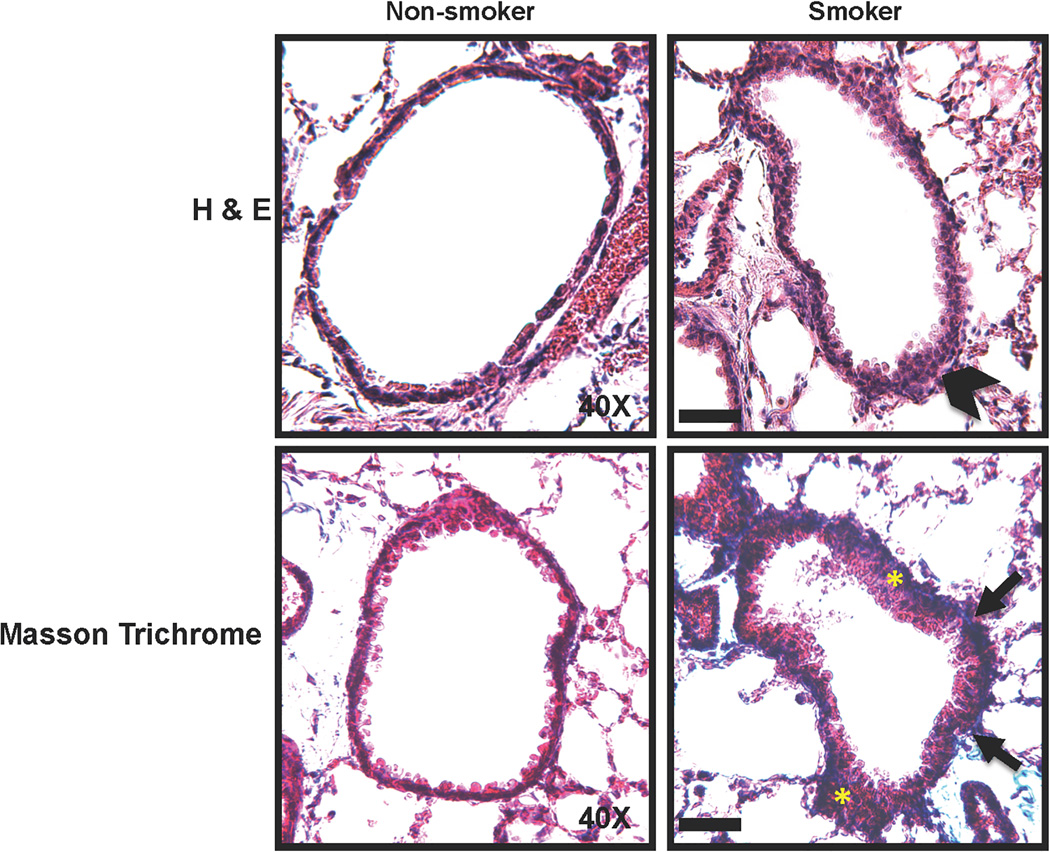
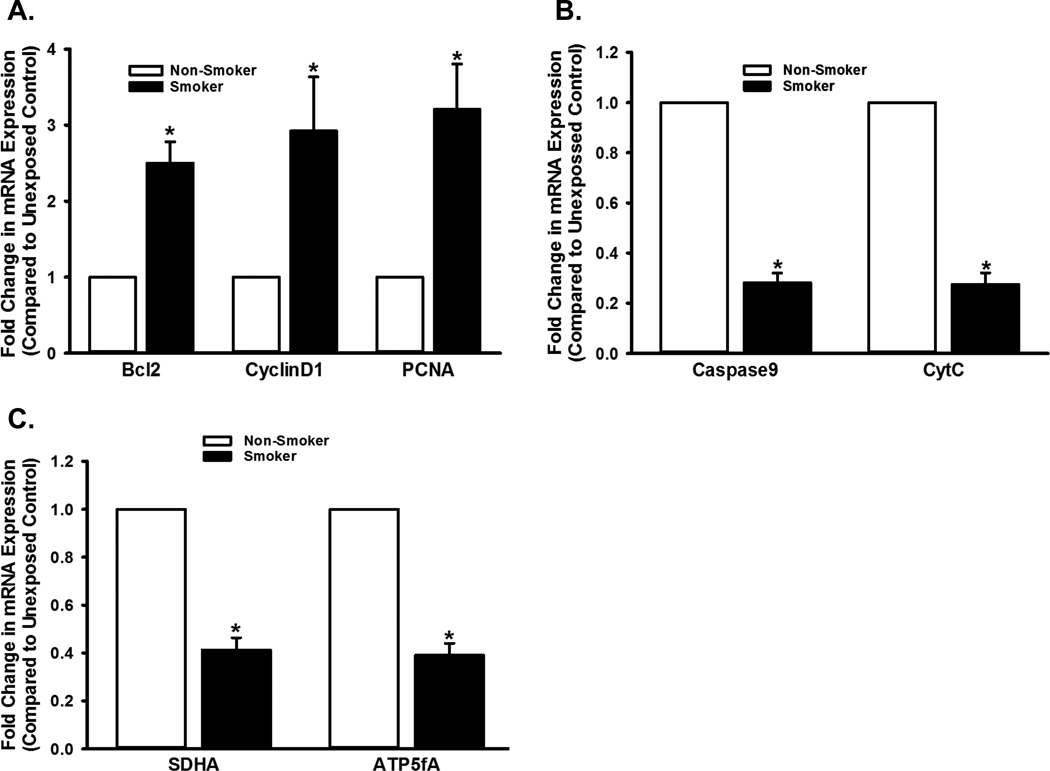
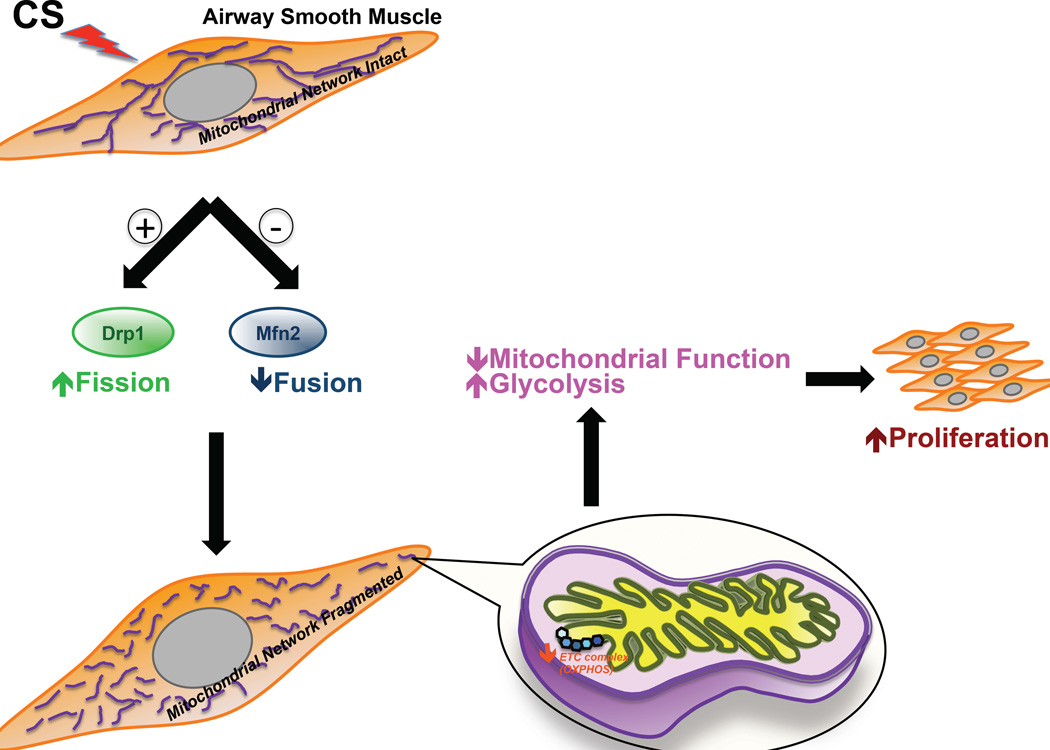
Long-term exposure to cigarette smoke (CS) triggers airway hyperreactivity and remodeling, effects that involve airway smooth muscle (ASM). We previously showed that CS destabilizes the networked morphology of mitochondria in human ASM by regulating the expression of mitochondrial fission and fusion proteins via multiple signaling mechanisms. Emerging data link regulation of mitochondrial morphology to cellular structure and function. We hypothesized that CS-induced changes in ASM mitochondrial morphology detrimentally affect mitochondrial function, leading to CS effects on contractility and remodeling. Here, ASM cells were exposed to 1% cigarette smoke extract (CSE) for 48 h to alter mitochondrial fission/fusion, or by inhibiting the fission protein Drp1 or the fusion protein Mfn2. Mitochondrial function was assessed via changes in bioenergetics or altered rates of proliferation and apoptosis. Our results indicate that both exposure to CS and inhibition of mitochondrial fission/fusion proteins affect mitochondrial function (i.e., energy metabolism, proliferation, and apoptosis) in ASM cells. In vivo, the airways in mice chronically exposed to CS are thickened and fibrotic, and the expression of proteins involved in mitochondrial function is dramatically altered in the ASM of these mice. We conclude that CS-induced changes in mitochondrial morphology (fission/fusion balance) correlate with mitochondrial function, and thus may control ASM proliferation, which plays a central role in airway health. J. Cell. Physiol. 232: 1053-1068, 2017. © 2016 Wiley Periodicals, Inc.


Conflict of interest statement

The authors have no conflict of interest to declare.

Figures

Figure 1
Figure 1. Mitochondrial morphology is dynamically regulated by chronic exposure of ASM cells to CS or by altering the expression of proteins involved in fission and fusion
ASM cells were transfected with siRNA against mitochondrial fission protein Drp1 or the fusion protein Mfn2, and were either exposed to medium or to 1% CSE for 48h. Mitochondria were marked by loading the cells with 400nM MitoTracker Green, and were imaged. ‘Vehicle’ refers to ‘No Transfection’ control where the transfection reagent Lipofectamine, with no DNA or RNA, was added to the cells. A non-specific siRNA was used to control for siRNA specificity. A) Representative images depicting the normal, fragmented or hyperfused morphology of the mitochondrial tracks in an ASM cell. B–C) Quantification of mitochondrial morphology, as assessed by Form Factor that measures mitochondrial branching (B), and Aspect Ratio that measures the length of the branches (C). Both Form Factor and Aspect Ratio are indictors of the complexity of mitochondrial network in a cell.
Figure 2
Figure 2. Energy metabolism is defective in CS-exposed ASM cells
ASM cells, transfected with siRNA against mitochondrial fission protein Drp1 or the fusion protein Mfn2, were either exposed to medium or 1% CSE for 24h before OCR (Oxygen consumption rate) was measured on an XFe24 Extracellular Flux Analyzer. ‘Vehicle’ refers to ‘No Transfection’ control where the transfection reagent Lipofectamine, with no DNA or RNA, was added to the cells. A non-specific siRNA was used to control for siRNA specificity. A. Representative graphs depicting the OCR trends when the cells were unexposed (left) or exposed to 1% CSE (right). CS clearly reduces ATP production and Spare Reserve Capacity. B. Quantification of mitochondrial bioenergetics in terms of ATP production, Maximum Respiratory Capacity and Spare Respiratory Capacity. All three parameters are lowered by CS. (N=4; * indicates significant difference from ‘Vehicle Only’ control; # indicates significant difference between Unexposed and CS-exposed systems; P<0.05).
Figure 3
Figure 3. CS-induced fission-fusion imbalance regulates the expression of genes involved in mitochondrial energy metabolism in ASM cells
A–B. ASM cells, transfected with siRNA against mitochondrial fission protein Drp1 or the fusion protein Mfn2, were either exposed to medium or 1% CSE for 48h before total RNA or total protein was isolated. ‘Vehicle’ refers to ‘No Transfection’ control where the transfection reagent Lipofectamine, with no DNA or RNA, was added to the cells. A non-specific siRNA was used to control for siRNA specificity. A. Total RNA was reverse transcribed and the cDNA was used in Q-PCR to measure the expression of SDHA enzyme, a vital component of ETC (See Table 3 for another ETC marker ATP5A). Inhibition of fission (Drp1siRNA) lessens SDHA mRNA expression, while Mfn2siRNA augments it. Exposure to CS reduces SDHA expression in all four transfection systems. (N=4; * indicates significant difference from ‘Vehicle Only’ control; # indicates significant difference between Unexposed and CS-exposed systems; P<0.05). B. Expression of SDHA protein shows a trend similar to that of its mRNA. A representative gel is presented on top, with β-Actin as the loading control. The graph below depicts the quantification of protein expression from data collected from 4 different ASM populations. See Table 4 for another ETC protein ATP5A. (N=4; * indicates significant difference from ‘Vehicle Only’ control; # indicates significant difference between Unexposed and CS-exposed systems; P<0.05).
Figure 4
Figure 4. CS-regulation of mitochondrial membrane potential
ASM cells, transfected with siRNA against mitochondrial fission protein Drp1 or the fusion protein Mfn2, were either exposed to medium or 1% CSE for 48h before mitochondrial membrane integrity was visualized using 50 nM TMRE (Tetramethyl rhodamine ethyl ester; red). CSE and Mfn2siRNA, both of which instigate mitochondrial fragmentation, clearly cause a collapse in MMP. Cell nuclei are marked with DAPI (Blue). ‘Vehicle’ refers to ‘No Transfection’ control where the transfection reagent Lipofectamine was added to the cells in the absence of DNA or RNA. A non-specific siRNA was used to control for siRNA specificity.
Figure 5
Figure 5. CS-regulation of mitochondrial morphology impacts ASM proliferation
ASM cells, transfected with siRNA against mitochondrial fission protein Drp1 or the fusion protein Mfn2, were either exposed to medium or 1% CSE for 48h before cell proliferation was assayed. ‘Vehicle’ refers to ‘No Transfection’ control where the transfection reagent Lipofectamine was added to the cells in the absence of DNA or RNA. A non-specific siRNA was used to control for siRNA specificity. A. Cell proliferation was measured using the CyQuant NF fluorescence dye system on a Flex Station3 microplate reader. Results indicate Drp1 to be pro-proliferative as inhibition via siRNA decreases proliferation; Conversely, Mfn2 is anti-proliferataive as siRNA treatment increases ASM cell proliferation. CS treatment increases proliferation in all systems. (N=4; * indicates significant difference from ‘Vehicle Only’ control; # indicates significant difference between unexposed and CS-exposed systems; P<0.05) B–C. ASM cells, transfected with siRNA against mitochondrial fission protein Drp1 or the fusion protein Mfn2, were either exposed to medium or 1% CSE for 48h before total RNA or total protein was isolated. B. Total RNA was reverse transcribed and the cDNA was used in Q-PCR to measure the expression of PCNA, a gene product that marks the onset of cell proliferation (See Table 3 for proliferation markers Bcl2 and Cyclin D). Expression of PCNA mRNA is downregulated when fission is inhibited (Drp1siRNA), and is upregulated when fusion is blocked (Mfn2siRNA). Exposure to CS elevates PCNA expression in all four transfection systems. (N=4; * indicates significant difference from ‘Vehicle Only’ control; # indicates significant difference between unexposed and CS-exposed systems; P<0.05). C. Expression of PCNA protein shows a trend similar to that of its mRNA. A representative gel is presented with β-Actin as the loading control. The graph depicts the quantification of protein expression from data collected from 4 different ASM populations. See Table 4 for other proliferation proteins Cyclin D1 and Bcl2. (N=4; * indicates significant difference from ‘Vehicle Only’ control; # indicates significant difference between unexposed and CS-exposed systems; P<0.05).
Figure 6
Figure 6. CS-regulation of mitochondrial morphology impacts ASM apoptosis
ASM cells, transfected with siRNA against mitochondrial fission protein Drp1 or the fusion protein Mfn2, were either exposed to medium or 1% CSE for 48h before apoptosis was assayed. ‘Vehicle’ refers to ‘No Transfection’ control where the transfection reagent Lipofectamine was added to the cells in the absence of DNA or RNA. A non-specific siRNA was used to control for siRNA specificity. A. Apoptotic cell death was measured using the Multiparameter Apoptosis Kit, which integrates fluorescence readings from MMP marker TMRE and cell number and nuclear morphology marker Hoechst dye with those of apoptosis marker Annexin V. Drp1 seems to be anti-apoptotic, as its inhibition via siRNA increases cell death; Mfn2, on the other hand promotes apoptosis. CS treatment increases proliferation in all systems. (N=4; * indicates significant difference from ‘Vehicle Only’ control; # indicates significant difference between unexposed and CS-exposed systems; P<0.05). B–C. ASM cells, transfected with siRNA against mitochondrial fission protein Drp1 or the fusion protein Mfn2, were either exposed to medium or 1% CSE for 48h before total RNA or total protein was isolated. ‘Vehicle’ refers to ‘No Transfection’ control where the transfection reagent Lipofectamine was added to the cells in the absence of DNA or RNA. A non-specific siRNA was used to control for siRNA specificity. A. Total RNA was reverse transcribed and the cDNA was used in Q-PCR to measure the expression of Caspase9, a marker for apoptosis (See Table 3 for another marker Cytochrome C). Expression of Caspase9 mRNA increases when fission is inhibited (Drp1siRNA), and is lowered when fusion is blocked (Mfn2siRNA). Exposure to CS reduces Caspase9 expression in all four transfection systems. (N=4; * indicates significant difference from ‘Vehicle Only’ control; # indicates significant difference between unexposed and CS-exposed systems; P<0.05). B. Expression of Caspase9 protein shows a trend similar to that of its mRNA. A representative gel is presented with β-Actin as the loading control. The graph depicts the quantification of protein expression from data collected from 4 different ASM populations. See Table 4 for another apoptosis protein Cytochrome C. (N=4; * indicates significant difference from ‘Vehicle Only’ control; # indicates significant difference between unexposed and CS-exposed systems; P<0.05).
Figure 7
Figure 7. CS exposure and perturbation of mitochondrial fission-fusion balance drive ASM cells towards glycolysis for ATP production
A–C. ASM cells, transfected with siRNA against mitochondrial fission protein Drp1 or the fusion protein Mfn2, were either exposed to medium or 1% CSE for 24h before ECAR (Extracellular acidification rate), an indicator of glycolysis, was measured on an XFe24 Extracellular Flux Analyzer. ‘Vehicle’ refers to ‘No Transfection’ control where the transfection reagent Lipofectamine, with no DNA or RNA, was added to the cells. A non-specific siRNA was used to control for siRNA specificity. An increase was observed in all three aspects of ECAR: the rate of glycolysis (A) glycolytic capacity (B) and glycolytic reserve (C), following CS exposure. (N=4; * indicates significant difference from ‘Vehicle Only’ control; # indicates significant difference between unexposed and CS-exposed systems; P<0.05) D. Total protein was isolated from untransfected, and Drp1- or Mfn2siRNA-transfected ASM cells and subjected to immunoblotting to analyze expression of glycolysis marker Enolase. (See Table 4 for another glycolysis marker LDHA). Inhibition of fission (Drp1siRNA) lessens Enolase expression, while Mfn2siRNA augments it. A representative gel is presented with β-Actin as the loading control. The graph depicts the quantification of protein expression from data collected from 4 different ASM populations. Exposure to CS elevates Enolase expression in all four transfection systems. (N=4; * indicates significant difference from ‘Vehicle Only’ control; # indicates significant difference between unexposed and CS-exposed systems; P<0.05). E. Untransfected, and Drp1- or Mfn2siRNA-transfected ASM cells were treated with 100 µM 3-BP, an inhibitor of an early stage glycolysis enzyme hexokinase, before CS exposure. Cell proliferation was measured using the CyQuant NF fluorescence dye system on a Flex Station3 microplate reader. Results indicate inhibition of proliferation by 3-BP. CS treatment partially reverses 3-BP effects. (N=4; * indicates significant difference from ‘Vehicle Only’ control; # indicates significant difference between unexposed and CS-exposed systems; P<0.05)
Figure 8
Figure 8. Chronic exposure to CS causes airway thickening and remodeling
A mouse model of chronic CS exposure was developed and lungs processed for histology (see Methods for details). Hematoxylin and eosin (H&E) and Masson Trichrome staining protocols were performed on 5µm lung sections. Increased thickening of the airway (arrowhead) enhanced cell proliferation (yellow asterisks) and pronounced collagen infiltration (blue fibrous staining denoted by arrows) are evident in the lung sections from CS-exposed mice. Scale bar = 50µm.
Figure 9
Figure 9. Chronic exposure to CS modulates multiple aspects of mitochondrial function in the airway
ASM layer was obtained from unexposed and CS-exposed mice (see Methods for details), using LCM. Messages corresponding to proteins involved in cell proliferation, apoptosis, and ETC were analyzed and quantified by real-time PCR. Quantifiable changes in mRNA expression were observed: CS upregulates proliferation (A), marked by an increase in the expression of Bcl2, CyclinD1 and PCNA. Expression of apoptosis markers Caspase9 and CytC (B), and ETC markers SDHA and ATP5A (D) are decreased in CS exposed airways, compared to unexposed controls. Ribosomal protein S16 was used as reference, and unexposed control was used as the calibrator. (N=16; * indicates significant difference from unexposed control; P<0.05).
Figure 10
Figure 10. CS-induced changes in mitochondrial morphology lead to mitochondrial dysfunction and ASM proliferation
Model depicting the effects of CS exposure on ASM. CS disrupts mitochondrial networking in the ASM by decreasing the expression of the fusion protein Mfn2 and increasing the expression of the fission protein Drp1. In consequence, the bioenergetic function of mitochondria becomes defective, making ATP production more dependent on glycolysis than on oxidative phosphorylation. This switch in metabolic pathway preference (along with other possible mechanisms such as increased ROS production, and increased autophagy/ mitophagy) promotes cell proliferation contributing to airway remodeling.

References

    1. Eisner MD. Environmental tobacco smoke and adult asthma. Exp Lung Res. 2005;31(Suppl 1):8–14. - PubMed
    1. Feinson JA, Chidekel AS. Adult smoking and environmental tobacco smoke: a persistent health threat to children. Del Med J. 2006;78:213–218. - PubMed
    1. Lodrup Carlsen KC, Jaakkola JJ, Nafstad P, Carlsen KH. In utero exposure to cigarette smoking influences lung function at birth. Eur Respir J. 1997;10:1774–1779. - PubMed
    1. Omini C, Hernandez A, Zuccari G, Clavenna G, Daffonchio L. Passive cigarette smoke exposure induces airway hyperreactivity to histamine but not to acetylcholine in guinea-pigs. Pulm Pharmacol. 1990;3:145–150. - PubMed
    1. Thomson NC. The role of environmental tobacco smoke in the origins and progression of asthma. Curr Allergy Asthma Rep. 2007;7:303–309. - PubMed

Publication types

LinkOut - more resources