

doi: 10.1121/1.4954870.
Sound source localization identification accuracy: Level and duration dependencies
Affiliations
- PMID: 27475204
- PMCID: PMC5848824
- DOI: 10.1121/1.4954870
Item in Clipboard
Sound source localization identification accuracy: Level and duration dependencies
J Acoust Soc Am.
2016 Jul.
Abstract
Sound source localization accuracy for noises was measured for sources in the front azimuthal open field mainly as a function of overall noise level and duration. An identification procedure was used in which listeners identify which loudspeakers presented a sound. Noises were filtered and differed in bandwidth and center frequency. Sound source localization accuracy depended on the bandwidth of the stimuli, and for the narrow bandwidths, accuracy depended on the filter's center frequency. Sound source localization accuracy did not depend on overall level or duration.
Figures
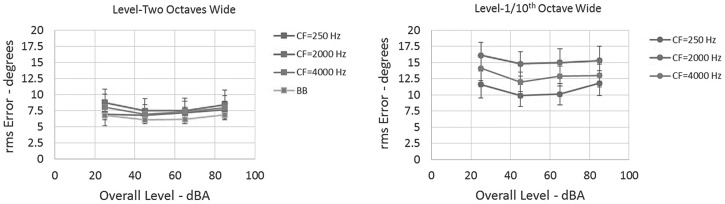
(Color online) Mean (12 listeners) rms errors in degrees as a function of overall level in dB SPL for the filtered conditions. Left figure: Data for 2-octave wide noise bands (CFs of 250, 2000, and 4000 Hz) and a broadband (BB) condition. Right figure: Data for the 1/10th octave filter conditions (at the three CFs). Error bars are ± one standard deviation.
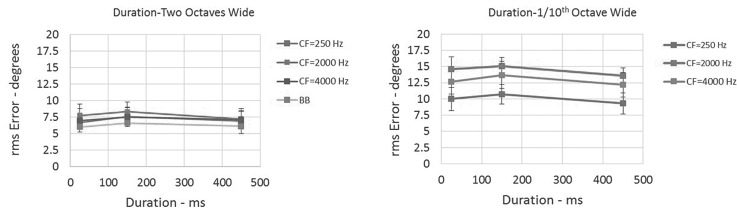
(Color online) Mean (12 listeners) rms errors in degrees as a function of stimulus duration in ms for the filtered conditions. Left figure: Data for 2-octave wide noise bands (CFs of 250, 2000, and 4000 Hz) and a BB condition. Right figure: Data for the 1/10th octave filter conditions (at three CFs). Error bars are ± one standard deviation.
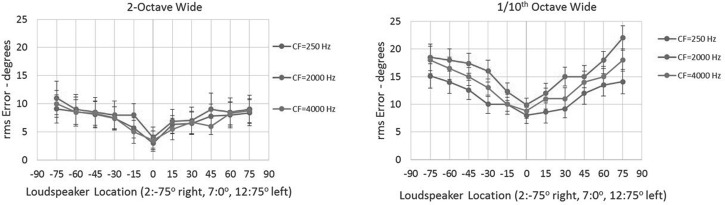
(Color online) Mean (24 listeners) rms errors in degrees as a function of the eleven loudspeaker locations (2: −75° right, 7: 0° center, 12: 75° left). Left figure: Data for the 2-octave wide filter conditions (CFs of 250, 2000, and 4000 Hz). Right figure: Data for the 1/10th octave filter conditions (CFs of 250, 2000, and 4000 Hz). Data are averaged over duration, overall level, and listeners. Error bars are ± one standard deviation.
Similar articles
-
Sound source localization identification accuracy: Envelope dependencies.J Acoust Soc Am. 2017 Jul;142(1):173. doi: 10.1121/1.4990656. J Acoust Soc Am. 2017. PMID: 28764438 Free PMC article.
-
Sound source localization identification accuracy: bandwidth dependencies.J Acoust Soc Am. 2014 Nov;136(5):2737-46. doi: 10.1121/1.4898045. J Acoust Soc Am. 2014. PMID: 25373973
-
Individual listener differences in azimuthal front-back reversals.J Acoust Soc Am. 2019 Oct;146(4):2709. doi: 10.1121/1.5129555. J Acoust Soc Am. 2019. PMID: 31671982 Free PMC article.
-
The effects of aging and interaural delay on the detection of a break in the interaural correlation between two sounds.Ear Hear. 2009 Apr;30(2):273-86. doi: 10.1097/AUD.0b013e318198703d. Ear Hear. 2009. PMID: 19194287
-
Auditory Model-Based Sound Direction Estimation With Bilateral Cochlear Implants.Trends Hear. 2015 Dec 1;19:2331216515616378. doi: 10.1177/2331216515616378. Trends Hear. 2015. PMID: 26631106 Free PMC article. Review.
Cited by
-
Audiovisual Interactions in Front and Rear Space.Front Psychol. 2018 May 15;9:713. doi: 10.3389/fpsyg.2018.00713. eCollection 2018. Front Psychol. 2018. PMID: 29867678 Free PMC article.
-
Sound source localization identification accuracy: Envelope dependencies.J Acoust Soc Am. 2017 Jul;142(1):173. doi: 10.1121/1.4990656. J Acoust Soc Am. 2017. PMID: 28764438 Free PMC article.
-
Measuring "Where": A Comparative Analysis of Methods Measuring Spatial Perception.Sensors (Basel). 2023 Nov 27;23(23):9434. doi: 10.3390/s23239434. Sensors (Basel). 2023. PMID: 38067807 Free PMC article.
-
Sound Localization Ability in Dogs.Vet Sci. 2022 Nov 8;9(11):619. doi: 10.3390/vetsci9110619. Vet Sci. 2022. PMID: 36356096 Free PMC article.
-
Strength of onset and ongoing cues in judgments of lateral position.J Acoust Soc Am. 2017 Jul;142(1):206. doi: 10.1121/1.4990020. J Acoust Soc Am. 2017. PMID: 28764482 Free PMC article.
References
-
- Blauert, J. (1997). Spatial Hearing ( MIT Press, Cambridge, MA: ).
-
- Dubrovsky, N. A. , and Chernyak, R. R. (1971). “ The size and the localization of noise images of different durations of noise,” 7th International Congress on Acoustics, Budapest, 25H4.
-
- Florentine, M. , Popper, A. N. , and Fay, R. R. (2011). Loudness ( Springer, New York).
-
- Mills, A. W. (1972). “ Auditory localization,” in Foundations of Modern Auditory Theory, edited by Tobias J. V. ( Academic, New York), Vol. 2, Chap. 8.
Publication types
MeSH terms
Grants and funding
LinkOut - more resources
Full Text Sources
Other Literature Sources
Medical